. 2020 Feb:134:104647.
doi: 10.1016/j.nbd.2019.104647. Epub 2019 Nov 10.

A characterization of Gaucher iPS-derived astrocytes: Potential implications for Parkinson's disease

Affiliations

A characterization of Gaucher iPS-derived astrocytes: Potential implications for Parkinson's disease

Elma Aflaki et al. Neurobiol Dis. 2020 Feb.

Abstract

While astrocytes, the most abundant cells found in the brain, have many diverse functions, their role in the lysosomal storage disorder Gaucher disease (GD) has not been explored. GD, resulting from the inherited deficiency of the enzyme glucocerebrosidase and subsequent accumulation of glucosylceramide and its acylated derivative glucosylsphingosine, has both non-neuronopathic (GD1) and neuronopathic forms (GD2 and 3). Furthermore, mutations in GBA1, the gene mutated in GD, are an important risk factor for Parkinson's disease (PD). To elucidate the role of astrocytes in the disease pathogenesis, we generated iAstrocytes from induced pluripotent stem cells made from fibroblasts taken from controls and patients with GD1, with and without PD. We also made iAstrocytes from an infant with GD2, the most severe and progressive form, manifesting in infancy. Gaucher iAstrocytes appropriately showed deficient glucocerebrosidase activity and levels and substrate accumulation. These cells exhibited varying degrees of astrogliosis, Glial Fibrillary Acidic Protein (GFAP) up-regulation and cellular proliferation, depending on the level of residual glucocerebrosidase activity. Glutamte uptake assays demonstrated that the cells were functionally active, although the glutamine transporter EEAT2 was upregulated and EEAT1 downregulated in the GD2 samples. GD2 iAstrocytes were morphologically different, with severe cytoskeletal hypertrophy, overlapping of astrocyte processes, pronounced up-regulation of GFAP and S100β, and significant astrocyte proliferation, recapitulating the neuropathology observed in patients with GD2. Although astrocytes do not express α-synuclein, when the iAstrocytes were co-cultured with dopaminergic neurons generated from the same iPSC lines, excessive α-synuclein released from neurons was endocytosed by astrocytes, translocating into lysosomes. Levels of aggregated α-synuclein increased significantly when cells were treated with monomeric or fibrillar α-synuclein. GD1-PD and GD2 iAstrocytes also exhibited impaired Cathepsin D activity, leading to further α-synuclein accumulation. Cytokine and chemokine profiling of the iAstrocytes demonstrated an inflammatory response. Thus, in patients with GBA1-associated parkinsonism, astrocytes appear to play a role in α-synuclein accumulation and processing, contributing to neuroinflammation.

Keywords: Alpha-synuclein; Astrocytes; GBA1; Gaucher disease; Glucocerebrosidase; Induced pluriopotent stem cells; Parkinson's disease.


Figures

Figure 1.
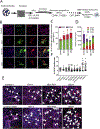
Figure 1.. Differentiation of iAstrocytes from GD or control iPSCs.
A.Generation of iAtrocytes from iPSCs.B. iAstrocytes from Control, GD1 (with or without PD) and GD2 iPSCs were stained for astrocytes markers CD44 (purple), S100β (green) and GFAP (red) one week after exposure to CNTF and BMP4. C. The.percentage of GFAP or S100β positive cells were measured in the CD44+ population derived from three independent differentiations D. Intensity of the GFAP and S100β per μm/area were measured using Black Zen software from three independent differentiations. E. Astrogliosis was measured in iAstrocytes. iAstrocytes were stained for Ki-67 (green), S100β (purple and GFAP (red). Scale bars; 10μm. F.The percentage of Ki-67 positive nuclei was calculated (arrows show Ki-67 positive nuclei). Statistically significant differences were seen in iAstrocytes differentiated from both GD2 colonies compared to the infant control iAstrocytes : *p=0.04 Graph represents data from three independent experiments.
Figure 2.
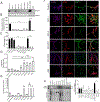
Figure 2.. iPS-derived astrocytes recapitulate the GD phenotype.
A.Western blot analysis of GCase in iAstrocytes from controls, GD1 (with or without PD) and GD2. β-actin used as a loading control. Data represents results from 3 independent experiments B.Quantification of the western blot shown in panel A. C. GCase activity (percentage of control) in iAstrocytes. Graph represents data from 2 independent differentations. Each experiment was performed 2 times in triplicate for each differentiation. D-E. GlcCer(C) [*p=0.04, **p=0.006;0.0016;***p=0.0002] and GluSph (D) [***p=0.0003] levels measured in iAstrocytes using HPLC/MS/MS. Data reperesents pooled data from three independent experimenrs and each sample was analyzed in quadriplicates. F. iAstrocytes were stained for Aqu4 (green), S100β (purple) and GFAP (red). Scale bars; 5μm. G.Western blot analysis was performed on samples obtained from 2 independent differentiations and Aquaporine 4 expression was normalized to total protein.
Figure 3.
Figure 3.. Functional characterization of iAstrocytes.
A-B. iAstrocytes from subjects with GD1 (with or without PD) and GD2 were stained for EAAT2 and EAAT1 (A/B) (Green), S100β (red) and GFAP (purple). Scale bars=5μm. C. Western blot analysis of EAAT2 (*p=0.03;0,02) and EAAT1(*p=0.035) levels in iAstrocytes. β-actin is used as the loading control. Graphs show the quantification of the results as the ratio of EAAT2 (66 kDa) or EAAT1 to β-actin. Results from some iAstrocytes derived from two different colonies from the same fibroblast line are shown. Graphs represents pooled data from 4 experiments obtained from 2 independent differentiation. D. L-glutamate uptake assay performed on iAstrocytes. iAstrocytes cleared L-glutamate in a time dependent manner. The uptake was blocked by the presence of 2mM L-trans-pyrrolidine-2,4-dicarboxylic acid (PDC). Graph represents data from 4 independent experiments, each in triplicate.
Figure 4.
Figure 4.. Calcium response to extracellular ATP.
A. iAstrocytes were stained with Fluo-4AM and were stimulated with 3μM ATP. Fluorescence at 494/516 nm was measured kinetically for 150 min. B. Bar graph representing the % of area under curve from 4 independent experiments. C. Images show representative neurite segments used to analyse synaptogenesis. Neurons were stained with PSD95 (red), Synapsin1 (green) and MAP2 (white). (Scale bar; 5μm). The number of PSD95+/Synapsin1+ puncta were analysed (graph) using Puncta analyzer. Data represents pooled data from two independent differentations and each experiment was repeated four times.
Figure 5.
Figure 5.. Co-culture of iDopaminergic neurons with iAstrocytes
iDopaminergic neurons were co-cultured with iAstrocytes derived from the same iPSC line using transwells (0.4μm pores). A. The cell lysates and supernatant of (iDA) top panel and B. cell lysates of iAstrocytes (bottom panel) were analyzed for α-syn. Coomassi-blue staining was used as the loading control for the supernatant. C. Immunoblotting of α-syn in iAstrocytes in the presence and absence of added monomeric α-syn or fibrils. The graph represents data from two independent differentiations and four experiments.D. iAstrocytes were treated with monomeric (*p=0.02; ***p=0.0001;0.0003) or fibrillar (*p=0.01; ***p=0.0006) α-syn and HTRF was performed after a 48 h after incubation. Data represents two independent differentations and experiments were performed two times and in triplicate. D-F. ELISA quantification of human α-syn in the lysates and supernatants of iAstrocytes after treatment with monomeric or fibrillar α-syn for 48h. Graph represents pooled data from two independent differentiations and four experiments, each performed in triplicate.
Figure 6.
Figure 6.. Trafficking of labeled-α-syn in iAstrocytes
A. iAstrocytes were treated with labeled α-syn (green) for 24h, and then fixed and stained for Rab5 (red) and GFAP (purple). Z-stack images were acquired using a Zeiss 880 confocal microscope (63X magnification). Insets, Higher magnification of the areas outlined in the images as shown. Scale bars; 5 μm. B-C. Western blot analysis of Rab7 and Rab11 levels in iAstrocytes in the presence or absence of monomeric or fibrillar α-syn for 48h. β-actin was used as the loading control. D-E. Quantification of Rab7 (*p=0.026; ***p=0.0001) and Rab11 (**p=0.002;***p=0.0002) levels in iAstrocytes in the presence and absence of monomer or fibril α-syn. Experiments were perfomed from 2 indipendent differentiation.
Figure 7.
Figure 7.. Cathepsin D in iAstrocytes
A. iAstrocytes were treated with labeled α-syn (green) for 48h and then stained for CathD (red), Lamp1 (white) and GFAP (purple). B. Western blot analysis of Lamp2 in iAstrocytes from control, GD1, GD1-PD and GD2 iAstrocytes, β-actin was used as the loading control. C. Immunoblot analysis of CathD levels in iAstrocytes. The graph represents CathD levels measured from two independent differentiations (*p=0.008). D. CathD activity in iAstrocytes in the presence and absence of monomeric and fibrillar α-syn, measured in two independent differentiations and pooled data from four different experiments (*p=0.026;**p=0.008;***p=0.0001,0.0006).
Figure 8.
Figure 8.. Proteome profiler array of cytokines/chemokines in iAstrocytes
Levels of secreted cytokines and chemokines measured in control, GD1, GD1-PD and GD2 iAstrocytes stimulated with monomeric or fibullar α-syn for 48h.

References

    1. Aflaki E, et al., 2016. A New Glucocerebrosidase Chaperone Reduces alpha-Synuclein and Glycolipid Levels in iPSC-Derived Dopaminergic Neurons from Patients with Gaucher Disease and Parkinsonism. J Neurosci. 36, 7441–52. - PMC - PubMed
    1. Aflaki E, et al., 2014. Macrophage models of Gaucher disease for evaluating disease pathogenesis and candidate drugs. Sci Transl Med. 6, 240ra73. - PMC - PubMed
    1. Allen NJ, 2014. Synaptic plasticity: Astrocytes wrap it up. Curr Biol. 24, R697–9. - PubMed
    1. Belanger M, Magistretti PJ, 2009. The role of astroglia in neuroprotection. Dialogues Clin Neurosci. 11, 281–95. - PMC - PubMed
    1. Braak H, et al., 2007. Development of alpha-synuclein immunoreactive astrocytes in the forebrain parallels stages of intraneuronal pathology in sporadic Parkinson’s disease. Acta Neuropathol. 114, 231–41. - PubMed

Publication types

MeSH terms

Substances