

Virus-induced natural killer cell lysis of T cell subsets
- PMID: 31670188
- PMCID: PMC7553765
- DOI: 10.1016/j.virol.2019.10.003
Virus-induced natural killer cell lysis of T cell subsets
Abstract
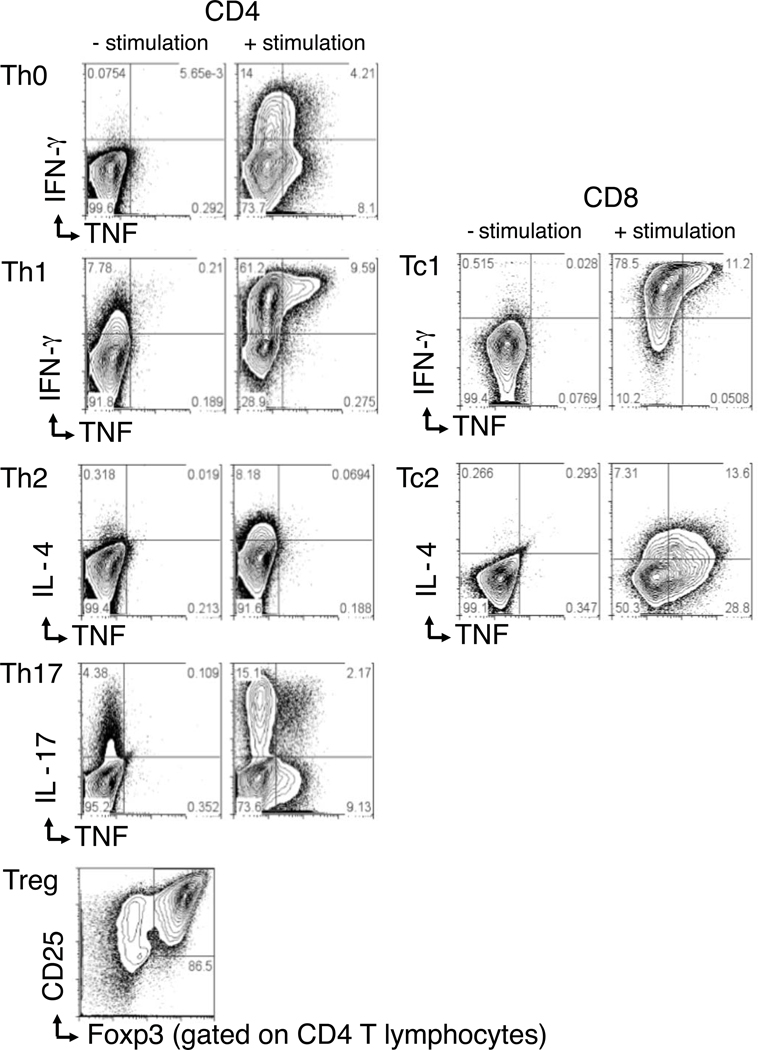
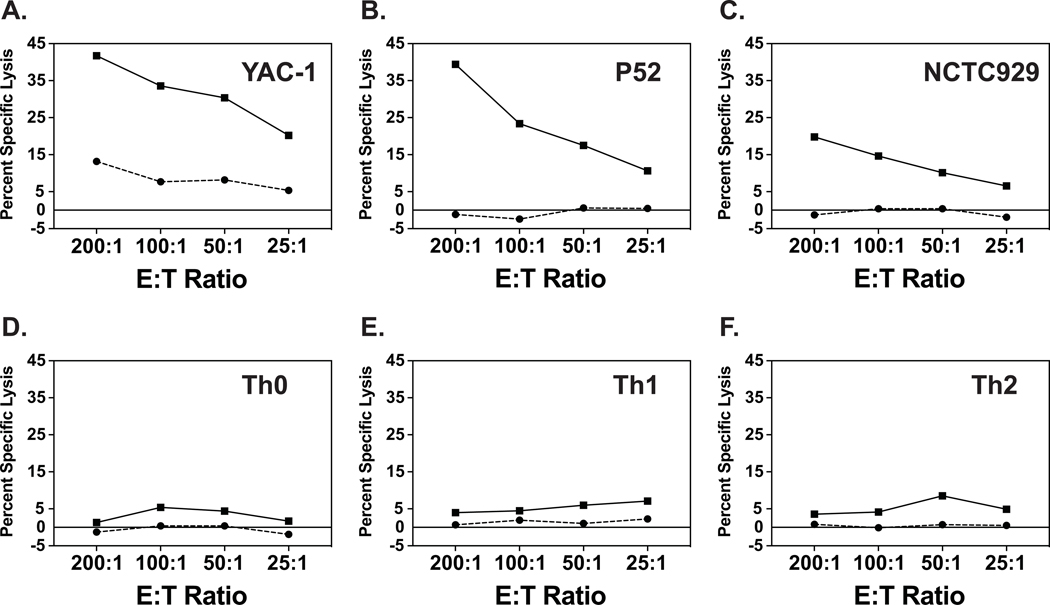
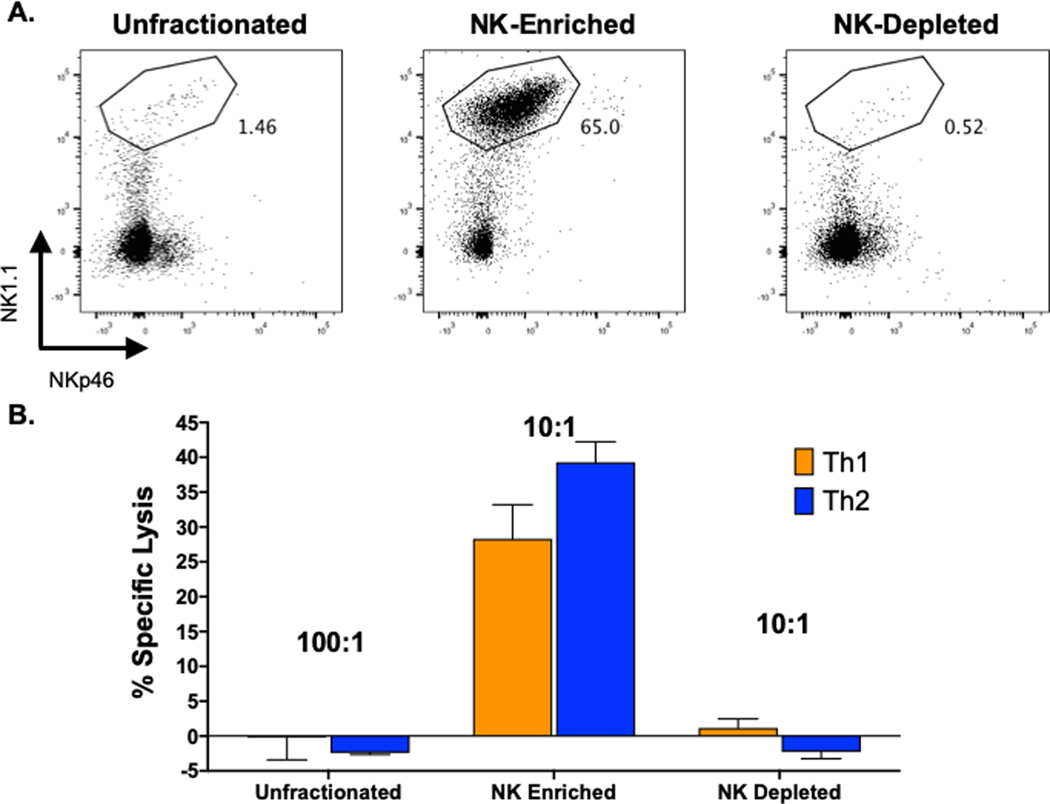
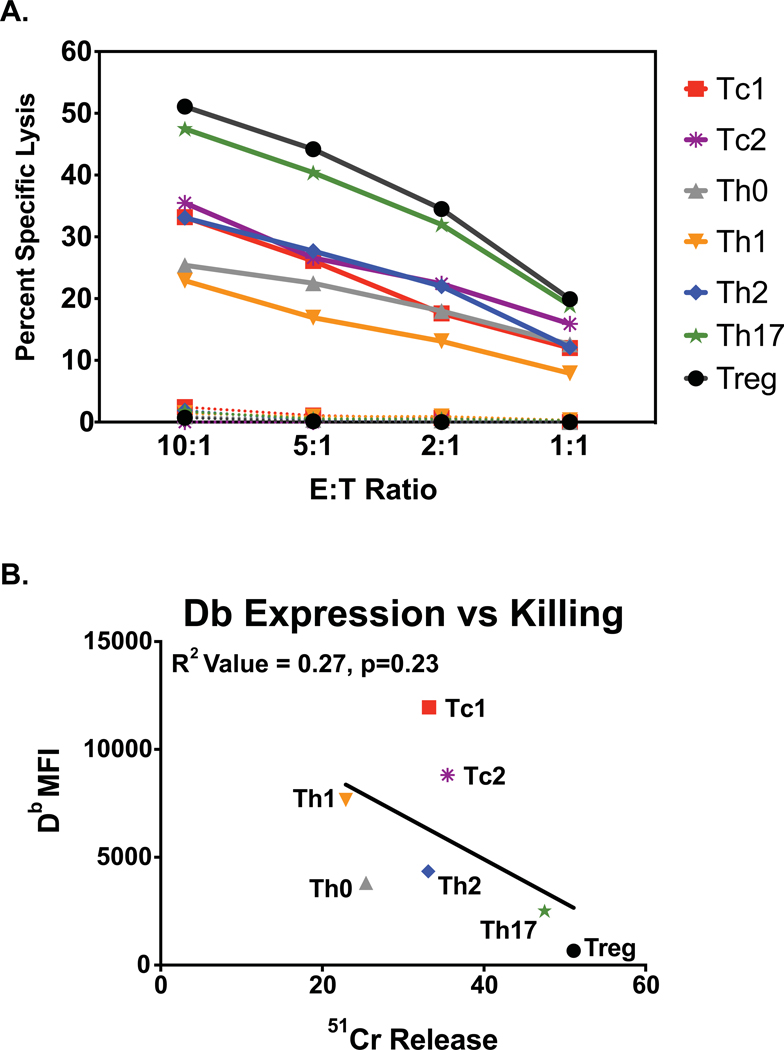
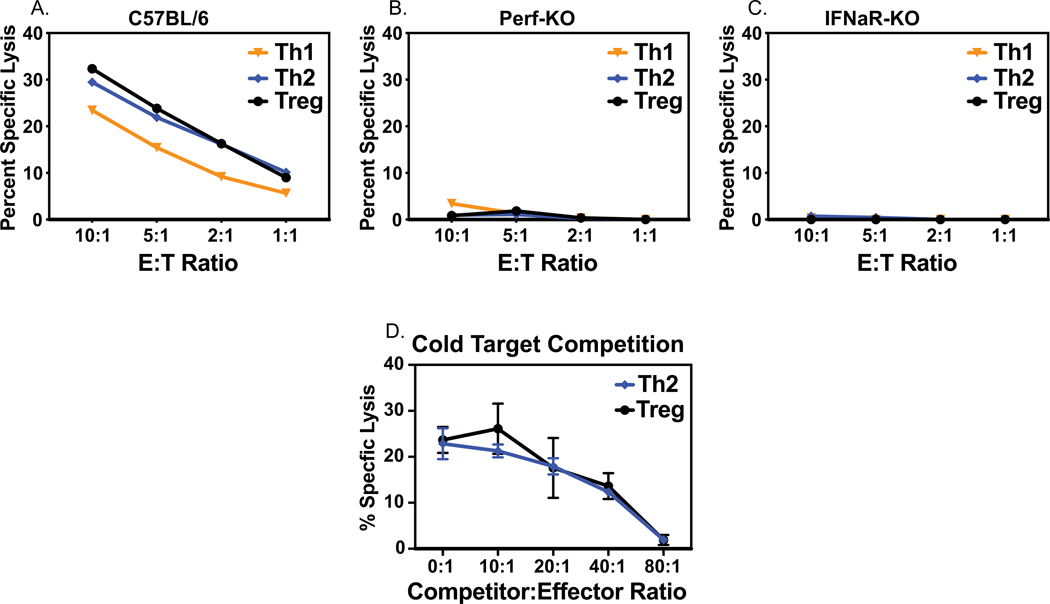
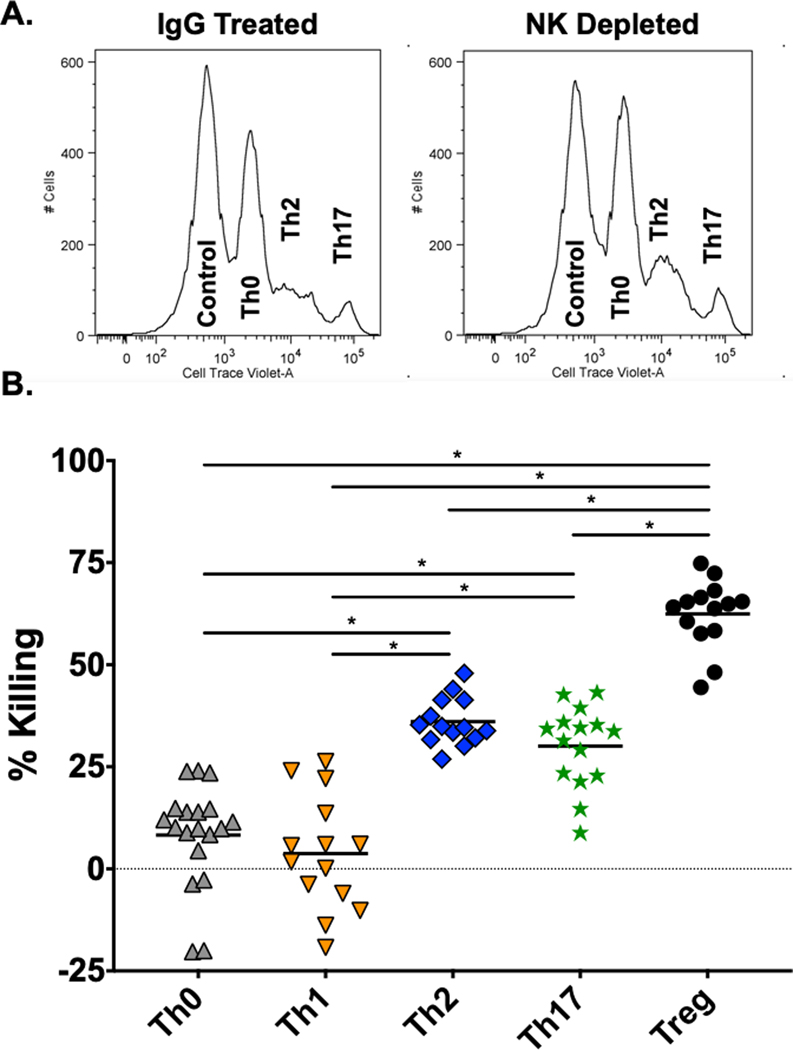
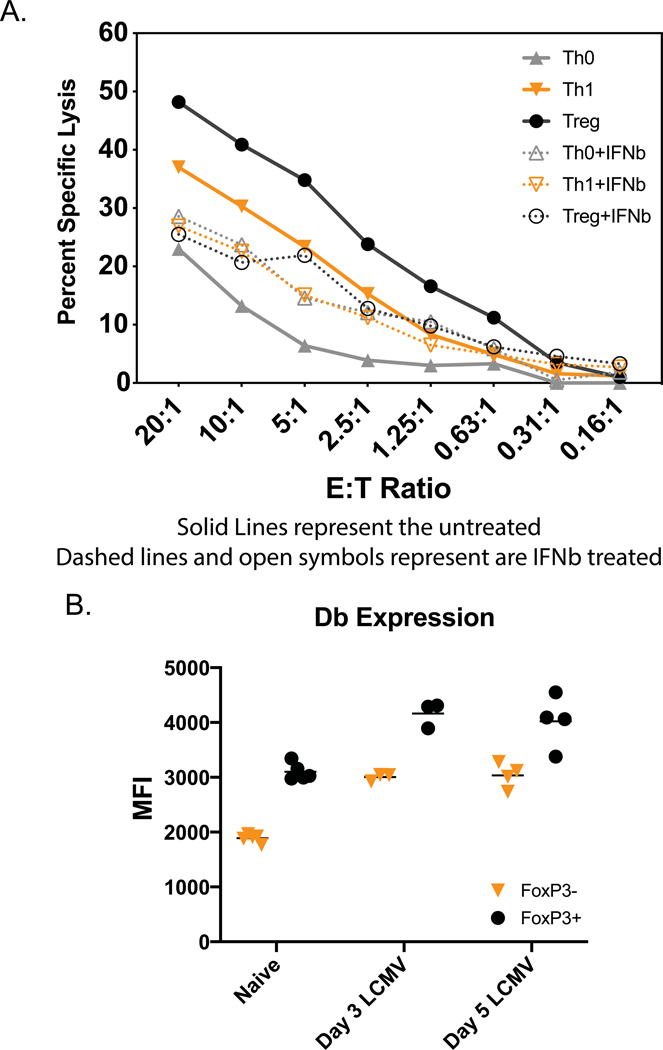
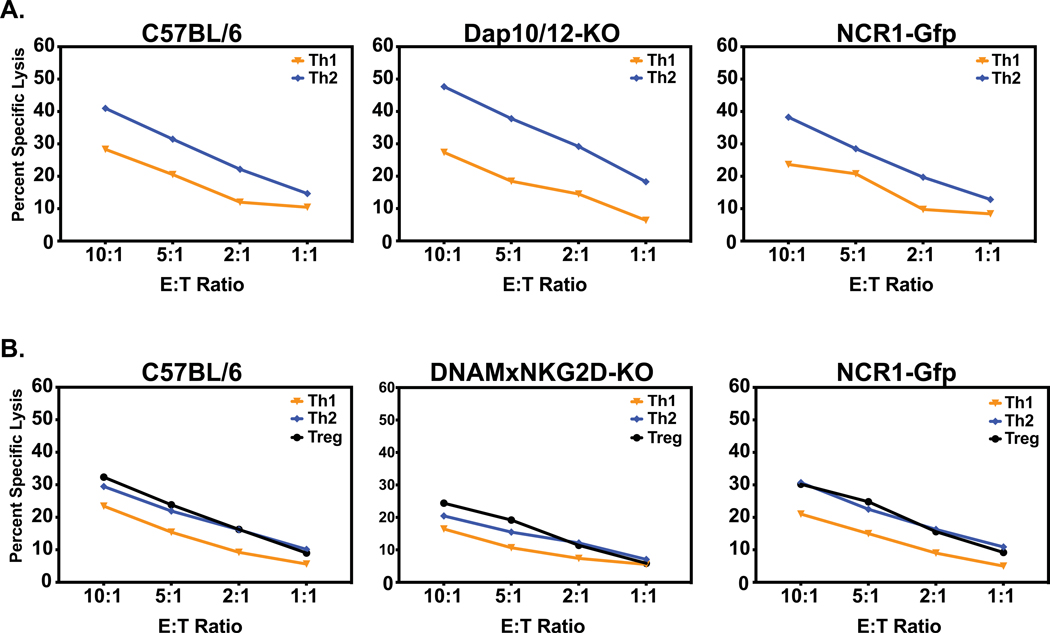
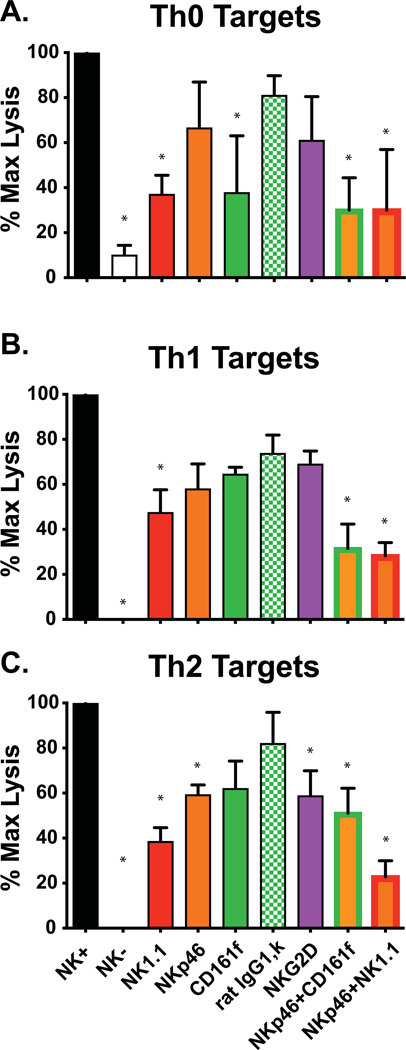
In addition to direct anti-viral activity, NK cells regulate viral pathogenesis by virtue of their cytolytic attack on activated CD4 and CD8 T cells. To gain insight into which differentiated T cell subsets are preferred NK targets, transgenic T cells were differentiated in vitro into Th0, Th1, Th2, Th17, Treg, Tc1, and Tc2 effector cells and then tested for lysis by enriched populations of lymphocytic choriomeningitis virus (LCMV)-induced activated NK cells. There was a distinct hierarchy of cytotoxicity in vitro and in vivo, with Treg, Th17, and Th2 cells being more sensitive and Th0 and Th1 cells more resistant. Some distinctions between in vitro vs in vivo generated T cells were explainable by type 1 interferon induction of class 1 histocompatibility antigens on the effector T cell subsets. NK receptor (NKR)-deficient mice and anti-NKR antibody studies identified no one essential NKR for killing, though there could be redundancies.
Keywords: CD4; CD8; Cytotoxicity; Interferon; Lymphocyte; Lymphocytic choriomeningitis virus; Mouse; Natural killer; Pathogenesis; T cell.
Copyright © 2019 Elsevier Inc. All rights reserved.
Figures
Similar articles
-
Rapid conversion of effector mechanisms from NK to T cells during virus-induced lysis of allogeneic implants in vivo.J Immunol. 2005 Jun 1;174(11):6663-71. doi: 10.4049/jimmunol.174.11.6663. J Immunol. 2005. PMID: 15905505
-
Inability of interferon to protect virus-infected cells against lysis by natural killer (NK) cells correlates with NK cell-mediated antiviral effects in vivo.J Immunol. 1985 Nov;135(5):3537-41. J Immunol. 1985. PMID: 2413125
-
Type I interferons protect T cells against NK cell attack mediated by the activating receptor NCR1.Immunity. 2014 Jun 19;40(6):961-73. doi: 10.1016/j.immuni.2014.05.003. Epub 2014 Jun 5. Immunity. 2014. PMID: 24909889
-
NK cells negatively regulate CD8 T cells via natural cytotoxicity receptor (NCR) 1 during LCMV infection.PLoS Pathog. 2019 Apr 17;15(4):e1007725. doi: 10.1371/journal.ppat.1007725. eCollection 2019 Apr. PLoS Pathog. 2019. PMID: 30995287 Free PMC article.
-
NK cells controlling virus-specific T cells: Rheostats for acute vs. persistent infections.Virology. 2013 Jan 5;435(1):37-45. doi: 10.1016/j.virol.2012.10.005. Virology. 2013. PMID: 23217614 Free PMC article. Review.
Cited by
-
Natural Killer Cells in Immunotherapy: Are We Nearly There?Cancers (Basel). 2020 Oct 27;12(11):3139. doi: 10.3390/cancers12113139. Cancers (Basel). 2020. PMID: 33120910 Free PMC article. Review.
-
Lymphocytic Choriomeningitis-Emerging Trends of a Neglected Virus: A Narrative Review.Trop Med Infect Dis. 2021 May 25;6(2):88. doi: 10.3390/tropicalmed6020088. Trop Med Infect Dis. 2021. PMID: 34070581 Free PMC article. Review.
-
Persistent CD19+ B cell lymphopenia in critically ill COVID-19 patients 50 days after symptom onset.Front Cell Infect Microbiol. 2024 Nov 22;14:1488607. doi: 10.3389/fcimb.2024.1488607. eCollection 2024. Front Cell Infect Microbiol. 2024. PMID: 39650838 Free PMC article.
-
STAT1 Controls the Functionality of Influenza-Primed CD4 T Cells but Therapeutic STAT4 Engagement Maximizes Their Antiviral Impact.J Immunol. 2023 May 1;210(9):1292-1304. doi: 10.4049/jimmunol.2200407. J Immunol. 2023. PMID: 36961447 Free PMC article.
References
-
- Bettelli E, Carrier Y, Gao W, Korn T, Strom TB, Oukka M, Weiner HL, Kuchroo VK, 2006. Reciprocal developmental pathways for the generation of pathogenic effector TH17 and regulatory T cells. Nature 441, 235–238. - PubMed
-
- Cerboni C, Zingoni A, Cippitelli M, Piccoli M, Frati L, Santoni A, 2007. Antigen-activated human T lymphocytes express cell-surface NKG2D ligands via an ATM/ATR-dependent mechanism and become susceptible to autologous NK- cell lysis. Blood 110, 606–615. - PubMed
-
- Cohen GB, Gandhi RT, Davis DM, Mandelboim O, Chen BK, Strominger JL, Baltimore D, 1999. The selective downregulation of class I major histocompatibility complex proteins by HIV-1 protects HIV-infected cells from NK cells. Immunity 10, 661–671. - PubMed
Publication types
MeSH terms
Substances
Grants and funding
LinkOut - more resources
Full Text Sources
Research Materials
