

Patient preferences for visualization of longitudinal patient-reported outcomes data
- PMID: 31670816
- PMCID: PMC7025335
- DOI: 10.1093/jamia/ocz189
Patient preferences for visualization of longitudinal patient-reported outcomes data
Abstract
Objective: The study sought to design symptom reports of longitudinal patient-reported outcomes data that are understandable and meaningful to end users.
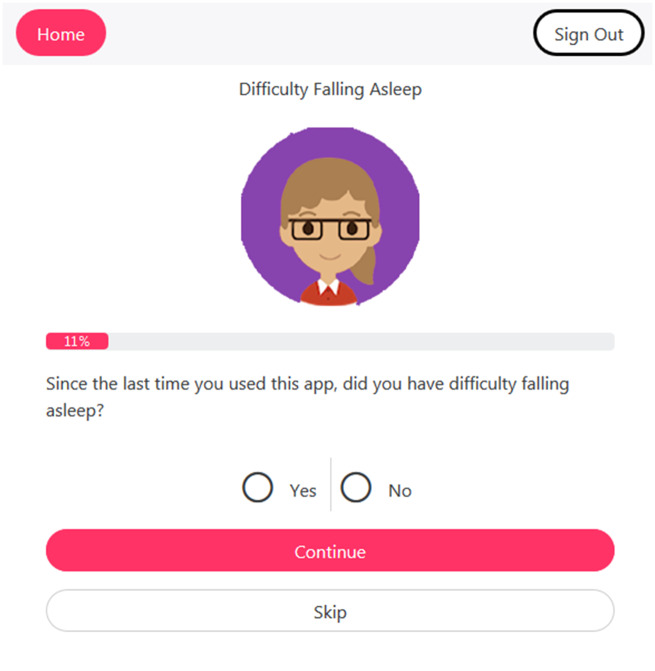
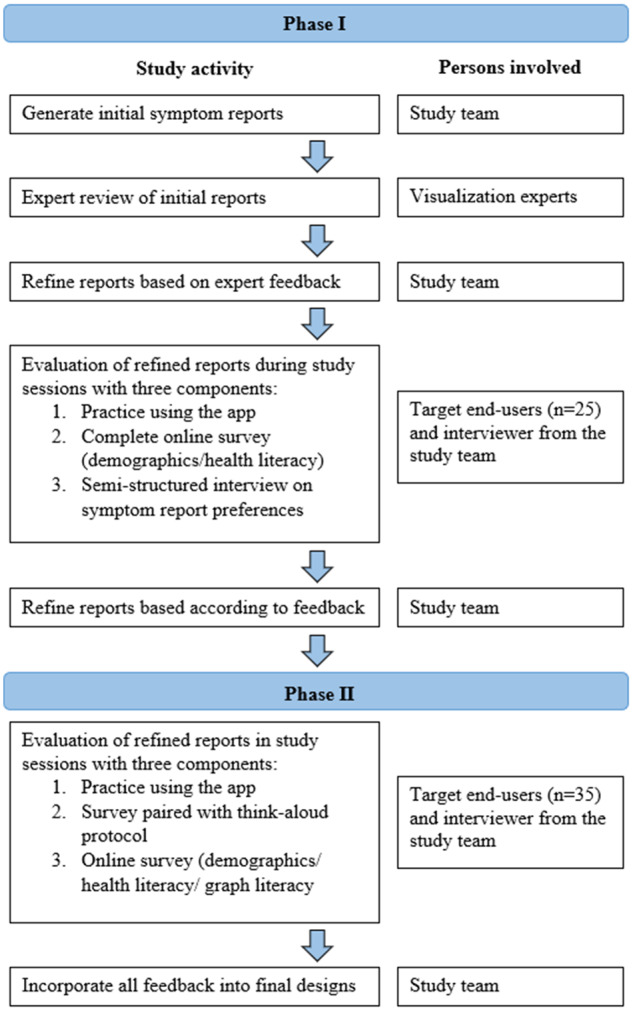
Materials and methods: We completed a 2-phase iterative design and evaluation process. In phase I, we developed symptom reports and refined them according to expert input. End users then completed a survey containing demographics, a measure of health literacy, and items to assess visualization preferences and comprehension of reports. We then collected participants' perspectives on reports through semistructured interviews and modified them accordingly. In phase II, refined reports were evaluated in a survey that included demographics, validated measures of health and graph literacy, and items to assess preferences and comprehension of reports. Surveys were administered using a think-aloud protocol.
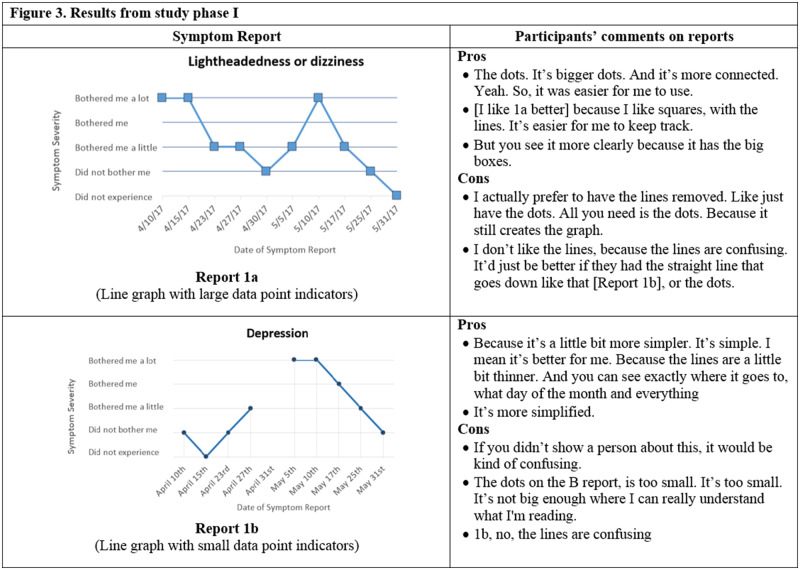
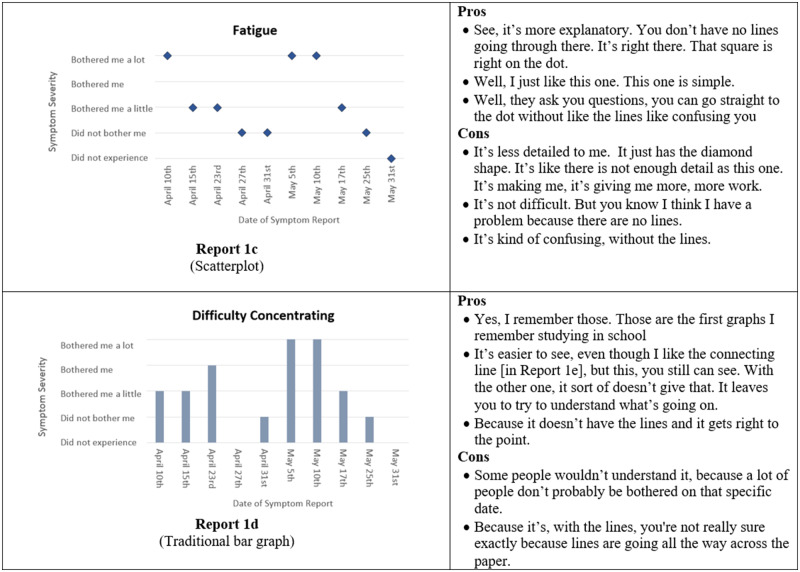
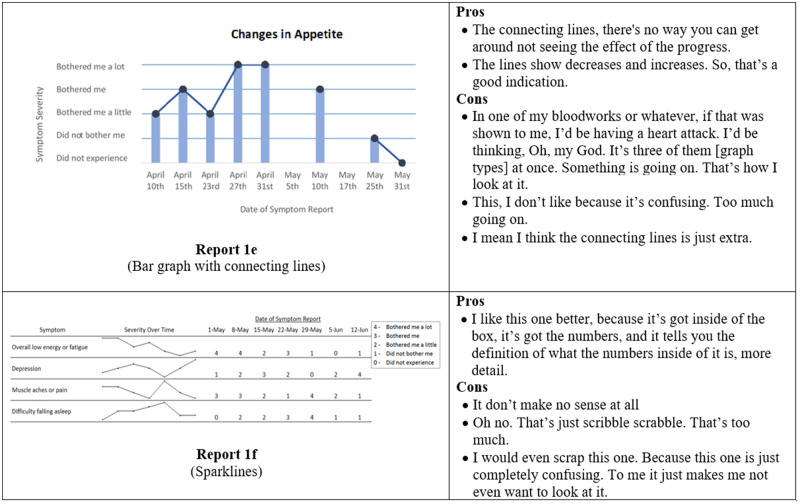
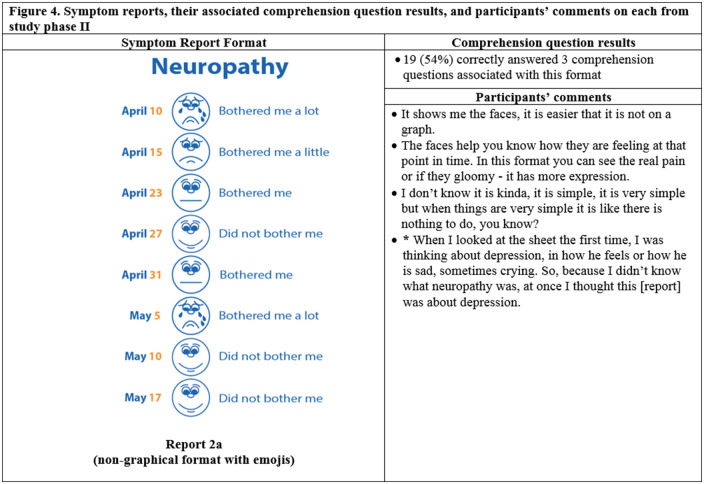
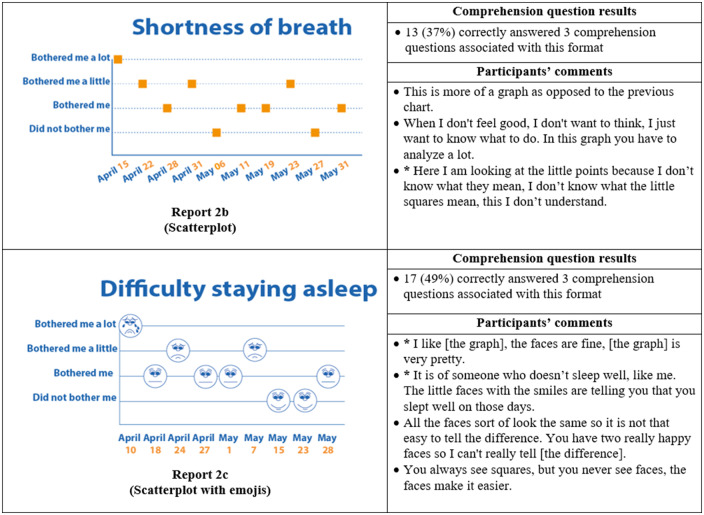
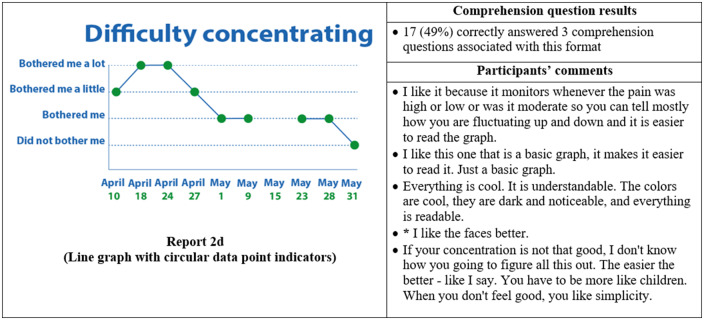
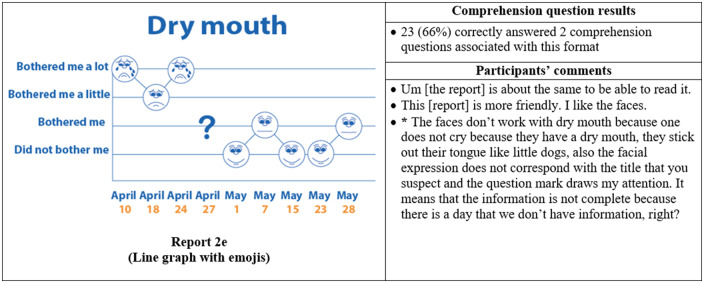
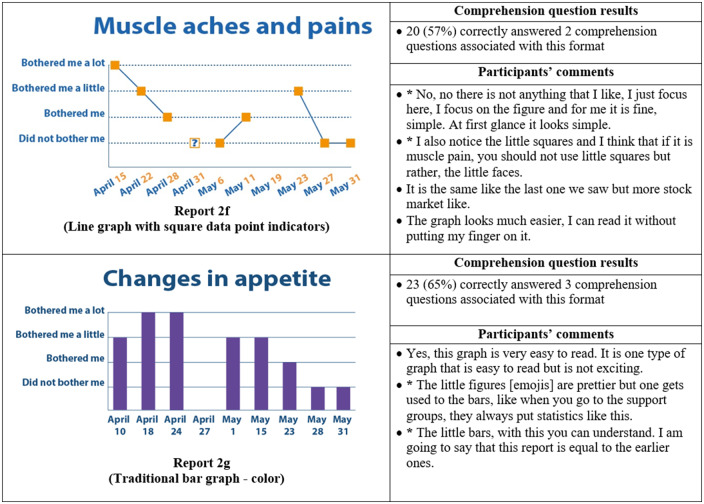
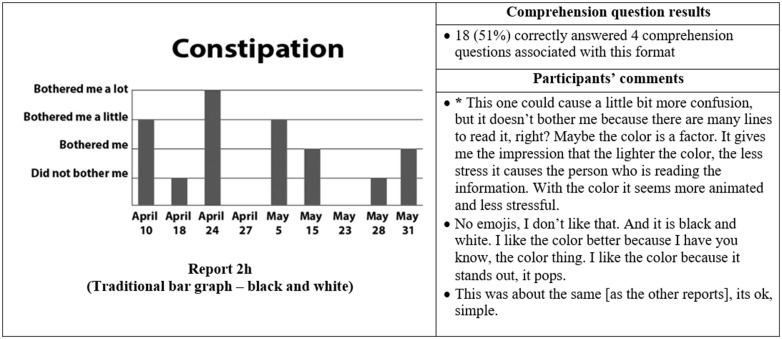
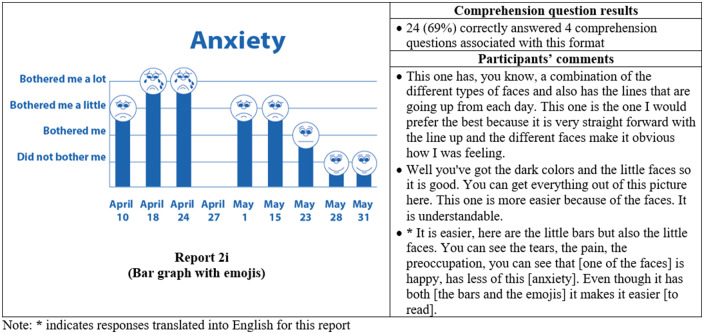
Results: Fifty-five English- and Spanish-speaking end users, 89.1% of whom had limited health literacy, participated. In phase I, experts recommended improvements and 20 end users evaluated reports. From the feedback received, we added emojis, changed date and font formats, and simplified the y-axis scale of reports. In phase II, 35 end users evaluated refined designs, of whom 94.3% preferred reports with emojis, the favorite being a bar graph combined with emojis, which also promoted comprehension. In both phases, participants literally interpreted reports and provided suggestions for future visualizations.
Conclusions: A bar graph combined with emojis was participants' preferred format and the one that promoted comprehension. Target end users must be included in visualization design to identify literal interpretations of images and ensure final products are meaningful.
Keywords: Information visualization; graph literacy; health literacy; mobile health; nursing informatics.
© The Author(s) 2019. Published by Oxford University Press on behalf of the American Medical Informatics Association. All rights reserved. For permissions, please email: journals.permissions@oup.com.
Figures
References
-
- National Institute of Nursing Research. Spotlight on Symptom Management Research. 2017. https://www.ninr.nih.gov/researchandfunding/symptommanagement. Accessed January 12, 2018.
-
- Bauer UE, Briss PA, Goodman RA, et al. Prevention of chronic disease in the 21st century: elimination of the leading preventable causes of premature death and disability in the USA. Lancet 2014; 384 (9937): 45–52. - PubMed
-
- Eller L, Bunch E, Wantland D, et al. Prevalence, correlates, and self-management of HIV-related depressive symptoms. AIDS Care 2010; 22 (9): 1159–70. - PubMed
Publication types
MeSH terms
Grants and funding
LinkOut - more resources
Full Text Sources
Medical
