. 2019 Oct 31;15(10):e1007343.
doi: 10.1371/journal.pcbi.1007343. eCollection 2019 Oct.

Systems-level network modeling of Small Cell Lung Cancer subtypes identifies master regulators and destabilizers

Affiliations

Systems-level network modeling of Small Cell Lung Cancer subtypes identifies master regulators and destabilizers

David J Wooten et al. PLoS Comput Biol. .

Abstract

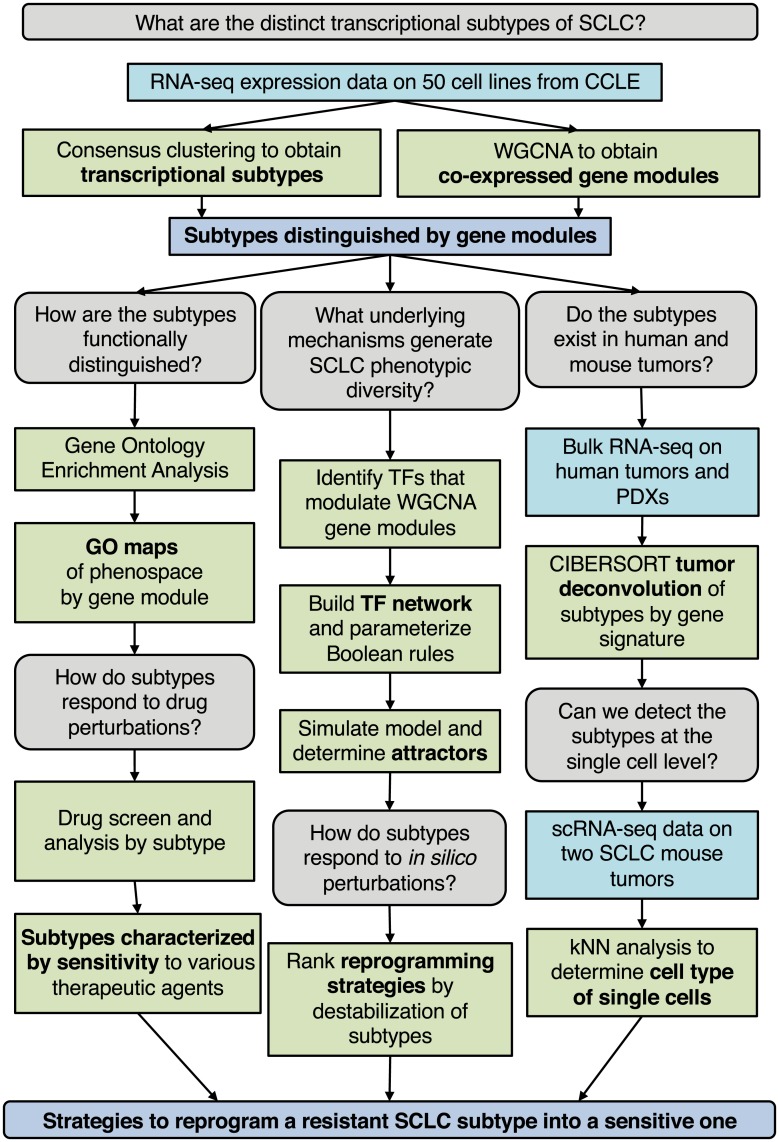
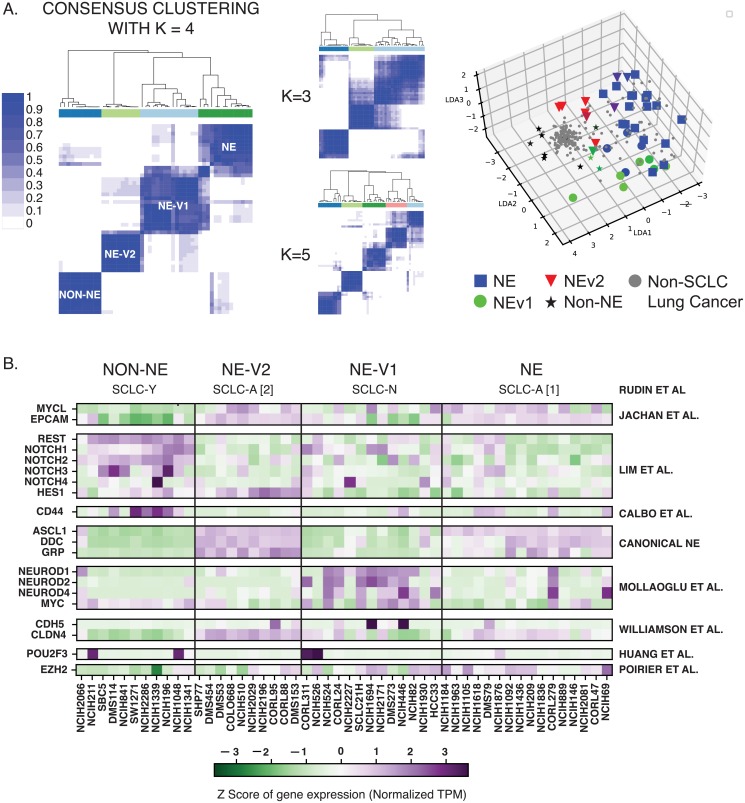
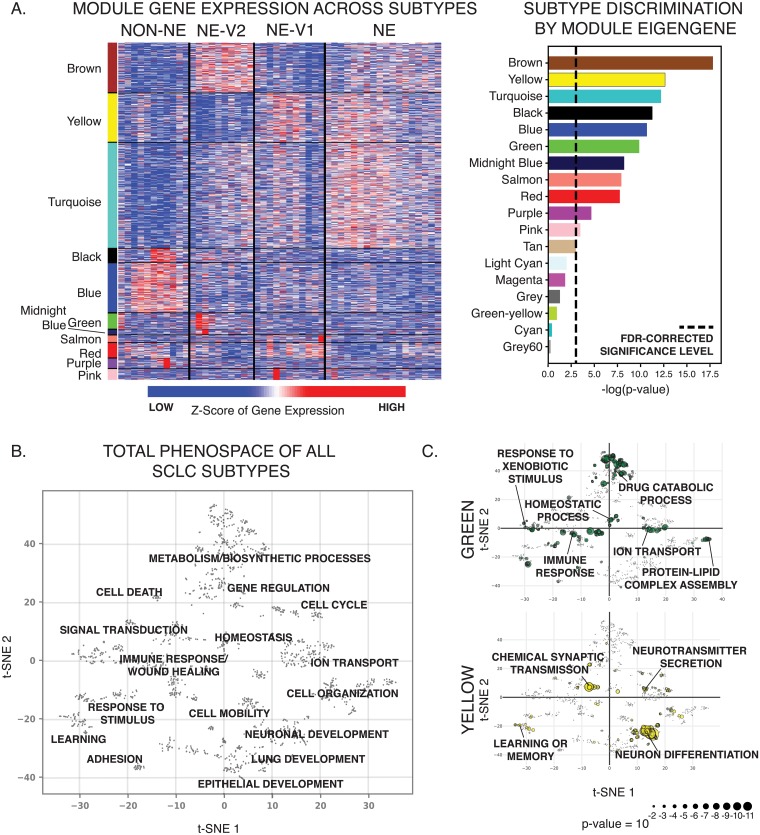
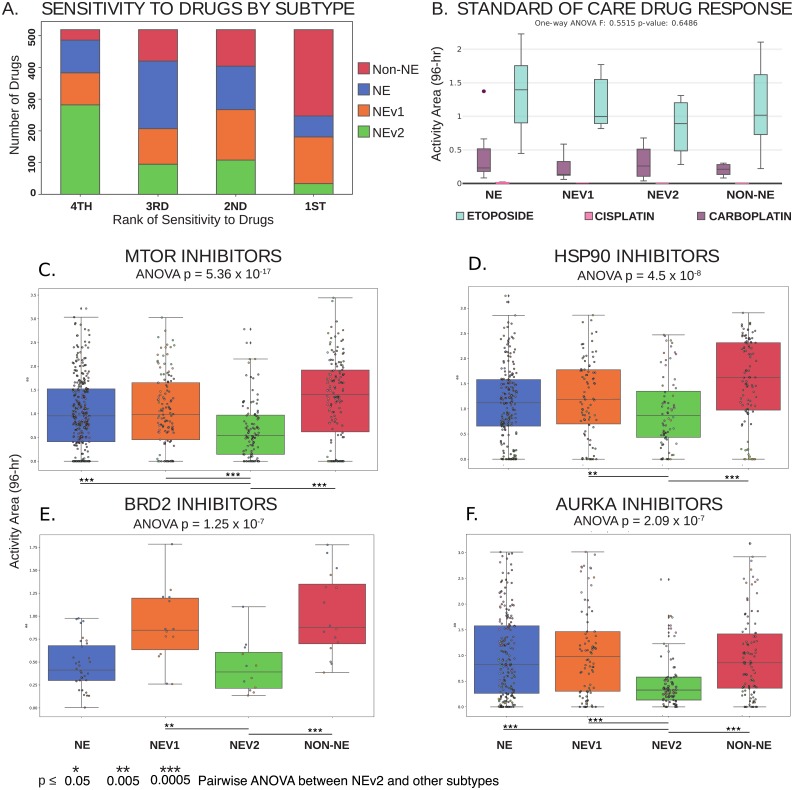
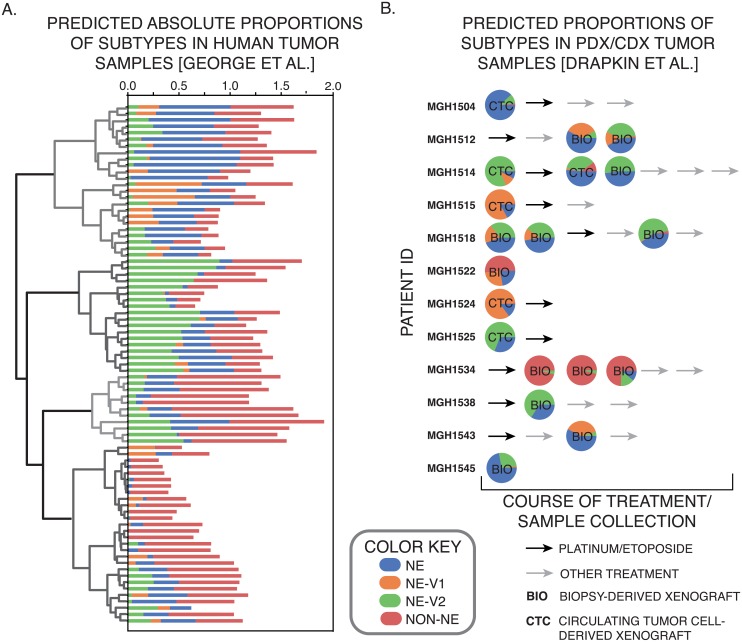
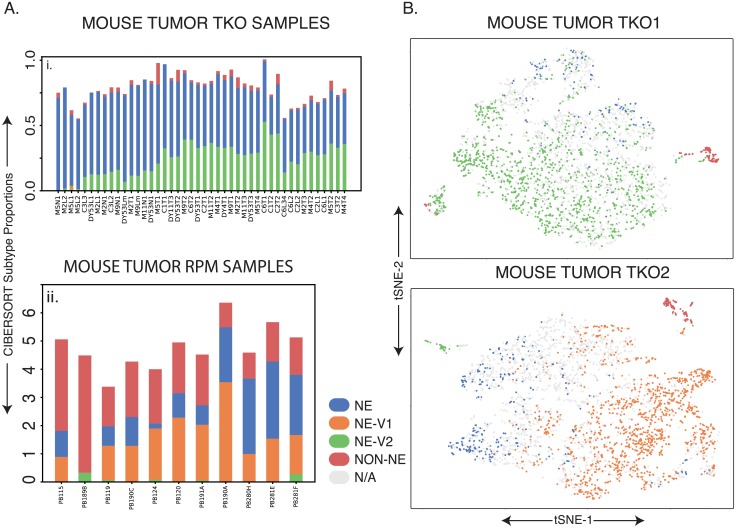
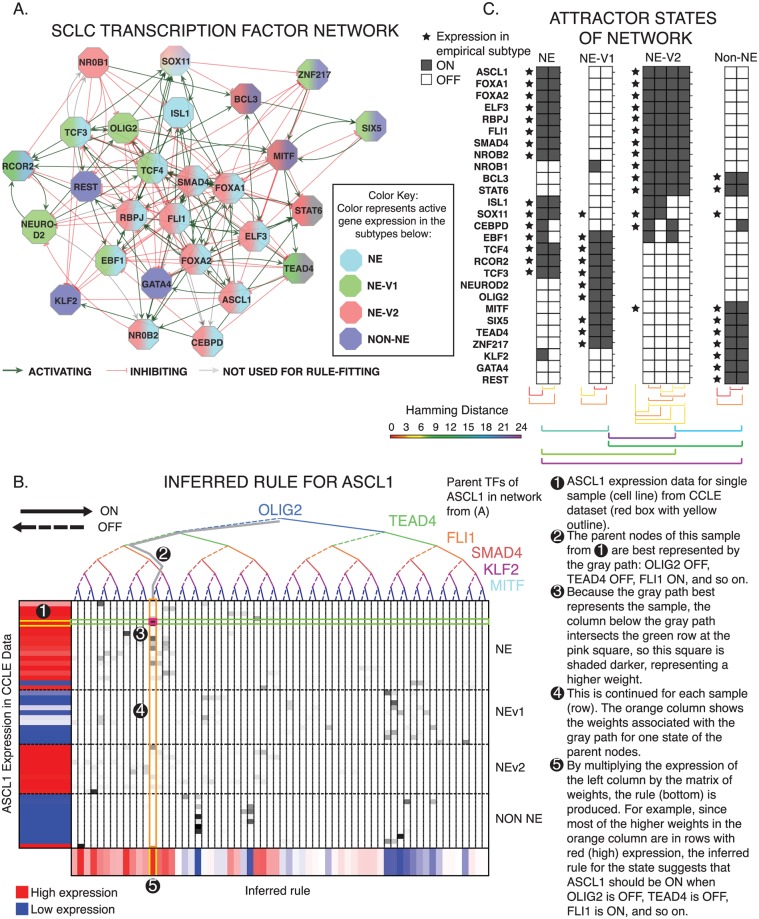
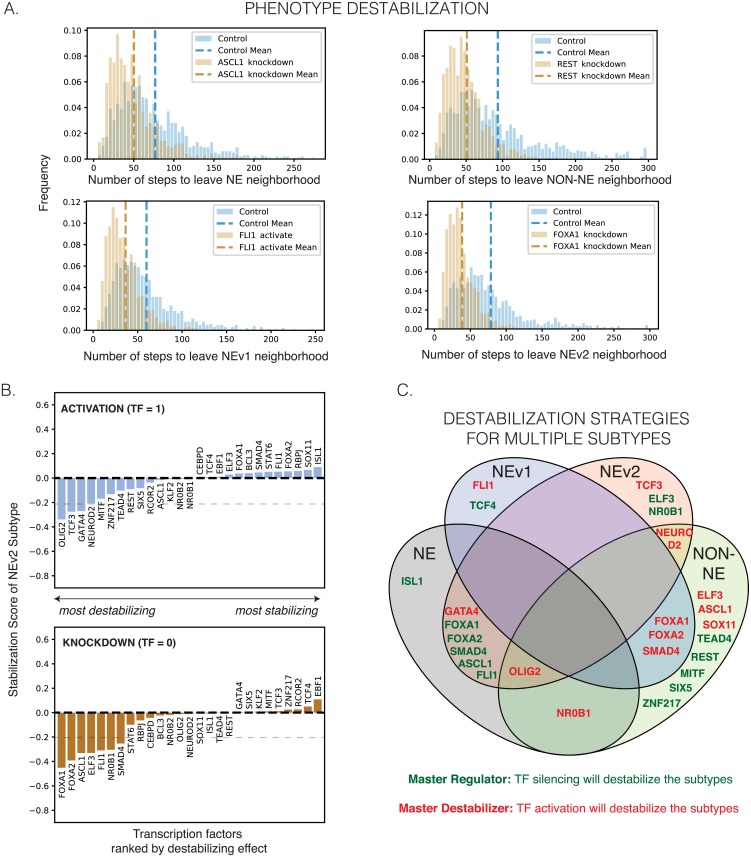
Adopting a systems approach, we devise a general workflow to define actionable subtypes in human cancers. Applied to small cell lung cancer (SCLC), the workflow identifies four subtypes based on global gene expression patterns and ontologies. Three correspond to known subtypes (SCLC-A, SCLC-N, and SCLC-Y), while the fourth is a previously undescribed ASCL1+ neuroendocrine variant (NEv2, or SCLC-A2). Tumor deconvolution with subtype gene signatures shows that all of the subtypes are detectable in varying proportions in human and mouse tumors. To understand how multiple stable subtypes can arise within a tumor, we infer a network of transcription factors and develop BooleaBayes, a minimally-constrained Boolean rule-fitting approach. In silico perturbations of the network identify master regulators and destabilizers of its attractors. Specific to NEv2, BooleaBayes predicts ELF3 and NR0B1 as master regulators of the subtype, and TCF3 as a master destabilizer. Since the four subtypes exhibit differential drug sensitivity, with NEv2 consistently least sensitive, these findings may lead to actionable therapeutic strategies that consider SCLC intratumoral heterogeneity. Our systems-level approach should generalize to other cancer types.


Conflict of interest statement

I have read the journal’s policy and the authors of this manuscript have the following competing interests: J.S. receives research funding from StemCentrx/Abbvie, Revolution Medicines, and from Pfizer, and owns stock in Forty Seven Inc.

Figures

Fig 1
Fig 1. Workflow of our analysis.
We use parallel analyses to identify strategies to reprogram resistant SCLC subpopulations into sensitive ones. These strategies can then be tested in vitro and in vivo.
Fig 2
Fig 2. Consensus clustering and WGCNA of 50 SCLC cell lines reveals four subtypes differentiated by gene modules.
A. Consensus clustering with k = 4 gives most consistent clusters. K = 3 and K = 5 add complexity without a corresponding increase in accuracy. LDA plot shows separation of 4 clusters, with non-SCLC cell lines falling near non-NE cell lines. B. Current biomarkers in the field of SCLC are able to distinguish between three of the subtypes; The fourth subtype, NEv2, is not separable from NE using markers from SCLC literature.
Fig 3
Fig 3. SCLC subtypes can be distinguished by gene expression patterns.
A. Transcriptional patterns that distinguish the four subtypes are captured in WGCNA analysis. Gene modules by color show patterns of expression that are consistent across the subtypes. Only modules that significantly distinguish between the subtypes are shown (ANOVA, FDR-corrected p-value < 0.05). B. SCLC heterogeneity biological process phenospace. A dissimilarity score between pairs of SCLC-enriched GO terms was calculated using GoSemSim, and used to create a t-SNE projection grouping similar biological processes together. Several distinct clusters of related processes can be seen. C. Module-specific phenospace. A breakdown of where some of the 11 statistically significant WGCNA modules fall in the GO space from A. Of particular interest, the green module, which is highly upregulated in the NEv2 phenotype, is enriched in metabolic ontologies, including drug catabolism and metabolism and xenobotic metabolism. The yellow module is enriched in canonical neuronal features.
Fig 4
Fig 4. Differential response of SCLC subtypes to a wide variety of oncology drugs and investigational agents.
A. Ranked sensitivity of subtypes across 526 compounds. NEv2 is least sensitive for over half of the drugs tested. B. No significant differences can be seen in response to etoposide and platinum-based agents cisplatin and carboplatin, the standard of care for SCLC. C-F. Significantly differential response by ANOVA, p < 0.05, shown in drugs that target C. mTOR, D. HSP90, E. BRD2, and F. AURKA. NEv2 is significantly more resistant to all of these drugs.
Fig 5
Fig 5. Computational evidence for existence of subtypes in human tumors.
A. Absolute proportion of each subtype in 81 human tumors as determined by CIBERSORT. The 81 tumors can then be sorted by hierarchical clustering, which finds four main groups of subtype patterns across tumors. B. Similar analysis in mouse PDX/CDX tumors from Drapkin et al. [18].
Fig 6
Fig 6. Similar analysis in mouse tumors.
A. Ai. TKO (Rb1, Tp53, P130 floxed) mouse tumors showing a high proportion of NE and NEv2 subtypes. Aii. As described in [15], these mouse tumors were generated by crossing Rb1 fl/fl Trp53 fl/fl (RP) animals to knockin Lox-Stop-Lox (LSL)-MycT58A-IRES-Luciferase mice. These Rb1 fl/fl Trp53 fl/fl Myc LSL/LSL (RPM) mice have overexpressed Myc and have been shown to be driven towards a variant phenotype, which is corroborated in this CIBERSORT analysis. It is clear that RPM mice contain greater portions of NEv1 compared to the tumors in Ai., which seems to correspond to the Aurora-Kinase-inhibitor-sensitive, Myc-high phenotype published by Mollaoglu et al. B. t-SNE plots of single cell RNA-seq from two TKO mouse tumors. The k-nearest neighbors (kNN) with k = 10 was computed for each mouse cell to predict subtypes of individual cell using signature genes of each subtype. If at least 8 of the 10 nearest human cell line neighbors for a mouse cell were of one subtype, the cell was assigned that subtype. Large amounts of intratumoral and intertumoral heterogeneity are evident.
Fig 7
Fig 7. TF network simulations reproduce subtypes as attractors.
A. Regulatory network of differentially expressed TFs from each of the 11 co-expressed gene modules in Fig 2B. Colors indicate which phenotype each TF is upregulated in. Red edges indicate inhibition (on average), and green activation (on average). B. Probabilistic Boolean rule fits for ASCL1. The target gene is a function of all the genes along the binary tree at the top, while expression of the target is shown on the left. Each row represents one cell line, each column represents one possible input state, and the bottom shows the inferred function F for every possible input state. Color ranges from 0 = blue (highly confident the TF is off), to 0.5 = white, to 1 = red (highly confident the TF is on). Rows are organized by subtype (top to bottom: NE, NEv1, NEv2, non-NE). C. Attractors found with asynchronous updates of Boolean network. 10 attractors were found, and each correlates highly with one of the four defined subtypes (represented by stars). Hamming distance between intra-subtype attractors and inter-subtype attractors are shown. The average distance between intra-subtype attractors was around 2.5, while the average distance between subtype attractors was around 16, signifying that the variation between subtypes is much greater that that within a single subtype. Specifics of the probabilistic simulation are described in Results.
Fig 8
Fig 8. Destabilization of subtypes by perturbation to network.
A. Random walks starting from the attractors in Fig 7C will eventually leave the start state due to uncertainty in the Boolean rules. Control histogram shows how many random steps are required to reach a state with a Hamming distance ≥ 4 under the network’s natural dynamics. The knockdowns and activations shown here hold expression of the perturbed gene OFF or ON in an attempt to destabilize the start state, such that the random walk leaves the neighborhood sooner. A shift to the left in the perturbed distribution signifies that the perturbation “pushed” the simulated cell out of the 4-TF neighborhood more quickly, and the perturbation thus “destabilized” the subtype represented by the start state. This indeed occurs for several perturbations, shown for NE, NEv1, NEv2, and non-NE starting states. Dotted line shows mean for each histogram, which is used to calculate the change in average number of steps under perturbation. B. Ranking of phenotype stabilization of NEv2 by TF activation and knockdown. The percent change of stability measures the percent change in the average number of steps needed to leave the neighborhood of the stable states. Negative stabilization scores indicates destabilizing perturbations, while positive indicates increasing stability. Results are shown for 1000 iterations starting from NEv2. Similar plots for the other subtypes can be found in S8 Fig. Dotted line at y = −0.2 signifies the cutoff for “destabilizing” perturbations shown in C. C. A Venn diagram demonstrating overlap of destabilization strategies. A single activation (green text) or knockdown (red text) can sometimes destabilize multiple phenotypes.

References

    1. Hauschild A, Grob JJ, Demidov LV, Jouary T, Gutzmer R, Millward M, et al. Dabrafenib in BRAF-mutated metastatic melanoma: a multicentre, open-label, phase 3 randomised controlled trial. The Lancet. 2012;380(9839):358–365. 10.1016/S0140-6736(12)60868-X - DOI - PubMed
    1. Robert M, Frenel JS, Gourmelon C, Patsouris A, Augereau P, Campone M. Olaparib for the treatment of breast cancer. Expert Opinion on Investigational Drugs. 2017;26(6):751–759. 10.1080/13543784.2017.1318847 - DOI - PubMed
    1. Travis WD, Brambilla E, Noguchi M, Nicholson AG, Geisinger KR, Yatabe Y, et al. International Association for the Study of Lung Cancer/American Thoracic Society/European Respiratory Society International Multidisciplinary Classification of Lung Adenocarcinoma. Journal of Thoracic Oncology. 2011;6(2):244–285. 10.1097/JTO.0b013e318206a221 - DOI - PMC - PubMed
    1. Newman AM, Liu CL, Green MR, Gentles AJ, Feng W, Xu Y, et al. Robust enumeration of cell subsets from tissue expression profiles. Nature methods. 2015;12(5):453–7. 10.1038/nmeth.3337 - DOI - PMC - PubMed
    1. George J, Lim JS, Jang SJ, Cun Y, Ozretić L, Kong G, et al. Comprehensive genomic profiles of small cell lung cancer. Nature. 2015;524(7563):47–53. 10.1038/nature14664 - DOI - PMC - PubMed

Publication types

Substances