. 2019 Oct 31;14(10):e0223994.
doi: 10.1371/journal.pone.0223994. eCollection 2019.

Visualizing a field of research: A methodology of systematic scientometric reviews

Affiliations

Visualizing a field of research: A methodology of systematic scientometric reviews

Chaomei Chen et al. PLoS One. .

Abstract

Systematic scientometric reviews, empowered by computational and visual analytic approaches, offer opportunities to improve the timeliness, accessibility, and reproducibility of studies of the literature of a field of research. On the other hand, effectively and adequately identifying the most representative body of scholarly publications as the basis of subsequent analyses remains a common bottleneck in the current practice. What can we do to reduce the risk of missing something potentially significant? How can we compare different search strategies in terms of the relevance and specificity of topical areas covered? In this study, we introduce a flexible and generic methodology based on a significant extension of the general conceptual framework of citation indexing for delineating the literature of a research field. The method, through cascading citation expansion, provides a practical connection between studies of science from local and global perspectives. We demonstrate an application of the methodology to the research of literature-based discovery (LBD) and compare five datasets constructed based on three use scenarios and corresponding retrieval strategies, namely a query-based lexical search (one dataset), forward expansions starting from a groundbreaking article of LBD (two datasets), and backward expansions starting from a recently published review article by a prominent expert in LBD (two datasets). We particularly discuss the relevance of areas captured by expansion processes with reference to the query-based scientometric visualization. The method used in this study for comparing bibliometric datasets is applicable to comparative studies of search strategies.


Conflict of interest statement

The authors have declared that no competing interests exist.

Figures

Fig 1
Fig 1. Applying incremental citation expansions increases the quality of input data for mapping a research field.
Fig 2
Fig 2. Using multiple search and expansion strategies improves the data quality for scientometric studies.
Fig 3
Fig 3. Logarithmically transformed distributions of articles by year in the five datasets.
Fig 4
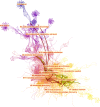
Fig 4. A synthesized document co-citation network of the F dataset along with cluster labels and overlays of main paths of direct citations (red lines) and core references (yellow lines).
CiteSpace configuration: LRF = 3, LBY = 10, e = 2.0, g-index (k = 30). Network: 1,269 references and 5,937 co-citation links.
Fig 5
Fig 5. A network visualization based on the dataset F and various overlays of substructures: a) a visualized network with clusters labeled, b) core references as an overlay, c) main paths overlay, d) an overlay of references cited by Smalheiser (2017), e) an overlay of references cited by Sebastian et al. (2017), and f) clusters are assigned distinct colors.
Fig 6
Fig 6. Timeline visualization with overlays of references cited by two recent reviews of LBD, namely Smalheiser [28] and Sebastian et al. [5].
Fig 7
Fig 7. A network visualization based on the combined dataset, featuring 3,095 references and 16,314 co-citation links.
Modularity: 0.84. Silhouette: 0.34.
Fig 8
Fig 8. Network overlays of individual datasets (in red) and core reference overlays (in green).
Fig 9
Fig 9. Cluster #6 is primarily contributed by dataset NB.
It is a very specific domain on RNA interference.
Fig 10
Fig 10. The network of NB reveals two weakly connected continents.
The upper area is responsible for the formation of Cluster #6, which is in turn due to two references cited in Smalheiser in his 2017 review.
Fig 11
Fig 11. Clusters #7 big data and #8 deep learning are captured by S5 but not by the query-based search (F).
Fig 12
Fig 12. Major Level-2 clusters of Level-1 cluster #8 deep learning.

References

    1. Price DD. Networks of scientific papers. Science. 1965;149:510–5. 10.1126/science.149.3683.510 - DOI - PubMed
    1. Yang H-T, Ju J-H, Wong Y-T, Shmulevich I, Chiang J-H. Literature-based discovery of new candidates for drug repurposing. Briefings in Bioinformatics. 2017;18(3):488–97. 10.1093/bib/bbw030 - DOI - PubMed
    1. Bruza P, Weeber M. Literature-Based Discovery: Springer; 2008.
    1. Choi B-K, Dayaram T, Parikh N, Wilkins AD, Nagarajan M, Novikov IB, et al. Literature-based automated discovery of tumor suppressor p53 phosphorylation and inhibition by NEK2. PNAS. 2018;115(42):10666–71. 10.1073/pnas.1806643115 - DOI - PMC - PubMed
    1. Sebastian Y, Siew E, Orimaye SO. Emerging approaches in literature-based discovery: techniques and performance review. The Knowledge Engineering Review. 2017;32(e12):1–35.

Publication types