. 2019 Oct 29;8(11):1342.
doi: 10.3390/cells8111342.

Feeding Entrainment of the Zebrafish Circadian Clock Is Regulated by the Glucocorticoid Receptor

Affiliations

Feeding Entrainment of the Zebrafish Circadian Clock Is Regulated by the Glucocorticoid Receptor

Elisa Morbiato et al. Cells. .

Abstract

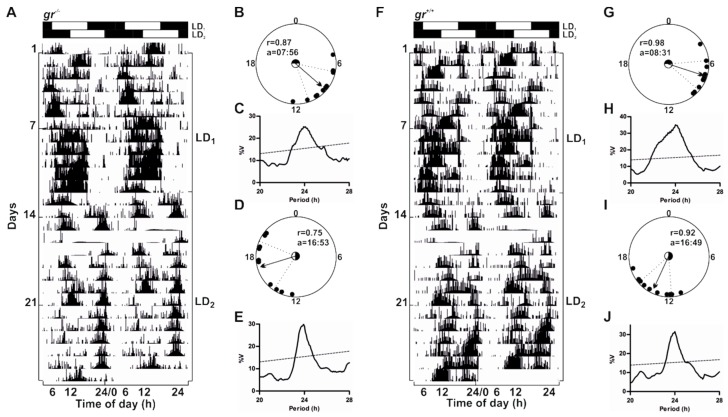
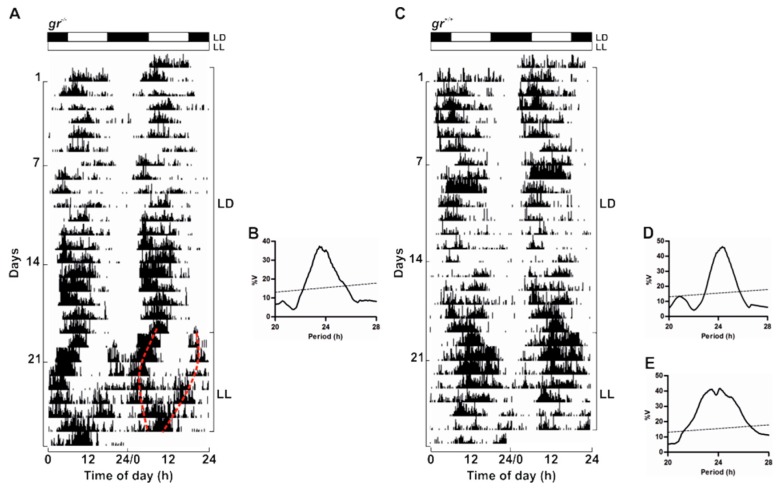
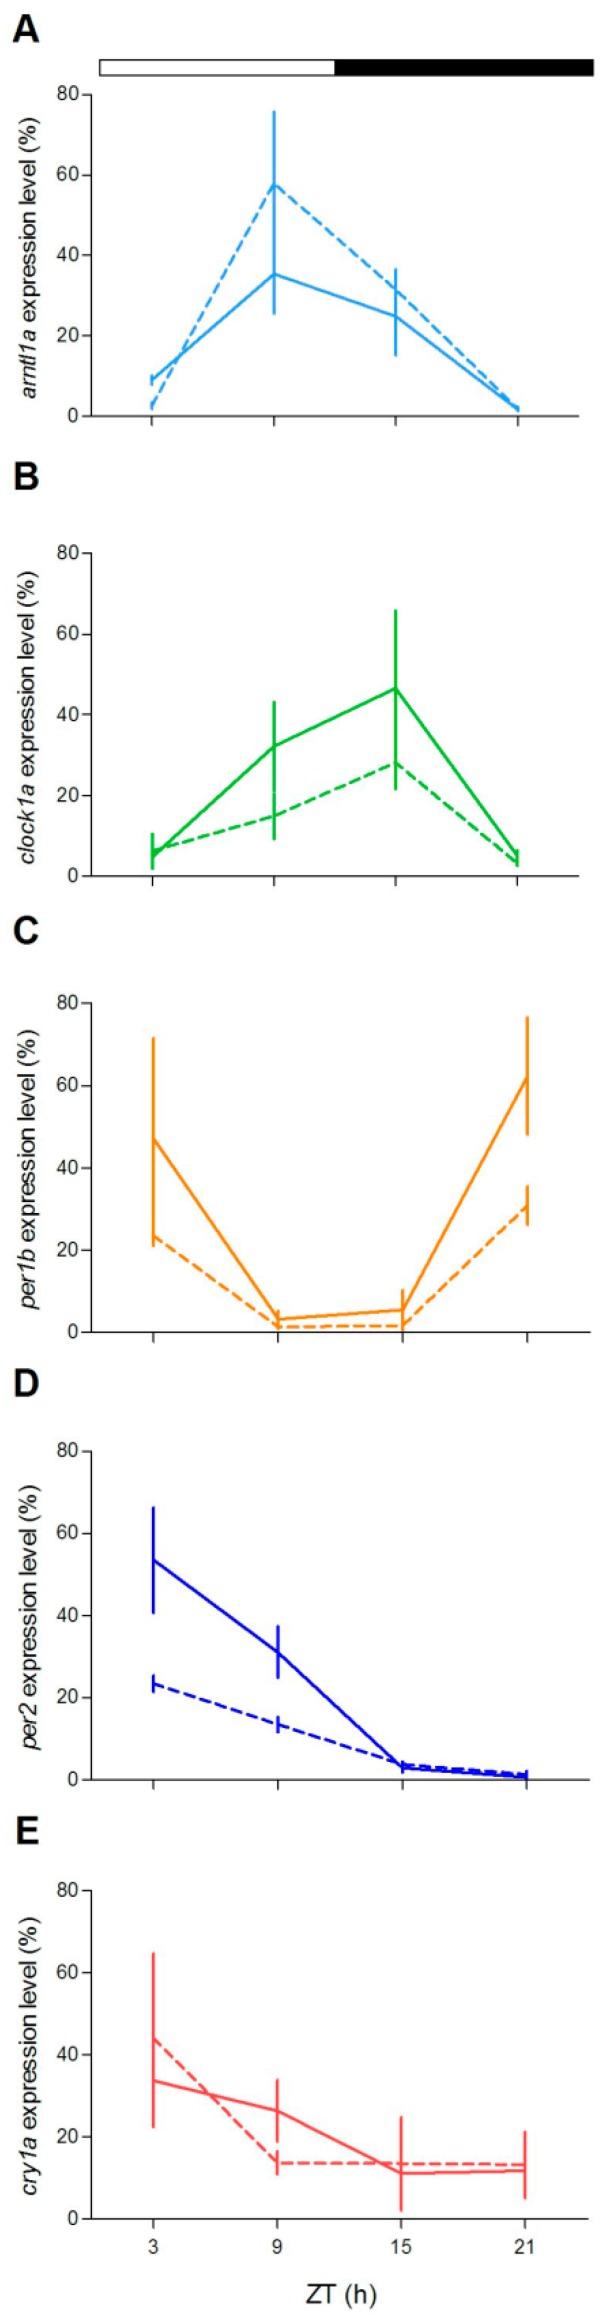
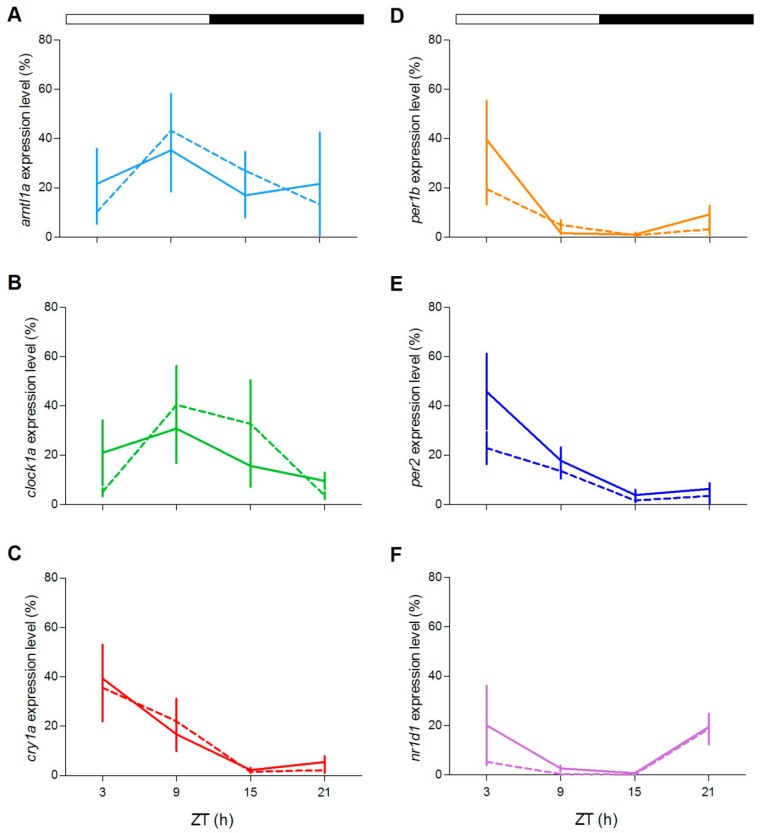
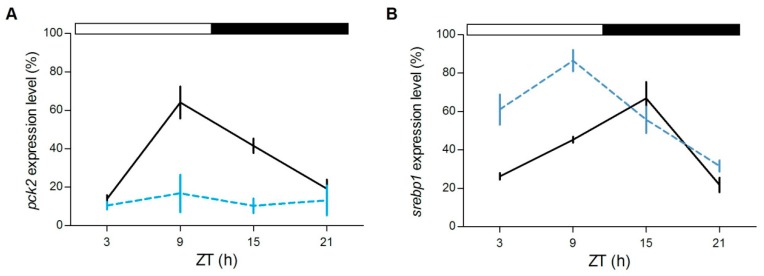
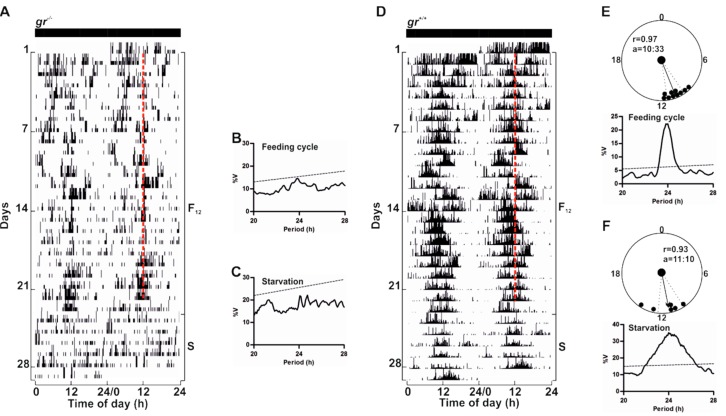
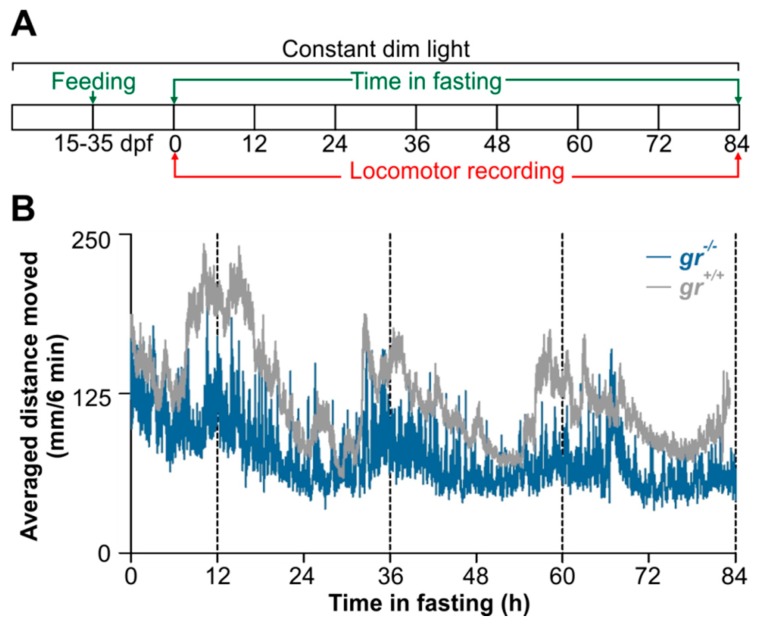
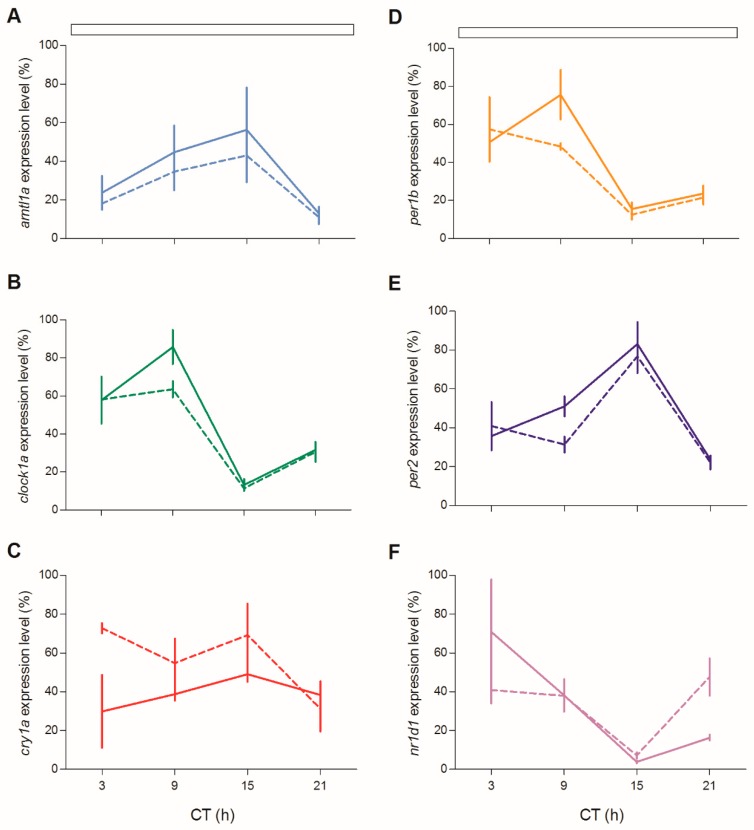
Glucocorticoids (GCs) are steroid hormones mainly acting as key regulators of body homeostasis and stress responses. Their activities are primarily based on the binding to the GC receptor (GR), a member of the nuclear receptor family, that regulates tissue-specific sets of genes. GCs secretion follows a circadian rhythmicity with a peak linked to the animal's activity phase. In mammals, GCs are also implicated in feeding entrainment mechanisms as internal zeitgeber. Here, we investigated, by means of behavioural and molecular approaches, the circadian clock and its regulation by light and food in wild-type (WT) and null glucocorticoid receptor (gr-/-) zebrafish larvae, juveniles and adults. In both WT and gr-/- larvae and adults, behavioural activity and clock gene expression were entrained to the light-dark (LD) cycle and rhythmic in constant conditions. Differences in the pattern of clock genes' expression indicated a modulatory role of GCs. A significant role of Gr was detected in the feeding entrainment which was absent or markedly dampened in mutants. Furthermore, the expression of two clock-regulated genes involved in glucidic and lipidic metabolism was altered, highlighting the participation of GCs in metabolic processes also in fish. Taken together, our results confirmed the role of GC-mediated Gr signaling in the feeding entrainment in a non-mammalian species, the zebrafish.

Keywords: Danio rerio; circadian clock; clock gene; entrainment; feeding; glucocorticoid receptors; metabolism; zebrafish.


Conflict of interest statement

The authors declare no conflict of interest. The funders had no role in the design of the study; in the collection, analyses, or interpretation of data; in the writing of the manuscript, or in the decision to publish the results.

Figures

Figure 1
Figure 1
Spatial and temporal variations of glucocorticoid activity. WMISH of egfp mRNA in 5-dpf ia20 larvae exposed to standard photoperiodic regime and analyzed from 3 h before to 5 h after light onset (from ZT21 to ZT5). All larvae are lateral views with head pointing to the left. Scale bar: 200 µM.
Figure 2
Figure 2
Daily activity rhythms of gr+/+ and gr−/− larvae zebrafish. (A) Mean waveform of locomotor activity under 12:12 LD cycles from 5 to 8 dpf (n=120/genotype). Vertical axis shows averaged distance moved (mm/6 min) while x axis indicates time in recording. White and grey bars show light and dark phase, respectively. Data are expressed as mean ± standard error of the mean (SEM). (BD) Representative actograms of 3 zebrafish (gr−/−: BC; gr+/+: D). Actograms are double plotted on a 48 h time scale to help the interpretation. The height of each point represents the distance travelled in 6 min. Bars at the top of each actogram indicate light (white) and dark (black) phases the LD cycles. The age of zebrafish is indicated on the left and the zeitgeber time (ZT) is plotted on the bottom of each actogram. (E) Mean activity (n = 120/genotype) in the light and dark phases from 5 to 8 dpf. Data are expressed as mean ± SEM.
Figure 3
Figure 3
Circadian activity rhythms of gr+/+ and gr−/− larvae zebrafish. (A) Larvae were reared under light–dark (LD) cycle from 0 to 6 dpf and then maintained for 3 days in constant dim light (LL). Locomotor activity were recording from 24 to 60 h in LL. (B) Mean waveform of locomotor activity under LL for 36 h (n = 144/genotype).
Figure 4
Figure 4
Daily expression levels of clock genes in zebrafish larvae. Quantitative polymerase chain reaction (qPCR) analysis of clock and light-regulated clock gene expression at 5–6 dpf (A,C,E,G,I) and 12 dpf (B,D,F,H,J) in zebrafish larvae exposed to LD cycles. For all panels, each point represents the mean ± SEM (n = 4). On the y-axes are plotted relative expression levels (100% is the maximum level detected for each gene in all dpf), while on the x-axes time is expressed as zeitgeber time (ZT, where ZT0 represents lights on). White and black bars represent light and dark periods, respectively. gr+/+ = solid line; gr−/− = dotted line.
Figure 5
Figure 5
Daily activity rhythms of gr+/+ and gr−/− adult zebrafish. Representative actograms (A,F), circular diagrams (B,D,G,I) and χ2 periodogram analysis (C,E,H,J) of adult zebrafish gr+/+ and gr−/− subjected to 12:12 LD cycles. In actograms the height of each point represents the number of infrared light-beam interruptions in 10 min. Starting and ending day of each LD cycle (LD1 and LD2) is shown on the right of the actogram. The number of days is indicated on the left and the time of day is plotted on the bottom of each actogram. For more details, see Figure 2. Circular diagrams showing acrophases for the last 10 days of each LD period are plotted (B,D,G,I). Each black dot shows the daily acrophase, while arrows indicate the average acrophase represented as a vector. In each circle the mean vector length (r) and mean acrophase (a) are shown (B and D for gr−/−; G and I for gr+/+, for LD1 and LD2, respectively). The circle inside each circular diagram represents critical values of the Rayleigh test (p < 0.05) and the black part of the circle shows the duration of dark phase. The dotted lines represent the confidence intervals. Activity records in the last 10 days of each LD cycle were also subjected to χ2 periodogram analysis (C and E for gr−/−, H and J for gr+/+). Confidence limits were chosen at the 99% level.
Figure 6
Figure 6
Circadian activity rhythms of gr+/+ and gr−/− adult zebrafish. Representative actograms (A,C) of adult zebrafish gr+/+ and gr−/− subjected to 12:12 LD cycles and then to LL. Activity records in the last 10 days of LD cycles (B and D) and of LL (E) were subjected to χ2 periodogram analysis. Dotted lines marked the splitting of the rhythm into two independent components with periodicity in the circadian range. For more details, see Figure 2 and Figure 5.
Figure 7
Figure 7
Daily expression levels of clock genes in zebrafish adult eye. qPCR analysis of clock (AC) and light-regulated clock (DE) gene expression in the eye of zebrafish exposed to LD cycles. For all panels, each point represents the mean ± SEM (n = 4). gr+/+= solid line; gr−/− = dotted line. For more details see Figure 4.
Figure 8
Figure 8
Daily expression levels of clock genes in zebrafish adult liver. qPCR analysis of clock (A,B,D,F) and light-regulated clock (C,E) gene expression in the liver of zebrafish exposed to LD cycles. For all panels, each point represents the mean ± SEM (n = 4). gr+/+= solid line; gr−/− = dotted line. For more details see Figure 4.
Figure 9
Figure 9
Daily expression levels of genes involved in metabolism in zebrafish adult liver. qPCR analysis of pck2 (A) and srebp1 (B) in the liver of zebrafish exposed to LD cycles. For both panels, each point represents the mean ± SEM (n = 4). gr+/+= solid line; gr−/− = dotted line. For more details see Figure 4.
Figure 10
Figure 10
Behavioural entrainment by periodic food availability of gr+/+ and gr−/− adult zebrafish. Representative actograms (A,D), χ2 periodogram analysis and circular diagrams (BC,EF) of adult zebrafish gr+/+ and gr−/− maintained under constant darkness and fed once a day at a fixed time (12:00). Starting and ending day of each feeding cycle (F12) and starvation (S) is shown on the right of the actogram. The number of days is indicated on the left and the time of day is plotted on the bottom of each actogram. Red dotted lines indicate the time of feeding. Circular diagrams showing acrophases for F12 and S period are plotted (EF). Activity records of each F12 or S cycle were subjected to χ2 periodogram analysis (BC,EF). For more details see Figure 5.
Figure 11
Figure 11
Behavioural entrainment by periodic food availability of gr+/+ and gr−/− zebrafish juvenile. (A) Larvae were reared under LL from 15 to 35 dpf and fed once a day at a midday time for 20 days. After then larvae were starved for 84 h and the locomotor activity were recorded. (B) Mean waveform of locomotor activity under LL and starvation for 84 h (n = 45/genotype). Vertical dotted lines denote when the feeding would normally have occurred according to the previous regular feeding regime.
Figure 12
Figure 12
Circadian expression levels of clock genes in zebrafish juvenile. qPCR analysis of clock (A,B,D,F) and light-regulated clock (C,E) gene expression in zebrafish juvenile at the third day of starvation after feeding entrainment. White bars represent LL. For more details see Figure 4.

References

    1. Pittendrigh C.S. Temporal organization: Reflections of a Darwinian clock-watcher. Annu. Rev. Physiol. 1993;55:16–54. doi: 10.1146/annurev.ph.55.030193.000313. - DOI - PubMed
    1. Roenneberg T., Daan S., Merrow M. The art of entrainment. J. Biol. Rhythms. 2003;18:183–194. doi: 10.1177/0748730403018003001. - DOI - PubMed
    1. Mistlberger R.E. Food-anticipatory circadian rhythms: Concepts and methods. Eur. J. Neurosci. 2009;30:1718–1729. doi: 10.1111/j.1460-9568.2009.06965.x. - DOI - PubMed
    1. Rensing L., Ruoff P. Temperature effect on entrainment, phase shifting, and amplitude of circadian clocks and its molecular bases. Chronobiol. Int. 2002;19:807–864. doi: 10.1081/CBI-120014569. - DOI - PubMed
    1. Foa A., Bertolucci C. Temperature cycles induce a bimodal activity pattern in ruin lizards: Masking or clock-controlled event? A seasonal problem. J. Biol. Rhythms. 2001;16:574–584. doi: 10.1177/074873001129002268. - DOI - PubMed

Publication types

MeSH terms

Substances

LinkOut - more resources