. 2019 Oct;146(4):2709.
doi: 10.1121/1.5129555.

Individual listener differences in azimuthal front-back reversals

Affiliations

Individual listener differences in azimuthal front-back reversals

William A Yost et al. J Acoust Soc Am. 2019 Oct.

Abstract

Thirty-two listeners participated in experiments involving five filtered noises when listeners kept their eyes open or closed, for stimuli of short or long duration, and for stimuli that were presented at random locations or in a largely rotational procession. Individual differences in the proportion of front-back reversals (FBRs) were measured. There were strong positive correlations between the proportion of FBRs for any one filtered noise, but not when FBRs were compared across different filtered-noise conditions. The results suggest that, for each individual listener, the rate of FBRs is stable for any one filtered noise, but not across filtered noises.


Figures

FIG. 1.
FIG. 1.
The six loudspeaker locations on the 24-loudspeaker azimuth array used in the experiment.
FIG. 2.
FIG. 2.
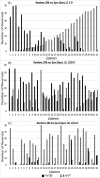
The number of F → “B” (black bars) and B → “F” (white bars) reversals (out of a maximum of 60) for each of the 32 listeners for condition 1 (i.e., Random, 200-ms, Eyes-Open) for the three filtered noises [(A): LF, 2-O; (B): LF, 1/10-O; and (C): HF, 1/10-O] producing the most FBRs. The data in (A) are arranged in left–right order by the number of B → “F” reversals.
FIG. 3.
FIG. 3.
The number of F → “B” and B → “F” reversals (out of a maximum of 60) for each of the 32 listeners for condition 2 (i.e., Random, 200-ms, Eyes-Closed) for the LF,2-O filtered noise [compared to Fig. 2(A)]. X axis is the same as in Fig. 2.
FIG. 4.
FIG. 4.
Scatter diagram (32 listeners) comparing condition 1 [Fig. 2(A)] and condition 2 (Fig. 3) data for the LF,2-O filtered noise (F → “B”: closed circles; B → “F”: open squares). Straight lines indicate linear regression.

Similar articles

Cited by

References

    1. Aaronson, N. L. , and Hartmann, W. M. (2014). “ Testing, correcting, and extending the Woodworth model for interaural time difference,” J. Acoust. Soc. Am. 135, 817–823.10.1121/1.4861243 - DOI - PMC - PubMed
    1. Blauert, J. (1997). Spatial Hearing ( MIT Press, Cambridge, MA: ), 494 pp.
    1. Blauert, J. (1969). “ Sound localization in the median plane,” Acta Acust. Acust. 22, 205–213.
    1. Hebrank, J. , and Wright, D. (1975). “ The effect of stimulus intensity upon the localization of sound sources in the median plane,” J. Sound Vib. 38, 498–500.10.1016/S0022-460X(75)80137-4 - DOI
    1. Macaulay, E. J. , and Hartmann, W. M. (2010). “ The acoustic bright spot and mislocalization of tones by human listeners,” J. Acoust. Soc. Am. 127, 1440–1450.10.1121/1.3294654 - DOI - PMC - PubMed

Publication types