. 2019 Dec 4;104(5):899-915.e8.
doi: 10.1016/j.neuron.2019.09.005. Epub 2019 Oct 28.

Chronic Stress Induces Activity, Synaptic, and Transcriptional Remodeling of the Lateral Habenula Associated with Deficits in Motivated Behaviors

Affiliations

Chronic Stress Induces Activity, Synaptic, and Transcriptional Remodeling of the Lateral Habenula Associated with Deficits in Motivated Behaviors

Ignas Cerniauskas et al. Neuron. .

Abstract

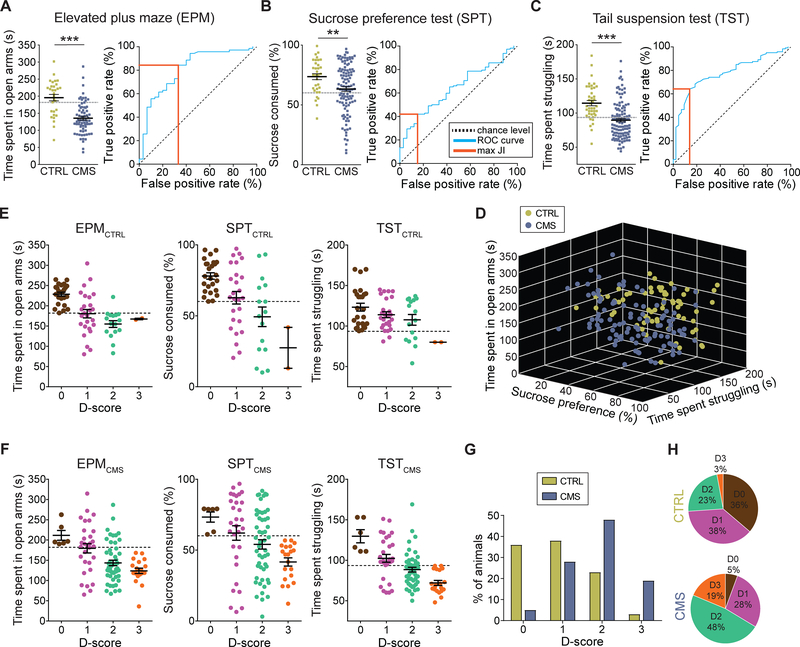
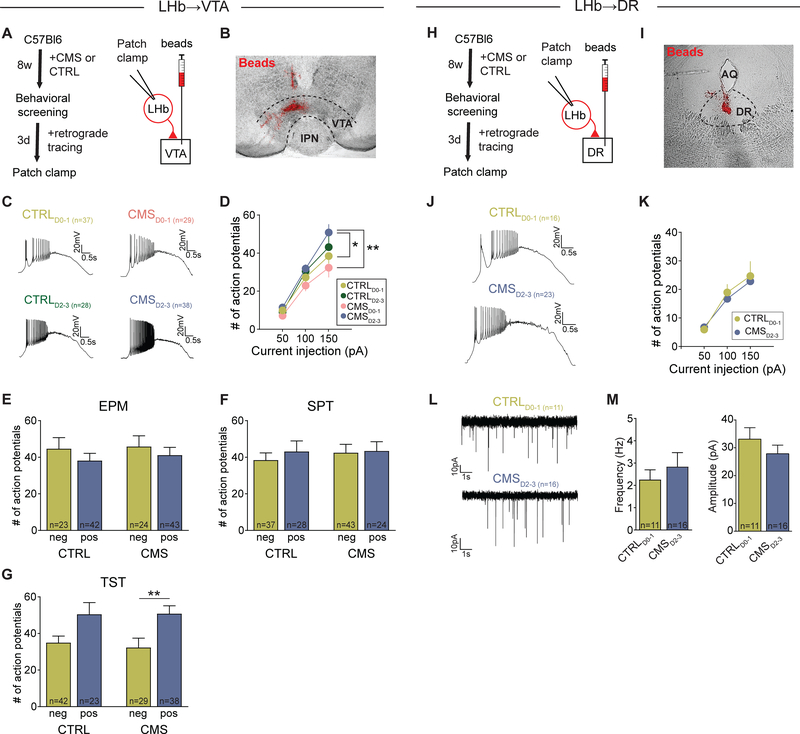
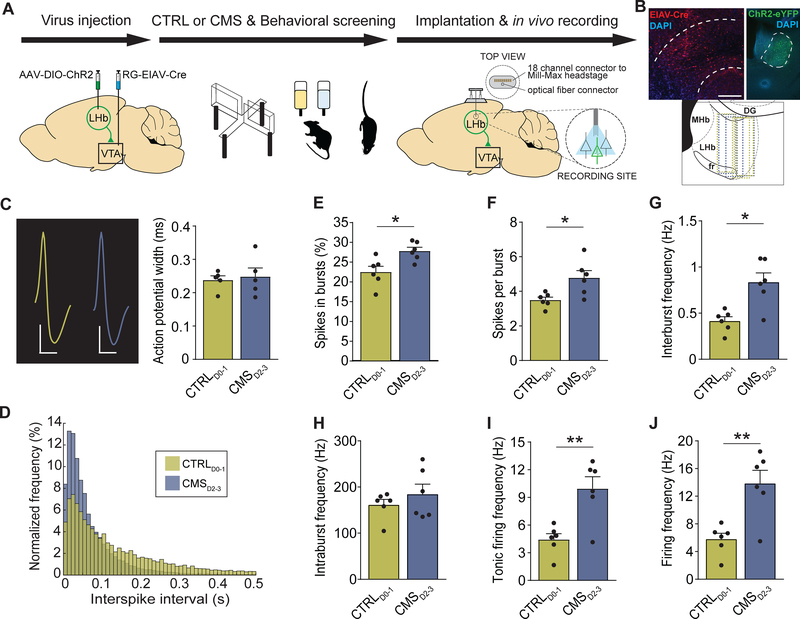
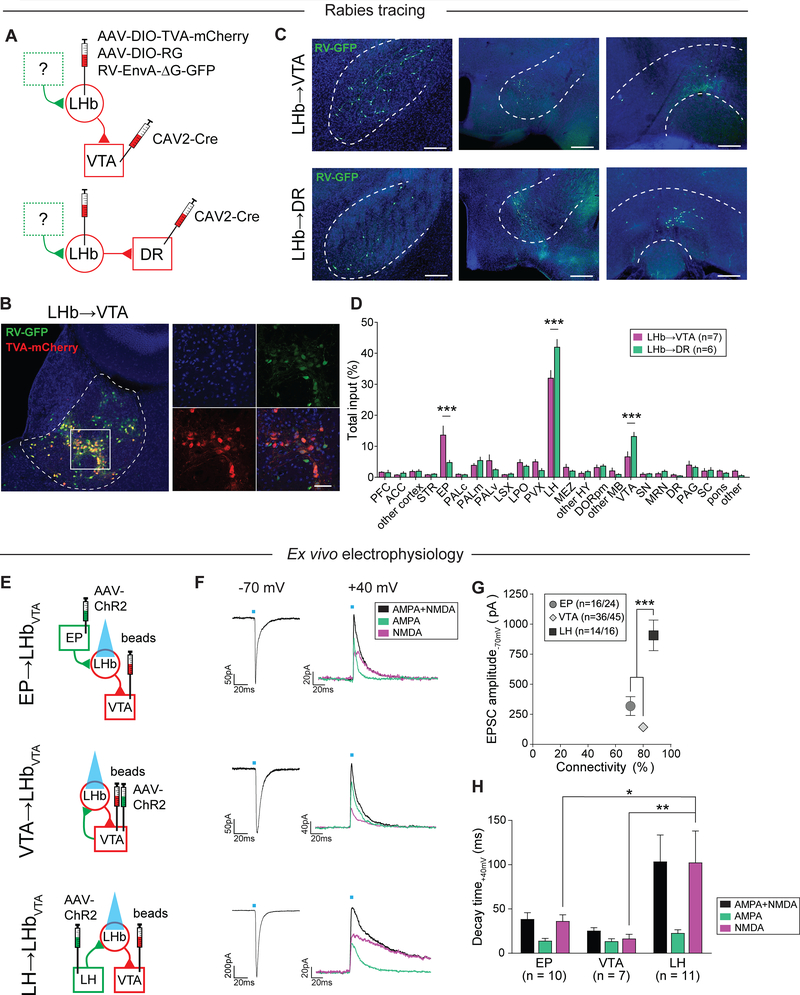
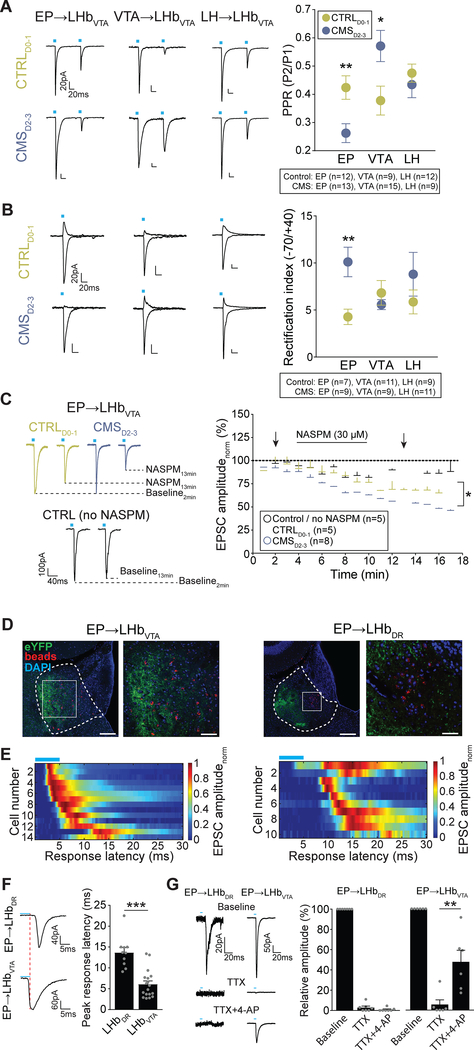
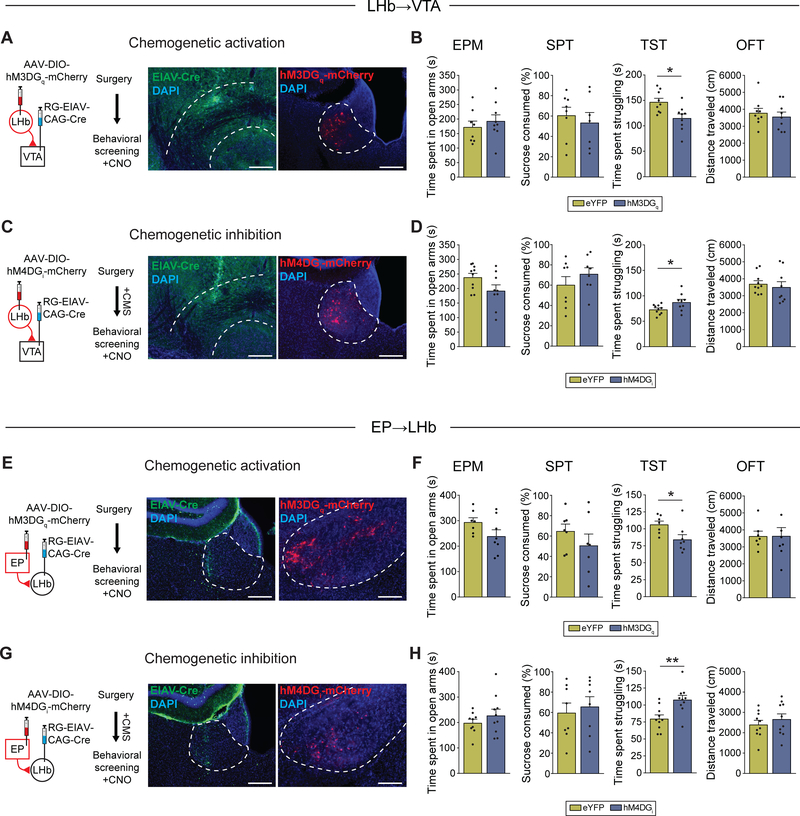
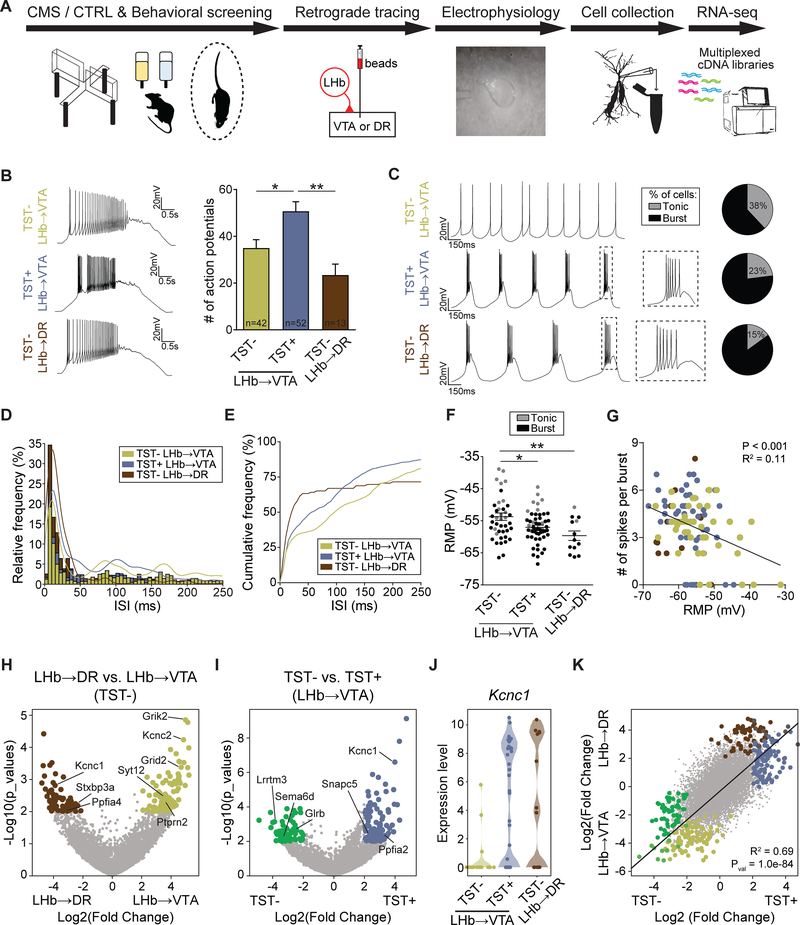
Chronic stress (CS) is a major risk factor for the development of depression. Here, we demonstrate that CS-induced hyperactivity in ventral tegmental area (VTA)-projecting lateral habenula (LHb) neurons is associated with increased passive coping (PC), but not anxiety or anhedonia. LHb→VTA neurons in mice with increased PC show increased burst and tonic firing as well as synaptic adaptations in excitatory inputs from the entopeduncular nucleus (EP). In vivo manipulations of EP→LHb or LHb→VTA neurons selectively alter PC and effort-related motivation. Conversely, dorsal raphe (DR)-projecting LHb neurons do not show CS-induced hyperactivity and are targeted indirectly by the EP. Using single-cell transcriptomics, we reveal a set of genes that can collectively serve as biomarkers to identify mice with increased PC and differentiate LHb→VTA from LHb→DR neurons. Together, we provide a set of biological markers at the level of genes, synapses, cells, and circuits that define a distinctive CS-induced behavioral phenotype.

Keywords: chronic stress; depression; dorsal raphe nucleus; entopeduncular nucleus; lateral habenula; ventral tegmental area.


Conflict of interest statement

DECLARATION OF INTERESTS

The authors declare no competing interests.

Figures

Figure 1.
Figure 1.. Classification of chronic stress-induced behavioral phenotypes
(A) Left: Time spent in open arms for CTRL (green) and CMS (blue) mice in the EPM; Right: Receiver operating characteristic (ROC) curve (blue line) for EPM data. Orange line: maximum Youden’s J index (JI; *** p < 0.001, data represent means ± SEM). (B) Left: Sucrose consumption (%) for CTRL (green) and CMS (blue) mice in the SPT; Right: ROC curve (blue line) for SPT data. Orange line indicates maximum JI (** p < 0.01, data represent means ± SEM). (C) Left: Time spent struggling for CTRL (green) and CMS (blue) mice in the TST; Right: ROC curve (blue line) for TST data. Orange line indicates maximum JI (*** p < 0.001, data represent means ± SEM). (D) 3D plot showing results from EPM, SPT and TST for individual CTRL (green) and CMS (blue) mice. (E) CTRL mice positive for zero (brown), one (purple), two (jade) or three (orange) behavioral criteria. An animal was considered positive if it scored below the corresponding cutoff value (dashed line; data represent means ± SEM). (F) CMS mice positive for zero (brown), one (purple), two (jade) or three (orange) behavioral criteria. An animal was considered positive if it scored below the corresponding cutoff value (dashed line; data represent means ± SEM). (G) Comparison of total population of CTRL (green) and CMS (blue) mice positive for zero, one, two or three criteria (D-score of zero to three, respectively). (H) Percentage of the total population of CTRL (top) and CMS (bottom) mice positive for zero, one, two, or three criteria (D-score of zero to three, respectively).
Figure 2.
Figure 2.. Hyperactivity of LHb neurons is associated with projection target and behavioral phenotype
(A) Experimental design. (B) Injection site of beads (red) in the VTA (IPN: interpeduncular nucleus; Scale bar: 300 μm). (C) Firing in response to +150 pA depolarizing current injection in LHb→VTA neurons from CTRL and CMS mice with different D-scores: CTRLD0–1 (top left), CMSD0–1 (top right), CTRLD2–3 (bottom left) and CMSD2–3 (bottom right) mice (Scale bars: 20 mV/0.5 s). (D) Mean number of action potentials in response to injection of different depolarizing ramp currents recorded in LHb→VTA neurons from CTRLD0–1 (light green), CTRLD2–3 (dark green), CMSD0–1 (pink) and CMSD2–3 (blue) mice (* p < 0.05, ** p < 0.01, data represent means ± SEM). (E-G) Mean number of action potentials in response to injection of a +150 pA depolarizing current in LHb→VTA neurons from CTRL or CMS mice that were pooled according to whether they were positive or negative for specific behavioral phenotypes (i.e. anxiety assessed in EPM (E), anhedonia assessed in SPT (F), immobility assessed in TST (G)). Animals were considered positive if they scored below the corresponding cutoff value defined in Figures 1A–1C (* p < 0.05, ** p < 0.01; data represent means ± SEM). (H) Experimental design. (I) Injection site of beads (red) in the DR (AQ: cerebral aqueduct; Scale bar: 400 μm). (J) Firing in response to +150 pA depolarizing current injection in LHb→DR neurons from CTRL and CMS mice with different D-scores: CTRLD0–1 (top) and CMSD2–3 (bottom) mice (Scale bars: 20 mV/0.5 s). (K) Mean number of action potentials in response to injection of different depolarizing ramp currents recorded in LHb→DR neurons from CTRLD0–1 (light green) and CMSD2–3 (blue) mice (data represent means ± SEM). (L) mEPSCs recorded in LHb→DR neurons from CTRLD0–1 (top) and CMSD2–3 (bottom) mice (Scale bars: 10 pA/1 s). (M) Mean mEPSC frequencies (left) and mEPSC amplitudes (right) recorded in LHb→DR neurons from CTRLD0–1 and CMSD2–3 mice (data represent means ± SEM).
Figure 3.
Figure 3.. Chronic stress increases burst and tonic firing of LHb→VTA neurons
(A) Experimental design. (B) Top: Injection-site of EIAV-Cre (red) in the VTA (left) and expression of ChR2-eYFP (green) in LHb→VTA neurons (right) (IP: interpeduncular nucleus, 3V: 3rd ventricle, MHb: medial habenula; DAPI: blue; Scale bars: 300 μm (left), 250 μm (right)). Bottom: Localizations of optrodes in LHb for CTRLD0–1 (green) and CMSD2–3 (blue) mice (fr: fasciculus retroflexus, DG: dentate gyrus). (C) Left: Action potential waveforms for LHb→VTA neurons in CTRLD0–1 (green) and CMSD2–3 (blue) mice (Scale bars: 20 μV/0.5 ms (CTRLD0–1), 30 μV/0.5 ms (CMSD2–3)). Right: Mean action potential width for LHb→VTA neurons in CTRLD0–1 (green) and CMSD2–3 (blue) mice (data represent means ± SEM). (D) Normalized frequencies of interspike intervals for LHb→VTA neurons in CTRLD0–1 (green) and CMSD2–3 (blue) mice. (E) Mean percentage of spikes in bursts recorded for LHb→VTA neurons in CTRLD0–1 (green) and CMSD2–3 (blue) mice (* p < 0.05, data represent means ± SEM). (F) Mean number of spikes per burst for LHb→VTA neurons in CTRLD0–1 (green) and CMSD2–3 (blue) mice (* p < 0.05, data represent means ± SEM). (G) Mean interburst frequencies for LHb→VTA neurons in CTRLD0–1 (green) and CMSD2–3 (blue) mice (* p < 0.05, data represent means ± SEM). (H) Mean intraburst frequencies for LHb→VTA neurons in CTRLD0–1 (green) and CMSD2–3 (blue) mice (data represent means ± SEM). (I) Mean tonic firing frequencies for LHb→VTA neurons in CTRLD0–1 (green) and CMSD2–3 (blue) mice (** p < 0.01, data represent means ± SEM). (J) Mean firing frequencies for LHb→VTA neurons in CTRLD0–1 (green) and CMSD2–3 (blue) mice (** p < 0.01, data represent means ± SEM).
Figure 4.
Figure 4.. Anatomical and functional mapping of inputs to LHb subpopulations
(A) Experimental design. (B) Left: Anatomical distribution of starter cells in the LHb for mapping inputs to LHb→VTA neurons. Starter cells: cells that co-express RV-GFP (green) and TVA-mCherry (red; Scale bar: 150 μm). Right: Higher magnification image (DAPI: blue; Scale bar: 60 μm). (C) Anatomical distribution of input neurons (i.e. RV-GFP-positive cells) to LHb→VTA (top) and LHb→DR (bottom) neurons in the entopeduncular nucleus (EP, left), lateral hypothalamus (LH, middle) and VTA (right; Scale bars: 200 μm (left, right), 400 μm (middle)). (D) Quantification of inputs to LHb→VTA (purple) and LHb→DR (green) neurons (percentage of total input counted in each individual brain). See Figure S4 legend for abbreviations (*** p < 0.001, data represent means ± SEM). (E) Experimental design. (F) Left: EPSCs for light stimulation of EP (top; Scale bar: 50 pA/20 ms), VTA (middle; Scale bar: 50 pA/20 ms) or LH (bottom; Scale bar: 200 pA/20 ms) inputs to LHb→VTA neurons. Right: EPSCs showing dual AMPAR+NMDAR- (black), AMPAR- (jade; in 50 μM AP5) and NMDAR (purple; after digital subtraction)-mediated currents (purple) for light stimulation of EP (top; Scale bar: 20 pA/20 ms), VTA (middle; Scale bar: 40 pA/20 ms) or LH (bottom; Scale bar: 20 pA/20 ms) inputs to LHb→VTA neurons. (G) Mean EPSC peak amplitudes and connectivity for EP, VTA and LH inputs to LHb→VTA neurons (*** p < 0.001, data represent means ± SEM). (H) Mean decay time for dual AMPAR+NMDAR (black), AMPAR (jade) and NMDAR (purple) components for EP, VTA or LH inputs to LHb→VTA neurons (* p < 0.05, ** p < 0.01, data represent means ± SEM).
Figure 5.
Figure 5.. Chronic stress induces synaptic adaptations in excitatory EP inputs to LHb→VTA neurons
(A) Left: Paired pulse EPSCs (100 ms interval; −70 mV) in response to light stimulation of EP (left), VTA (middle) or LH (right) inputs to LHb→VTA neurons in CTRLD0–1 (top) and CMSD2–3 (bottom) mice (Scale bars: 20 pA/20 ms). Right: Mean paired pulse ratios (PPR, calculated as peak2/peak1) for EP, VTA and LH inputs to LHb→VTA neurons in CTRLD0–1 (green) and CMSD2–3 (blue) mice (* p < 0.05, ** p < 0.01, data represent means ± SEM). (B) Left: AMPAR-mediated currents at +40 mV and −70 mV (in 50 μM AP5) for EP (left), VTA (middle) or LH (right) inputs to LHb→VTA neurons from CTRLD0–1 (top) and CMSD2–3 (bottom) mice (Scale bars: 20 pA/20 ms). Right: Mean rectification index (peak amplitude. 70mV/peak amplitude+40mV) for EP, VTA and LH inputs to LHb→VTA neurons from CTRLD0. 1 (green) and CMSD2–3 (blue) mice (** p < 0.01, data represent means ± SEM). (C) Left: EPSCs (−70 mV) for stimulation of EP inputs to LHb→VTA neurons during baseline and after wash-in of 30 μM NASPM in CTRLD0–1 (green) and CMSD2–3 (blue) mice. The amplitude of baseline EPSCs does not change over time when NASPM was not applied (black; Scale bar: 100 pA / 40 ms). Right: Normalized mean AMPAR-mediated EPSC amplitudes with and without bath application of NASPM for the three experimental groups. Arrows indicate sample traces shown on the left (* p < 0.05, data represent means ± SEM). (D) Left: EP terminals (eYFP, green) in lateral LHb adjacent to retrogradely labeled (beads, red) LHb→VTA neurons (DAPI: blue; Scale bars: 160 μm (left), 80 μm (right)). Right: EP terminals (eYFP, green) in lateral LHb and retrogradely labeled (beads, red) LHb→DR neurons in medial LHb. Squares indicate higher magnification images (Scale bars: 160 μm (left), 40 μm (right)). (E) Heat map representing peak response latencies of LHb→VTA (left) and LHb→DR (right) neurons in response to light stimulation of excitatory EP terminals in the LHb. Each row represents individual cells. Color code represents normalized EPSC amplitude. (F) Left: EPSCs from LHb→DR (top) or LHb→VTA (bottom) neurons in response to light stimulation of EP terminals in the LHb (Scale bars: 40 pA/5ms (top), 60 pA/5ms (bottom)). Right: Mean peak response latencies for light stimulation of excitatory EP inputs to LHb→DR or LHb→VTA neurons (*** p < 0.001, mean ± SEM). (G) Left: EPSCs from LHb→DR (left) or LHb→VTA (right) neurons in response to light stimulation of EP terminals at baseline (top), after bath application of TTX (middle) and TTX + 4-AP (bottom; Scale bars: 20 pA/20 ms (left), 50 pA/20 ms (right)). Right: Relative amplitudes of EPSCs recorded from LHb→DR and LHb→VTA neurons in response to light stimulation of EP terminals in the LHb at baseline and after wash-in of TTX or TTX + 4-AP (** p < 0.01, data represent means ± SEM).
Figure 6.
Figure 6.. In vivo chemogenetic modulation of LHb circuitry selectively alters passive coping and effort-related motivation
(A) Experimental design (left) and injection-site of EIAV-Cre (green) in VTA (middle) and hM3DGq-mCherry (red) expression in LHb→VTA neurons (right) (DAPI: blue; Scale bars: 300 μm (left), 200 μm (right)). (B) Time spent in open arms in EPM, sucrose consumption in SPT, time spent struggling in TST and total distance travelled in OFT after CNO injections for non-stressed mice expressing eYFP or hM3DGq-mCherry in LHb→VTA neurons (* p < 0.05, data represent means ± SEM). (C) Experimental design (left) and injection-site of EIAV-Cre (green) in VTA (middle) and hM4DGi-mCherry (red) expression in LHb→VTA neurons (right) (DAPI: blue; Scale bars: left: 300 μm (left), 200 μm (right)). (D) Time spent in open arms in EPM, sucrose consumption in SPT, time spent struggling in TST and total distance travelled in OFT after CNO injections for CMS mice expressing eYFP or hM4DGi-mCherry in LHb→VTA neurons (* p < 0.05, data represent means ± SEM). (E) Experimental design (left) and injection-site of EIAV-Cre (green) in LHb (middle) and hM3DGq-mCherry (red) expression in EP→LHb neurons (right) (DAPI: blue; Scale bars: 300 μm (left), 200 μm (right)). (F) Time spent in open arms in EPM, sucrose consumption in SPT, time spent struggling in TST and total distance travelled in OFT after CNO injections for non-stressed mice expressing eYFP or hM3DGq-mCherry in EP→LHb neurons (* p < 0.05, data represent means ± SEM). (G) Experimental design (left) and injection-site of EIAV-Cre (green) in LHb (middle) and hM4DGi-mCherry (red) expression in EP→LHb neurons (right) (DAPI: blue; Scale bars: 300 μm (left), 200 μm (right)). (H) Time spent in open arms in EPM, sucrose consumption in SPT, time spent struggling in TST and total distance travelled in OFT after CNO injections for CMS mice expressing eYFP or hM4DGi-mCherry in EP→LHb neurons (** p < 0.01, data represent means ± SEM).
Figure 7.
Figure 7.. Molecular and physiological correlates of passive coping
(A) Experimental design. (B) Left: Firing in response to +150 pA depolarizing current injection from LHb→VTA neurons in TST-negative (TST−, top), TST-positive (TST+, middle) mice and LHb→DR neurons (TST−, bottom; Scale bars: 20 mV/0.5 s). Right: Mean number of action potentials in response to +150 pA depolarizing current injection for the three groups (* p < 0.05, ** p < 0.01, data represent means ± SEM). (C) Current clamp recordings and pie charts showing an increased number of cells with burst firing in TST+ LHb→VTA and TST− LHb→DR compared to TST− LHb→VTA neurons. Firing was initiated with a brief, transient injection of a hyperpolarizing current (Scale bars: 20 mV/150 ms). (D) ISI histogram with corresponding Kernel density functions for TST+ LHb→VTA, TST− LHb→VTA and TST− LHb→DR neurons. (E) Cumulative frequency histogram displaying a shift to shorter ISIs in TST+ LHb→VTA cells compared to TST− LHb→VTA neurons. By contrast, TST− LHb→DR neurons display the shortest ISIs. (F) Mean resting membrane potentials (RMP) for TST+ LHb→VTA, TST− LHb→VTA and TST− LHb→DR neurons (grey: cells that displayed tonic firing, black: bursting cells; * p < 0.05, ** p < 0.01, data represent means ± SEM). (G) Number of spikes per burst is inversely correlated with RMP. Zero spikes per burst represent data from cells that displayed only tonic, but no burst firing. (H) Volcano plots displaying differential gene expression between single LHb→VTA and LHb→DR neurons in TST− mice. Gold and brown data points denote genes that are significantly enriched in LHb→VTA versus TST− LHb→DR neurons from TST− mice, respectively. Highlighted are the ion channel-coding and synapse-related genes. Gray data points represent genes that are not significantly enriched in either category (i.e. absolute value of Log2(Fold Change) < 2 and p < 0.01). (I) Violin plot displaying differential gene expression between single LHb→VTA neurons in TST− versus TST+ mice. Green and blue data points denote genes that are significantly enriched in cells from TST− versus TST+ mice, respectively. Gray data points represent genes that are not significantly enriched in either category (i.e. absolute value of Log2(Fold Change) < 2 and p < 0.01). (J) Violin plots showing upregulation of Kcnc1 gene expression in single-cells from TST+ compared to TST− mice. Kcnc1 is also significantly higher expressed in TST− LHb→DR versus TST− LHb→VTA neurons, but not different between TST− LHb→DR versus TST+ LHb→VTA neurons. (K) Regression analysis of differential gene expression between TST− LHb→VTA versus TST+ LHb→VTA neurons and between TST− LHb→DR versus TST− LHb→VTA neurons. For each gene, data points represent Log2 (Fold Change) values in both comparisons; colored data points highlight the same genes as identified in panels (H) and (I).

References

    1. Agudelo LZ, Femenia T, Orhan F, Porsmyr-Palmertz M, Goiny M, Martinez-Redondo V, Correia JC, Izadi M, Bhat M, Schuppe-Koistinen I, et al. (2014). Skeletal muscle PGC-1α1 modulates kynurenine metabolism and mediates resilience to stress-induced depression. Cell 159, 33–45. - PubMed
    1. Akil H, Gordon J, Hen R, Javitch J, Mayberg H, McEwen B, Meaney MJ, and Nestler EJ (2018). Treatment resistant depression: A multi-scale, systems biology approach. Neurosci. Biobehav. Rev 84, 272–288. - PMC - PubMed
    1. Andalman AS, Burns VM, Lovett-Barron M, Broxton M, Poole B, Yang SJ, Grosenick L, Lerner TN, Chen R, Benster T, et al. (2019). Neuronal Dynamics Regulating Brain and Behavioral State Transitions. Cell 177, 970–985.e20. - PMC - PubMed
    1. Bagot RC, Cates HM, Purushothaman I, Lorsch ZS, Walker DM, Wang J, Huang X, Schluter OM, Maze I, Pena CJ, et al. (2016). Circuit-wide Transcriptional Profiling Reveals Brain Region-Specific Gene Networks Regulating Depression Susceptibility. Neuron 90, 969–983. - PMC - PubMed
    1. Bernard R, and Veh RW (2012). Individual neurons in the rat lateral habenular complex project mostly to the dopaminergic ventral tegmental area or to the serotonergic raphe nuclei. J. Comp. Neurol 520, 2545–2558. - PubMed

Publication types