. 2020 Feb 7:486:110057.
doi: 10.1016/j.jtbi.2019.110057. Epub 2019 Oct 28.

Stochastic modeling of human papillomavirusearly promoter gene regulation

Affiliations

Stochastic modeling of human papillomavirusearly promoter gene regulation

Alberto Giaretta et al. J Theor Biol. .

Abstract

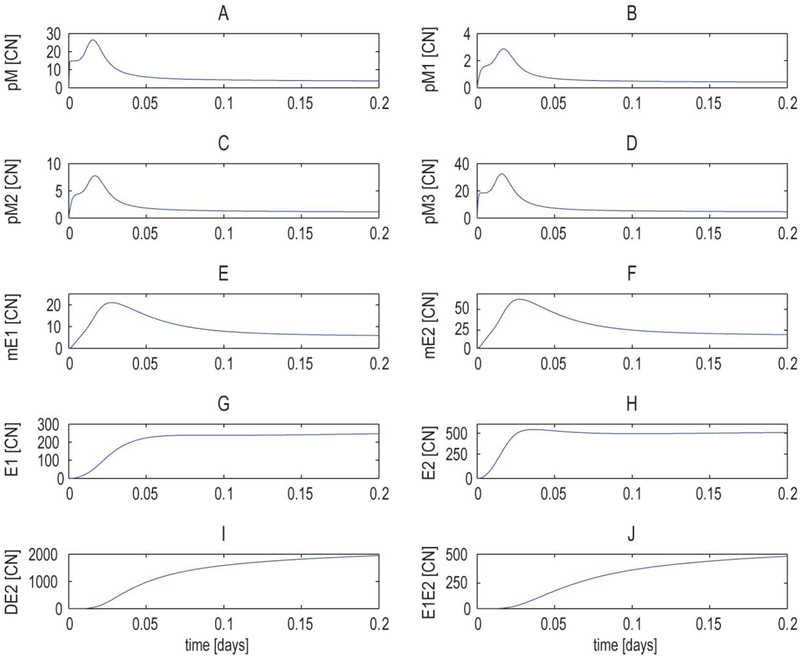
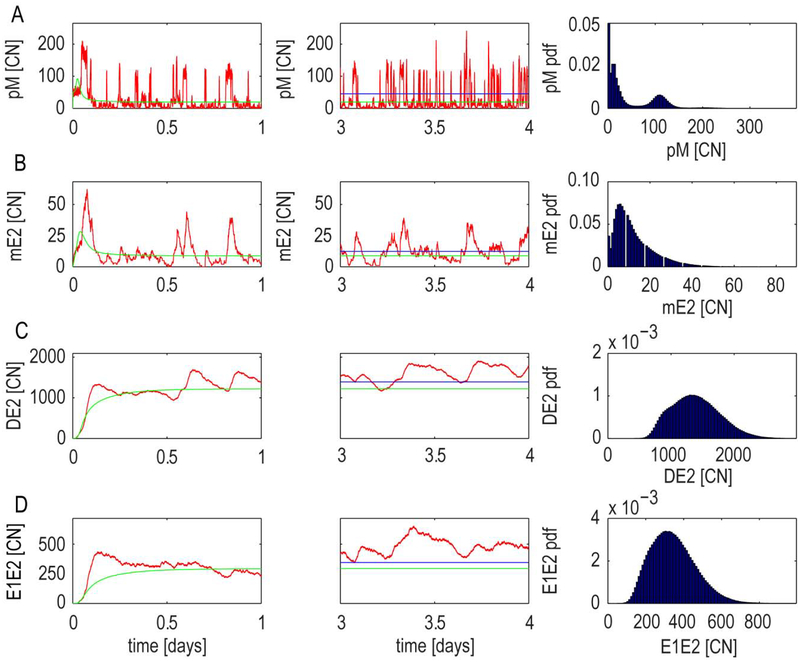
High risk forms of human papillomaviruses (HPVs) promote cancerous lesions and are implicated in almost all cervical cancer. Of particular relevance to cancer progression is regulation of the early promoter that controls gene expression in the initial phases of infection and can eventually lead to pre-cancer progression. Our goal was to develop a stochastic model to investigate the control mechanisms that regulate gene expression from the HPV early promoter. Our model integrates modules that account for transcriptional, post-transcriptional, translational and post-translational regulation of E1 and E2 early genes to form a functioning gene regulatory network. Each module consists of a set of biochemical steps whose stochastic evolution is governed by a chemical Master Equation and can be simulated using the Gillespie algorithm. To investigate the role of noise in gene expression, we compared our stochastic simulations with solutions to ordinary differential equations for the mean behavior of the system that are valid under the conditions of large molecular abundances and quasi-equilibrium for fast reactions. The model produced results consistent with known HPV biology. Our simulation results suggest that stochasticity plays a pivotal role in determining the dynamics of HPV gene expression. In particular, the combination of positive and negative feedback regulation generates stochastic bursts of gene expression. Analysis of the model reveals that regulation at the promoter affects burst amplitude and frequency, whereas splicing is more specialized to regulate burst frequency. Our results also suggest that splicing enhancers are a significant source of stochasticity in pre-mRNA abundance and that the number of viruses infecting the host cell represents a third important source of stochasticity in gene expression.

Keywords: Feedback regulation; RNA splicing; Stochastic bursting.


Figures

Fig 1.
Fig 1.. HPV molecular biology.
(A) HPV genome structure. The HPV genome is shown as a black circle with the early (PE), late (PL) and E8 (PE8) promoters marked by arrows. The six early ORFs (in red), namely the regulatory genes E1, E2, E4, E5 are expressed from either PE or PL, the oncogenes E6 and E7 are expressed only by PE and E8 is expressed only by PE8, depending of the stage of the viral lifecycle. The late ORFs L1 and L2 (in orange) are expressed from PL. All the viral genes are encoded on one strand of the double-stranded circular DNA genome. (B) The early promoter. This promoter accounts for positive and negative transcriptional regulation and is modeled with two binding sites where DE2 dimer and E1E2 heterodimer can bind and modulate transcription. (C) Splicing regulation. E1 and E2 transcript levels are spliced at the splicing sites SA742 and SA2709, respectively, while the remaining early genes are spliced at SA3358, regulated by the splicing factor SRSF1. E1 and E2 are produced in the absence of splicing factor SRSF1, hence they are indirectly regulated by this latter. (D) The SRSF1 promoter. This promoter is modeled as a two-state system with E2 transactivation. This constitutes a negative feedback loop for E1 and E2 expression. The formation of the heterodimer between SRSF1 protein and transcript, mSRSF1/SRSF1, is a negative regulator of SRSF1 activity.
Fig 2.
Fig 2.. State diagram for the early promoter (PE).
The promoter PE,i is regulated by the binding of DE2 and E1E2. State PE,0 (empty promoter) accounts for basal transcription, state PE,1 (single bound DE2) accounts for positive feedback, state PE,3 accounts for strong positive feedback and states PE,2 (two bound DE2) and PE,4 (E1E2 and DE2 bound) account for negative feedback. ki, i ϵ {2,4,6,8} are dissociation rate constants while the ki, i ϵ {1,3,5,7} are association rate constants.
Fig 3.
Fig 3.. State diagram for the pM splicing.
pM is the pre-mRNA which is not undergoing splicing or it is undergoing splicing through splicing sites not accounted for in the model; pM1 is the pre-mRNA which is in a state where splicing occurs at SA742 site with the consequent conversion to E1 mRNA; pM2 is the pre-mRNA which is in a state where splicing occurs at SA2709 site with the consequent conversion to E2 mRNA; pM3 is the pre-mRNA which is in a state where splicing occurs at SA3358 site with the consequent conversion to the remaining early transcripts. The binding of SRSF1 splicing factor to the pM enhances the pM3 state occurrence. ki, i ϵ {10,12,14} are dissociation rate constants while the ki, i ϵ {9,11,13} are association rate constants.
Fig 4.
Fig 4.. Steady-state probabilities for the early promoter.
Model predictions of the early promoter states as a function of the total copy number [CN] TE.
Fig 5.
Fig 5.. Deterministic model behavior under nominal parameters.
Time series copy number (CN) for (A) pM primary transcript, (B) pM1 primary transcript, (C) pM2 primary transcript, (D) pM3 primary transcript, (E) mE1 transcript, (F) mE2 transcript, (G) E1 protein, (H) E2 protein, (I) DE2 homodimer, (J) E1E2 heterodimer.
Fig 6.
Fig 6.. Features of the model response for pM1, pM2 and pM3 primary transcripts under different parameter values of the splicing control.
Features of the model response are investigated for different values of k9 and k13 parameters, which are the transition rates between pM and pM1 and pM and pM3, respectively. k14, the transition rate between pM3 and pM, is also vaired being connected to k13 through the constraint k14 = k13*kD,SRSF1, where kD,SRSF1 is the SRSF1 dissociation constant (see Table S1, Supplementary Information). k13 axis, in all the subplots, is intended to be scaled by an order of magnitude of 107. (A) pM1 peak amplitude copy number [CN], (B) pM1 steady state [CN], (C) pM1 peak width [min], (D) pM1 peak time [min], (E) pM2 peak amplitude [CN], (F) pM2 steady state [CN], (G) pM2 peak width [min], (H) pM2 peak time [min], (I) pM3 peak amplitude [CN], (J) pM3 steady state [CN], (K) pM3 peak width [min], (L) pM3 peak time [min].
Fig 7.
Fig 7.. Features of the model response for pM1, pM2 and pM3 primary transcripts under different parameter values of the splicing control and correspondent deterministic behavior.
Features of the model response are investigated for different values of k10 and k11 parameters, which are the transition rates between pM1 and pM and pM and pM2, respectively. (A) pM1 steady state copy number [CN], (B) pM2 steady state [CN], (C) pM3 steady state [CN]. Time series [CN] under a 10 fold decrease k11 parameter for (D) pM primary transcript, (E) pM1 primary transcript, (F) pM2 primary transcript, (G) pM3 primary transcript, (H) mE1 transcript, (I) mE2 transcript, (J) E1 protein, (K) E2 protein, (L) DE2 homodimer, (M) E1E2 heterodimer.
Fig. 8.
Fig. 8.. Stochastic model behavior for slow promoter and splicing fluctuations regime.
Promoter and splicing binding rates were decreased of 10 fold compared to the nominal values. Time series of copy number, [CN], and steady-state distributions for: (A) pM primary transcript, (B) mE2 transcript, (C) DE2 homodimer, (D) E1E2 heterodimer. The comparisons between the stochastic behavior (red) and the quasi-equilibrium approximation (green) are shown during the transient response (left panels) and steady state (middle panels). Numerical steady state mean (blue) is also shown during the steady state. The right panels show the steady state distributions. Mean and distributions were derived from 100 stochastic realizations run for a time length of 4 days.
Fig. 9.
Fig. 9.. Stochastic model behavior for decreased SRSF1 promoter fluctuations.
SRSF1 promoter binding rates were decreased of 100 fold than the nominal value and the ratio between the SRSF1 synthesis rates between active and inactive promoter increased of 10 fold. Time series of copy number, [CN], and steady-state distributions for: (A) pM primary transcript, (B) mE2 transcript, (C) DE2 homodimer, (D) E1E2 heterodimer. The comparisons between the stochastic behavior (red) and the quasi-equilibrium approximation (green) are shown during the transient response (left panels) and steady state (middle panesl). Numerical steady state mean (blue) is also shown during the steady state. The right panels show the steady state distributions. Mean and distributions were derived from 100 stochastic realizations run for a time length of 4 days.
Fig. 10.
Fig. 10.. SRSF1 amplitude modulation.
Time series of copy number, [CN], and quasi-equilibrium for SRSF1 promoter fluctuations decreased of 100 fold than the nominal value and the ratio between the SRSF1 synthesis rates between active and inactive promoter increased of 10 fold. (A) pM primary transcript, (B) pM1 primary transcript, (C) pM2 primary transcript, (D) pM3 primary transcript, (E) DE2 homodimer, (F) SRSF1 protein. The stochastic behavior is shown in red and the quasi-equilibrium approximation is shown in blue.
Fig. 11.
Fig. 11.. Noise strength.
Coefficient of variation (CV) of some interesting chemical species under variation of the magnitude of the promoter binding rates (proportional to fEP), splicing rates (proportional to fSS) and SRSF1 synthesis rates (proportional to fSRSF1). CV as a function of fEP for: (A) pM1 primary transcript, (B) pM2 primary transcript, (C) mE1 transcript, (D) mE2 transcript. CV as a function of fSS for: (E) pM primary transcript, (F) pM1 primary transcript, (G) pM2 primary transcript, (H) pM3 primary transcript. CV as a function of fSRSF1 for: (I) pM primary transcript, (J) pM1 primary transcript, (K) pM2 primary transcript, (L) pM3 primary transcript.
Fig 12.
Fig 12.. Promoter and splicing control of bursts amplitude and frequency.
Bursts features (frequency, duration and amplitude) of mE2 transcript are shown for different magnitudes of promoter binding rates (proportional to fEP), splicing rates (proportional to fSS), SRSF1 synthesis rates (proportional to fSRSF1) and different ratios (R) between positive and negative feedback strengths. Bursts frequency (left panels), bursts duration (middle panels) and bursts amplitude (right panels). Bursts features as function of (A,B,C) fEP, (D,E,F) R, (G,H,I) fSS, (J,K,L) fSRSF1,.
Fig 13.
Fig 13.. Noise and bursts features controlled by the number of viruses N.
Coefficient of variation of (A) pM2 primary transcript and (B) mE2 transcript as function of N. (C-E) Burst frequency, duration and amplitude of mE2 transcript as a function of N.

Similar articles

References

    1. Doorbar J, Quint W, Banks L, Bravo IG, Stoler M, Broker TR, et al. The biology and life-cycle of human papillomaviruses. Vaccine. 2012;30(Suppl.5):F55–70. - PubMed
    1. Bernard H-U. Gene expression of genital human papillomaviruses and considerations on potential antiviral approaches. Antivir Ther. 2002. December 1;7(4):219–37. Review. - PubMed
    1. Cobo F Human Papillomavirus Infections from the laboratory to clinical practice. 1st ed Woodhead Publishing; 2012.
    1. Ozbun MA. Human papillomavirus type 31b infection of human keratinocytes and the onset of early transcription. J Virol. 2002;76(22):11291–300. - PMC - PubMed
    1. Johansson C, Schwartz S. Regulation of human papillomavirus gene expression by splicing and polyadenylation. Nat Rev Microbiol. 2013. March 11;11(4):239–51. - PubMed

Publication types

MeSH terms

LinkOut - more resources