. 2020 Jan 6;219(1):e201812044.
doi: 10.1083/jcb.201812044.

Tumor protein D54 defines a new class of intracellular transport vesicles

Affiliations

Tumor protein D54 defines a new class of intracellular transport vesicles

Gabrielle Larocque et al. J Cell Biol. .

Abstract

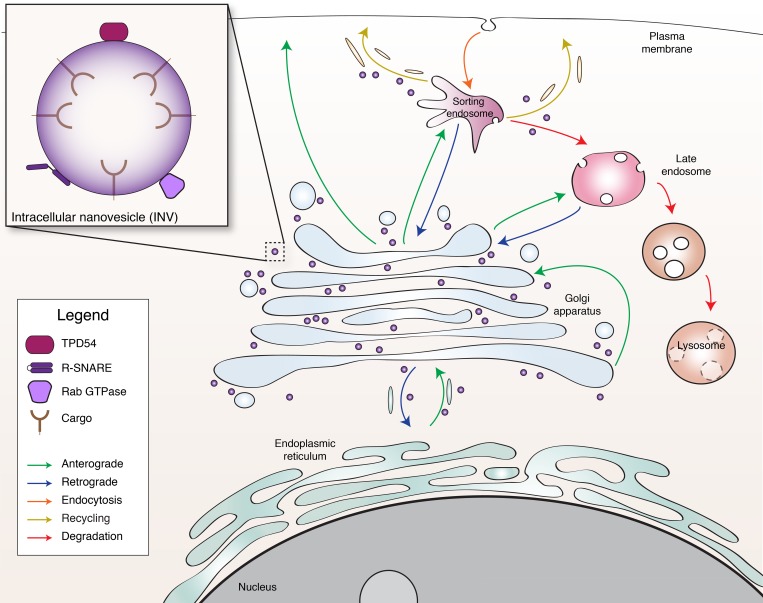
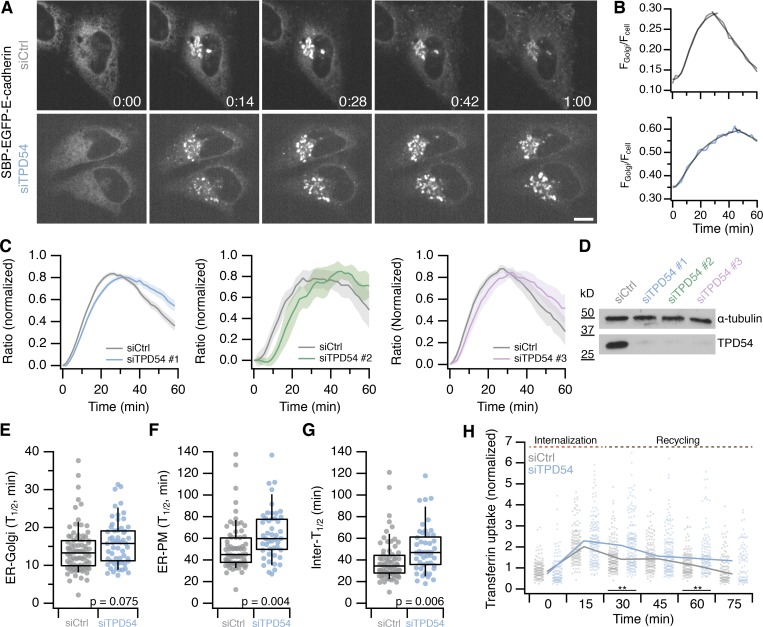
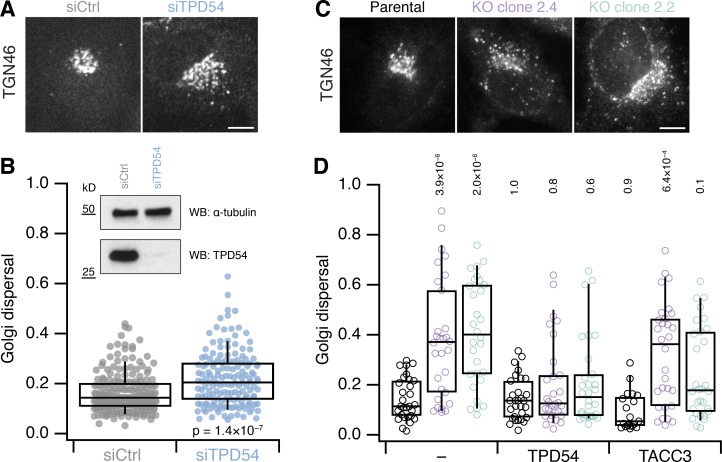
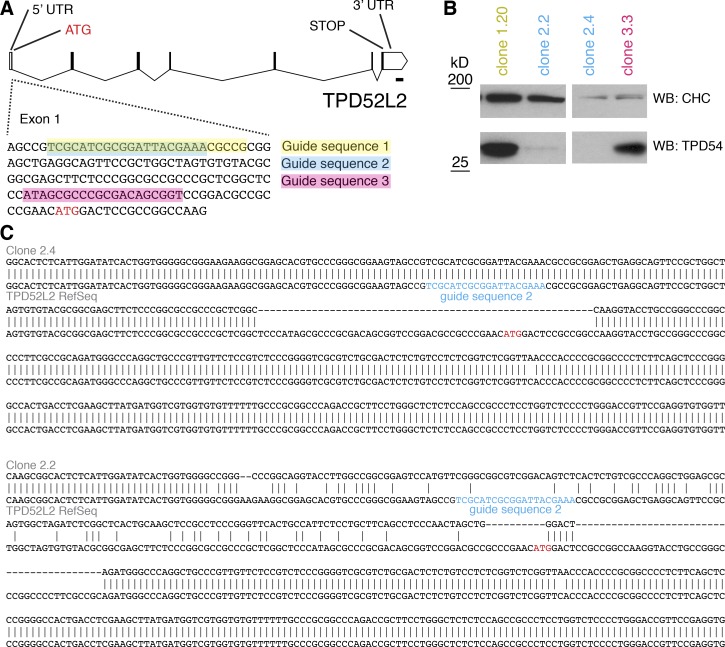
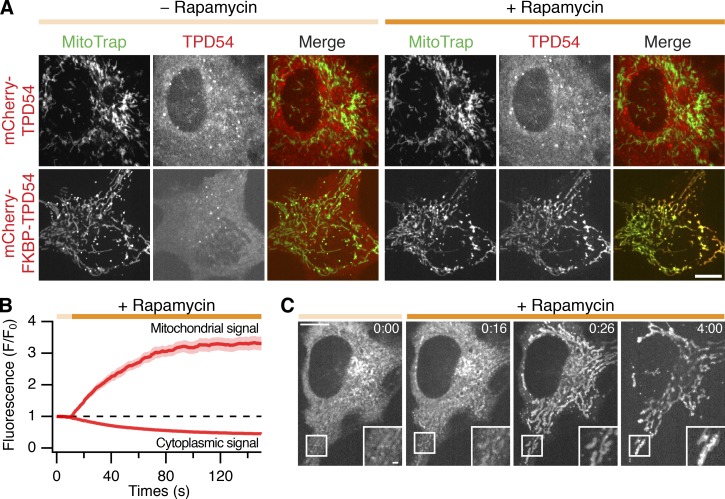
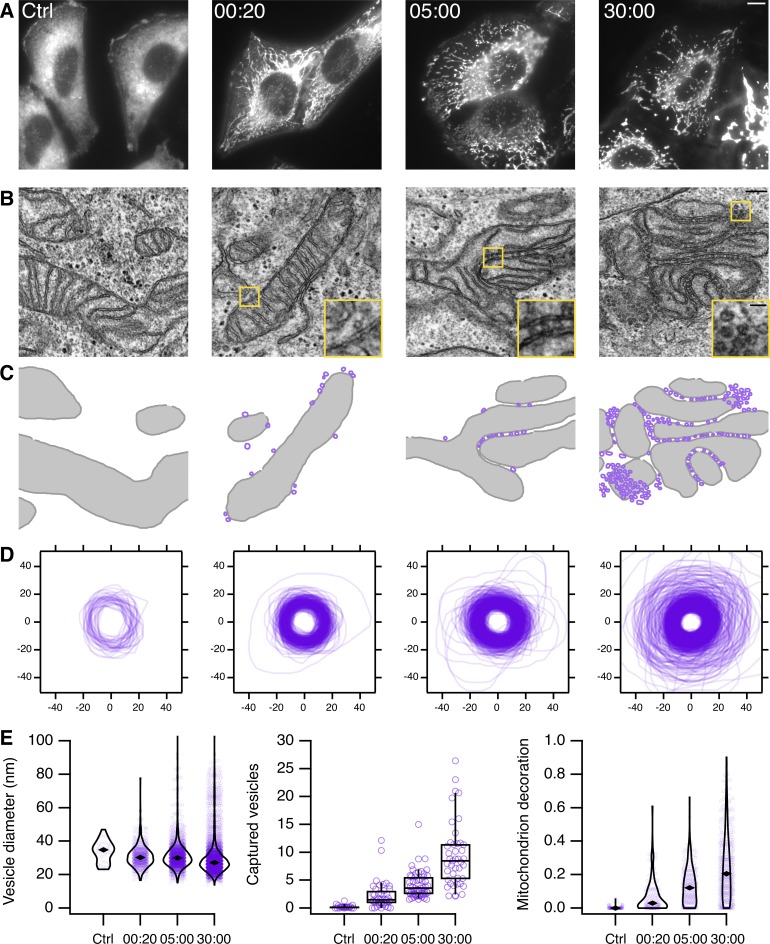
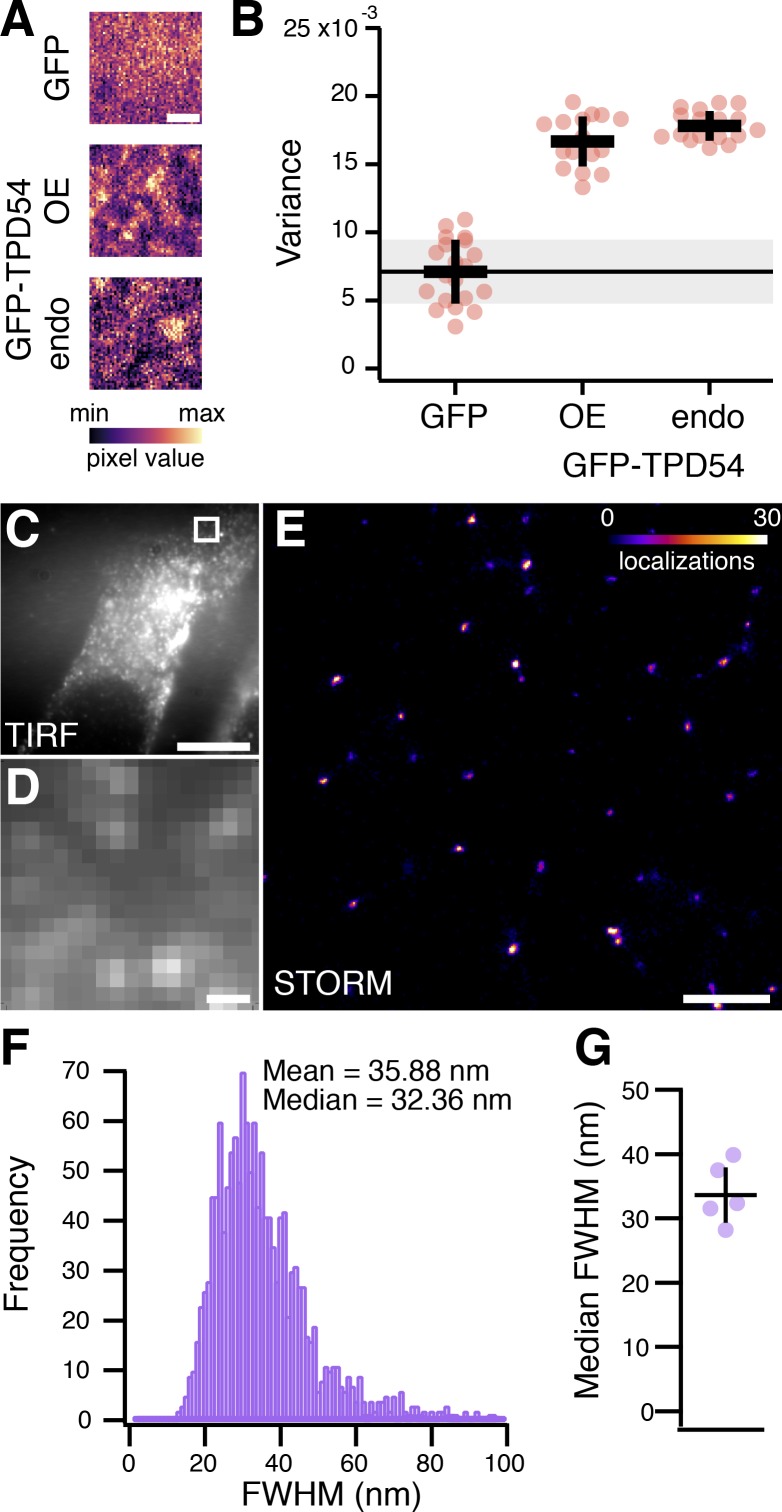
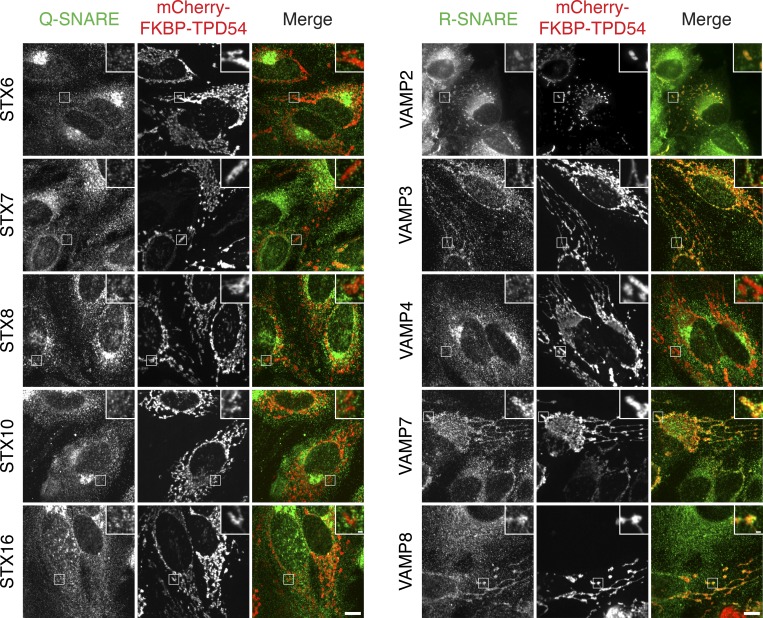
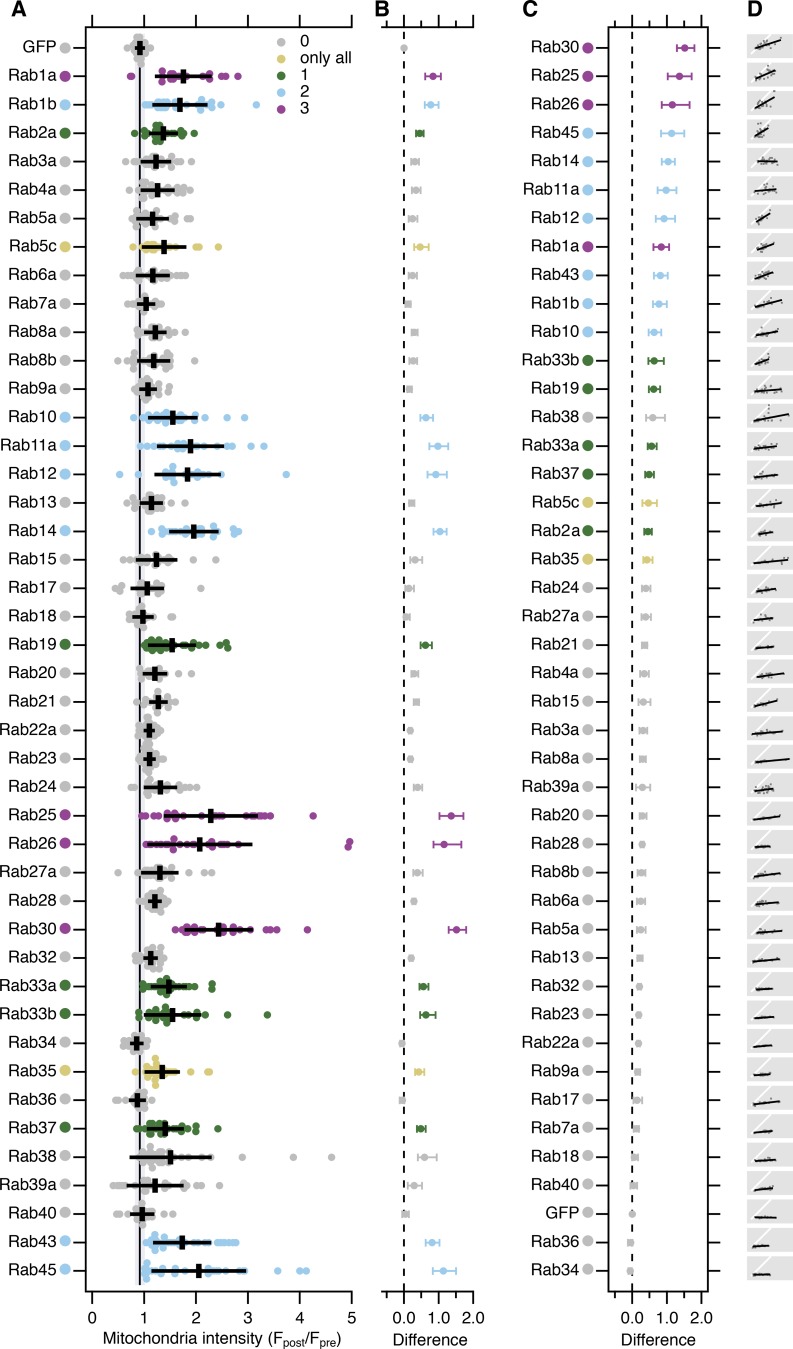
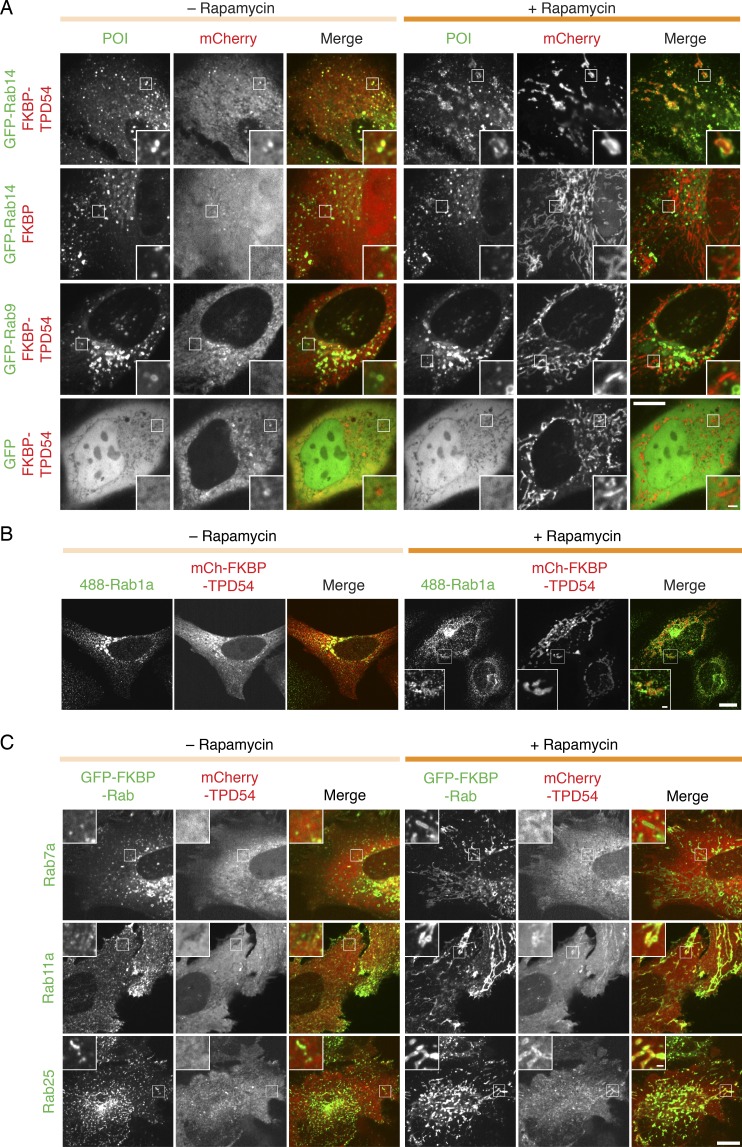
Transport of proteins and lipids from one membrane compartment to another is via intracellular vesicles. We investigated the function of tumor protein D54 (TPD54/TPD52L2) and found that TPD54 was involved in multiple membrane trafficking pathways: anterograde traffic, recycling, and Golgi integrity. To understand how TPD54 controls these diverse functions, we used an inducible method to reroute TPD54 to mitochondria. Surprisingly, this manipulation resulted in the capture of many small vesicles (30 nm diameter) at the mitochondrial surface. Super-resolution imaging confirmed the presence of similarly sized TPD54-positive structures under normal conditions. It appears that TPD54 defines a new class of transport vesicle, which we term intracellular nanovesicles (INVs). INVs meet three criteria for functionality. They contain specific cargo, they have certain R-SNAREs for fusion, and they are endowed with a variety of Rab GTPases (16 out of 43 tested). The molecular heterogeneity of INVs and the diverse functions of TPD54 suggest that INVs have various membrane origins and a number of destinations. We propose that INVs are a generic class of transport vesicle that transfer cargo between these varied locations.


Figures

None
Graphical abstract
Figure 1.
Figure 1.
TPD54 is a membrane trafficking protein. (A) Representative confocal micrographs showing transiently expressed mCherry-tagged membrane trafficking proteins of interest (POI) and endogenously tagged GFP-TPD54. Inset, 3× zoom. Scale bars, 10 µm, 1 µm (inset). (B) Volcano plot of a comparative mass spectrometry analysis of GFP-TPD54 vs. GFP co-immunoprecipitation. Proteins enriched more than twofold in GFP-TPD54 samples compared with GFP are shown in red or pink; those P < 0.05 are shown in blue or pink. nexp = 4. Note, glycogen debranching enzyme (3.7-fold increase, P = 1.09 × 10⁻⁸) is not shown. Proteomic data and volcano plot calculations are available (Royle, 2019). IP, immunoprecipitation.
Figure S1.
Figure S1.
Characterization of the GFP-TPD54 knock-in cell line. (A) Gene map of TPD52L2 and location of GFP tagging. (B) FACS plot. GFP-positive cells in the indicated gate were recovered and characterized. (C) Representative confocal micrograph of an example GFP-TPD54 knock-in clone. Scale bar, 10 µm. (D) Clones were validated by Western blot (WB). Cells overexpressing GFP-TPD54, parental HeLa cells, TPD54-depleted cells, and three different clones are shown. Clone 35 exhibited the desired band profile. A single GFP-TPD54 band detected by blotting for TPD54 and GFP, with no untagged TPD54. Tubulin is shown as a loading control; note that one tenth of the GFP-TPD54 transfected sample was loaded. (E) Sequencing the TPD52L2 locus in clone 35. Two bands were amplified using primers flanking the integration site. The first sequence shows integration of monomeric GFP between the homology arms, giving GFP-TPD54. The second sequence shows that clone 35 is null at the other allele. KD, knockdown; PE, phycoerythrin.
Figure S2.
Figure S2.
Overexpressed TPD54 colocalizes with membrane trafficking components. (A) Representative confocal micrographs comparing the subcellular distributions of mCherry-TPD54 with those of the Golgi apparatus marker TGN46, the early endosomal marker EEA1, or the lysosomal marker LAMP1. (B) Examples of the similar subcellular distribution of TPD54 in cells expressing GFP-TPD54, mCherry-TPD54, or FLAG-TPD54 (detected by immunofluorescence). Insets, 3× zoom. Scale bars, 10 µm, 1 µm (insets). POI, proteins of interest.
Figure 2.
Figure 2.
TPD54-depleted cells have defective anterograde membrane traffic and cargo recycling. (A) Still confocal images of RUSH experiments. SBP-EGFP–E-cadherin localization in control (siCtrl) and TPD54-depleted (siTPD54) HeLa cells at the indicated times (minutes and seconds) after biotin treatment. Scale bar, 10 µm. (B) Single cell traces of the E-cadherin fluorescence ratio of a control (gray) or TPD54-depleted (blue) cell, fitted with a logistic function and a line. (C) Normalized fraction of total E-cadherin fluorescence at the Golgi as a function of time in control (gray) or TPD54-depleted (colored) cells. Results from three siRNAs are shown as indicated. Line and shaded area, mean ± SEM. ncell = 85 (siCtrl), 62 (siTPD54 #1), nexp = 2; ncell = 23 (siCtrl), 12 (siTPD54 #2), nexp = 1; ncell = 43 (siCtrl), 20 (siTPD54 #3), nexp = 1. (D) Western blot to assess the depletion of TPD54 by RNAi for three siRNAs. The protein level of TPD54 and α-tubulin (loading control) is shown. (E–G) Box plots showing the t1/2 of E-cadherin transport from ER-to-Golgi (E) and from ER-to-PM (F) in control and TPD54-depleted cells. (G) The difference in t1/2 represents intra-Golgi transport. Dots represent individual cells, boxes show interquartile range, bars represents the median, and whiskers show 9th and 91st percentiles. The P values are from Student’s t test with Welch’s correction. ncell = 57−82, nexp = 2. (H) Plot showing the uptake and recycling of transferrin in control and TPD54-depleted cells. Dots represent individual cells, lines represent the median value. Wilcoxon rank test. **, P< 0.01. ncell = 77−160, nexp = 3.
Figure 3.
Figure 3.
Golgi dispersal in cells lacking TPD54. (A) Micrographs of TGN46 distribution in HeLa cells treated with siCtrl (GL2) or siTPD54 (TPD54 RNAi). Scale bar, 10 µm. (B) Quantification of Golgi dispersal in control and TPD54-depleted cells. Golgi dispersal is the area of a convex hull of the TGN46 signal as a fraction of the total cell area. ncell = 155−197, nexp = 3. Inset, Western blot to show knockdown efficiency. (C) Micrographs of TGN46 distribution in parental HeLa cells and two clones with targeted disruption of the TPD54 locus (2.4 and 2.2). Scale bar, 10 µm. (D) Quantification of Golgi dispersal in each clone compared with parental cells. FLAG-TPD54 and FLAG-TACC3 was expressed as indicated; − indicates no reexpression. Dots represent individual cells, boxes show interquartile range, bars represents the median, and whiskers show 9th and 91st percentiles. ncell = 19−30, nexp = 3. The P values shown are from Wilcoxon rank sum test (B) or Dunnett’s multicomparison test compared with control with no reexpression (D). KO, knockout.
Figure S3.
Figure S3.
Targeted disruption of TPD54 gene in HeLa cells using CRISPR/Cas9. (A) Three guides were designed to target the TPD52L2 locus. (B) Single-cell clones were isolated and screened by Western blotting. Two clones, 2.2 and 2.4, showed loss of TPD54 expression. (C) Sequencing of PCR amplicons using primers flanking the CRISPR/Cas9 targeting site revealed disruption of the locus in clones 2.2 and 2.4. Sequencing of the top three most similar protospacer adjacent motif (PAM) sequences in the genome showed no change from the parental sequence. CHC, clathrin heavy chain.
Figure 4.
Figure 4.
TPD54 can be rerouted efficiently to mitochondria. (A) Confocal micrographs showing the rerouting of mCherry-FKBP-TPD54, but not mCherry-TPD54, to mitochondria in cells coexpressing YFP-MitoTrap after addition of 200 nM rapamycin (orange bar). (B) Kinetics of mCherry-FKBP-TPD54 rerouting. The mitochondrial and cytoplasmic signal of mCherry-FKBP-TPD54 as a function of time after the addition of 200 nM rapamycin at 10 s. Line and shaded area show the mean ± SEM, ncell = 16. (C) Still images from a TPD54 rerouting video. Time, minutes and seconds (rapamycin at 0:10). Insets, 2× zoom. Scale bars, 10 µm, 1 µm (inset).
Figure 5.
Figure 5.
Capture of small vesicles by rerouting TPD54 to mitochondria. (A) Fluorescence microscopy images of mCherry-FKBP-TPD54 in HeLa cells. Cells expressing mCherry-FKBP-TPD54 and dark MitoTrap were fixed after no rapamycin application (Ctrl) or after 20 s, 5 min, or 30 min of rapamycin addition (200 nM). The pictured cell was then imaged by EM. Scale bar, 10 µm. (B) Sample electron micrographs of the cells shown in A. Insets, 3× zoom. Scale bars, 200 nm, 50 nm (insets). (C) Segmented view of mitochondria (gray) and vesicles (purple) in the images shown in B. (D) Profiles of segmented vesicles from electron micrographs. All vesicles segmented from the control dataset are shown with a random sample from the treatment groups as a comparison. The sample size is in proportion to the capture of vesicles at the mitochondria (34, 320, 594, and 1,347 for control, 20 s, 5 min, and 30 min, respectively). (E) Left: violin plot to show the diameter of vesicles imaged in each dataset. Spots represent individual vesicles. Marker shows the median. Center: box plot to show the number of vesicles captured per 1 µm of mitochondrial membrane. Spots show the number per micrograph in each dataset. Boxes show the interquartile range and median, and whiskers show 9th and 91st percentiles. Right: violin plot to show the fraction of mitochondrial membrane that is decorated with vesicles. Spots show individual mitochondria from the dataset. Time, minutes and seconds. See Materials and methods for details.
Figure 6.
Figure 6.
Visualizing INVs by light microscopy. (A) Single ROIs from live-cell imaging experiments with cells expressing GFP or GFP-TPD54 (overexpressed [OE]), or with knock-in GFP-TPD54 cells (endo). Images are pseudocolored to highlight subresolution structures. Scale bar, 1 µm. (B) Scatter dot plot to show the mean variance per pixel over time. Dots, individual cells; black bars, mean ± SD. The mean ± SD for GFP is indicated as a thin black line and gray zone. ncell = 16–20. (C) TIRF image showing the ventral surface of a typical GFP-TPD54 knock-in HeLa cell imaged by STORM. Scale bar, 10 µm. (D) Expanded view of the boxed region in C. Scale bar, 500 nm. (E) STORM image of the corresponding region shown in D. Localizations are pseudocolored as indicated; max value in image was 79. Scale bar, 500 nm. (F) Histogram of FWHM values of all spots in the entire localizations image for the cell shown in C. (G) Summary of median FWHM values. Bars, mean ± SD. ncell = 5, nexp = 3.
Figure S4.
Figure S4.
FRAP analysis of GFP-TPD54. (A) FRAP data for GFP-TPD54 in knock-in cells (endo), expressed GFP, or GFP-TPD54 in parental cells. Lines and shaded areas show mean ± 1 SD. Dashed line shows a double-exponential function fitted to the average data. The fit coefficients are summarized in D. Inset: FRAP data from different cells colored as indicated and displayed on the same axes range. (B) Recovery (mobile fraction) of individual fits to FRAP data plotted against t1/2. Inset: initial cellular fluorescence as a function of t1/2. (C) Plot to show FRAP kinetics in individual cells. τslow is plotted against τfast, and marker size indicates the fraction recovered by the slow process. Markers represent individual cells, and colors indicate the protein being imaged. (D) Kinetics of FRAP. FRAP kinetics were much slower for GFP-TPD54 (either expressed or endogenous) compared with GFP, suggesting GFP-TPD54 is bound to membranes. There were two phases of GFP-TPD54 recovery: a small, fast process (τ = 2 s) with the majority of recovery via a slow process, which was in the order of tens of seconds. These kinetics were consistent with the majority of TPD54 binding to subcellular structures, with a minor fraction being cytosolic. Analysis of individual FRAP traces showed that in cells expressing higher levels of GFP-TPD54, FRAP was faster and that this was due to a larger fraction recovering via the fast process. This is consistent with overexpression saturating the membrane-bound population and causing some TPD54 to be cytosolic. Note that the kinetics of TPD54 rerouting were best described as a single process (τ = ~40 s), presumably corresponding to vesicle capture, with no detectable faster component that would suggest a diffusible pool of TPD54 in the cytosol.
Figure 7.
Figure 7.
TPD54 co-reroutes dileucine motif-containing receptors only. (A) Representative widefield micrographs of cells coexpressing mCherry-FKBP-TPD54, dark MitoTrap, and the indicated CD8 construct. Rerouting was induced by 200 nM rapamycin. Cells were fixed, permeabilized, and stained for total CD8. (B) Representative widefield micrographs showing co-rerouting of endogenous CIMPR detected by immunofluorescence with rerouting of mCherry-FKBP-TPD54 to dark MitoTrap by addition of 200 nM rapamycin. (C) Pulse label and timed vesicle capture experiments. Cells expressing CD8-EAAALL were surface labeled with Alexa Fluor 488–conjugated anti-CD8 antibodies for 30 min, then incubated at 37°C for the indicated time (minutes), treated with 200 nM rapamycin for 5 min, and fixed. (D) Representative widefield micrographs from a pulse label and timed vesicle capture experiment. Inset, 5× zoom. Scale bars, 10 µm, 1 µm (insets). Time, hours and minutes.
Figure 8.
Figure 8.
Co-rerouting of R-SNARES, but not Q-SNARES, with TPD54. Representative confocal micrographs showing the co-rerouting of SNAREs as indicated after TPD54 rerouting to mitochondria. SNAREs were detected by immunofluorescence, with the exception of VAMP2, which is coexpressed as GFP-VAMP2 (widefield image). Insets, 3× zoom. Scale bars, 10 µm, 1 µm (insets).
Figure 9.
Figure 9.
A screen to identify Rab GTPases that are associated with TPD54. (A) Quantification of the change in mitochondrial fluorescence intensity of GFP or GFP-Rabs 2 min after rerouting of mCherry-FKBP-TPD54 to dark MitoTrap with 200 nM rapamycin. Multiple independent experiments were completed (dots) across three independent trials. Black bars, mean ± SD. The mean ± SD for GFP (control) is also shown as a black line and gray zone, down the plot. Dunnett’s post-hoc test was done for each trial using GFP as a control. Colors indicate if P < 0.05 in one, two, or three trials, or only when all the data were pooled. ncell = 17–36, nexp = 3. (B) Effect size and bootstrap 95% confidence interval of the data in A. (C) The plot in B is reordered to show Rabs ranked in order of highest to lowest effect size. (D) Small multiple plots show the correlation between the mCherry-FKBP-TPD54 rerouting and GFP-Rabs co-rerouting (gray dots), a line fit to the data (black), and a y = x correlation (white).
Figure S5.
Figure S5.
Co-rerouting of Rab GTPases and TPD54 to mitochondria. (A) Representative micrographs showing the co-rerouting of GFP-Rab14, but not GFP or GFP-Rab9a, after rerouting of mCherry-FKBP-TPD54 to dark Mitotrap by addition of 200 nM rapamycin. Note that GFP-Rab14 localization is unaffected by rerouting of mCherry-FKBP. (B) Representative micrographs showing the co-rerouting of Rab1a detected by immunofluorescence after rerouting of mCherry-FKBP-TPD54 to dark Mitotrap by addition of 200 nM rapamycin. (C) Two positive hits (Rab11a and Rab25) and a negative Rab (Rab7a) were tested for TPD54 co-rerouting. Micrographs of cells before and after rerouting the indicated GFP-FKBP-Rab to dark MitoTrap in cells also expressing mCherry-TPD54. Insets, 3× zoom. Scale bars, 10 µm, 1 µm (insets). POI, proteins of interest.
Figure 10.
Figure 10.
Cellular localization of INVs. Schematic diagram showing the cellular pathways on which the Rab GTPases operate. Rabs are represented by their number. Red and gray numbers indicate positive and negative Rab hits, respectively. Red and black arrows indicate pathways that involve a Rab that is a positive hit or where only negative hits were found, respectively. INVs are shown as purple vesicles peppered throughout most, but not all, of the network. The inset summarizes the three types of protein found on INVs that were tested in the present study.

References

    1. Balch W.E., McCaffery J.M., Plutner H., and Farquhar M.G.. 1994. Vesicular stomatitis virus glycoprotein is sorted and concentrated during export from the endoplasmic reticulum. Cell. 76:841–852. 10.1016/0092-8674(94)90359-X - DOI - PubMed
    1. Biesemann C., Grønborg M., Luquet E., Wichert S.P., Bernard V., Bungers S.R., Cooper B., Varoqueaux F., Li L., Byrne J.A., et al. . 2014. Proteomic screening of glutamatergic mouse brain synaptosomes isolated by fluorescence activated sorting. EMBO J. 33:157–170. 10.1002/embj.201386120 - DOI - PMC - PubMed
    1. Boncompain G., Divoux S., Gareil N., de Forges H., Lescure A., Latreche L., Mercanti V., Jollivet F., Raposo G., and Perez F.. 2012. Synchronization of secretory protein traffic in populations of cells. Nat. Methods. 9:493–498. 10.1038/nmeth.1928 - DOI - PubMed
    1. Bonifacino J.S., and Traub L.M.. 2003. Signals for sorting of transmembrane proteins to endosomes and lysosomes. Annu. Rev. Biochem. 72:395–447. 10.1146/annurev.biochem.72.121801.161800 - DOI - PubMed
    1. Bucci C., Lütcke A., Steele-Mortimer O., Olkkonen V.M., Dupree P., Chiariello M., Bruni C.B., Simons K., and Zerial M.. 1995. Co-operative regulation of endocytosis by three Rab5 isoforms. FEBS Lett. 366:65–71. 10.1016/0014-5793(95)00477-Q - DOI - PubMed

Publication types