

Varying Association of Extended Hours Dialysis with Quality of Life
- PMID: 31672793
- PMCID: PMC6895496
- DOI: 10.2215/CJN.06800619
Varying Association of Extended Hours Dialysis with Quality of Life
Abstract
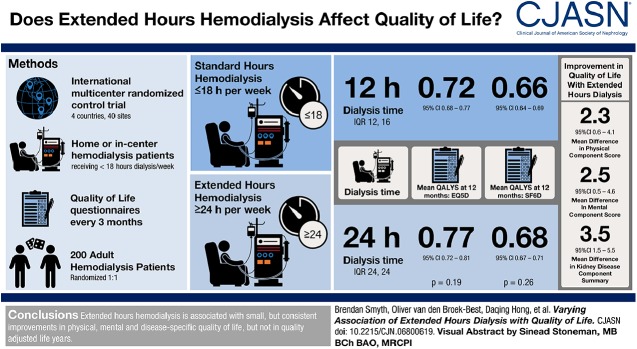
Background and objectives: Little is known about the effect of changes in dialysis hours on patient-reported outcome measures. We report the effect of doubling dialysis hours on a range of patient-reported outcome measures in a randomized trial, overall and separately for important subgroups.
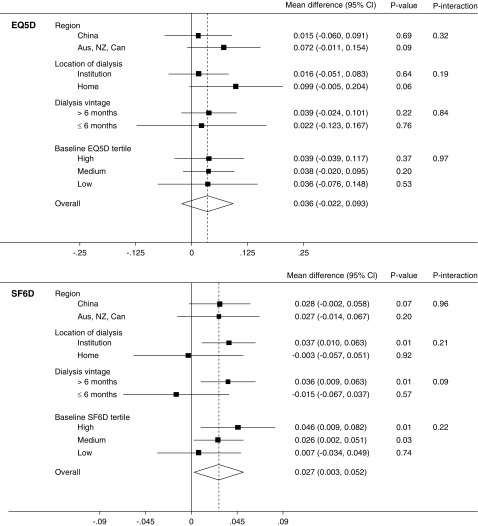
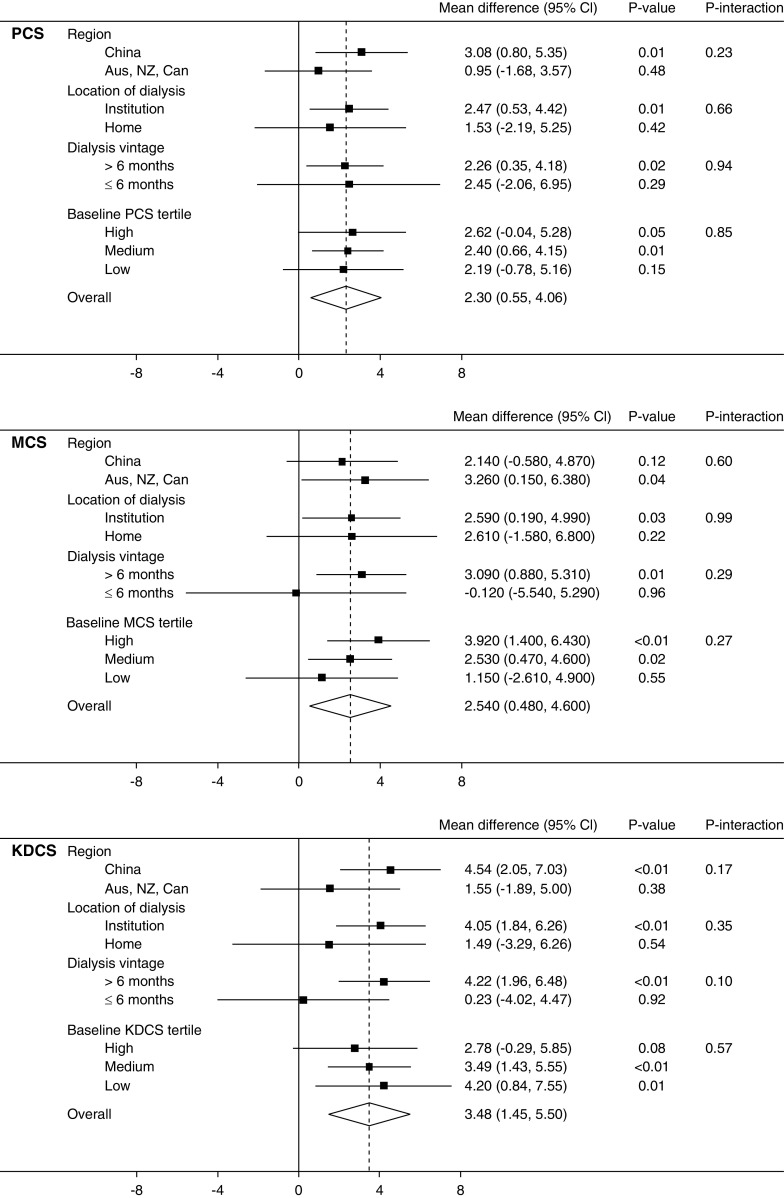
Design, setting, participants, & measurements: The A Clinical Trial of IntensiVE Dialysis trial randomized 200 participants to extended or standard weekly hours hemodialysis for 12 months. Patient-reported outcome measures included two health utility scores (EuroQOL-5 Dimensions-3 Level, Short Form-6 Dimension) and their derived quality-adjusted life year estimates, two generic health scores (Short Form-36 Physical Component Summary, Mental Component Summary), and a disease-specific score (Kidney Disease Component Score). Outcomes were assessed as the mean difference from baseline using linear mixed effects models adjusted for time point and baseline score, with interaction terms added for subgroup analyses. Prespecified subgroups were dialysis location (home- versus institution-based), dialysis vintage (≤6 months versus >6 months), region (China versus Australia, New Zealand, Canada), and baseline score (lowest, middle, highest tertile). Multiplicity-adjusted P values (Holm-Bonferroni) were calculated for the main analyses.
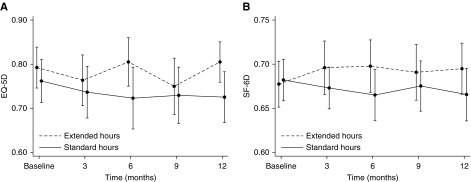
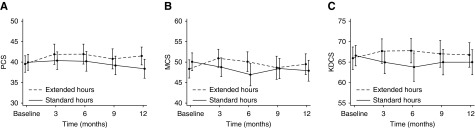
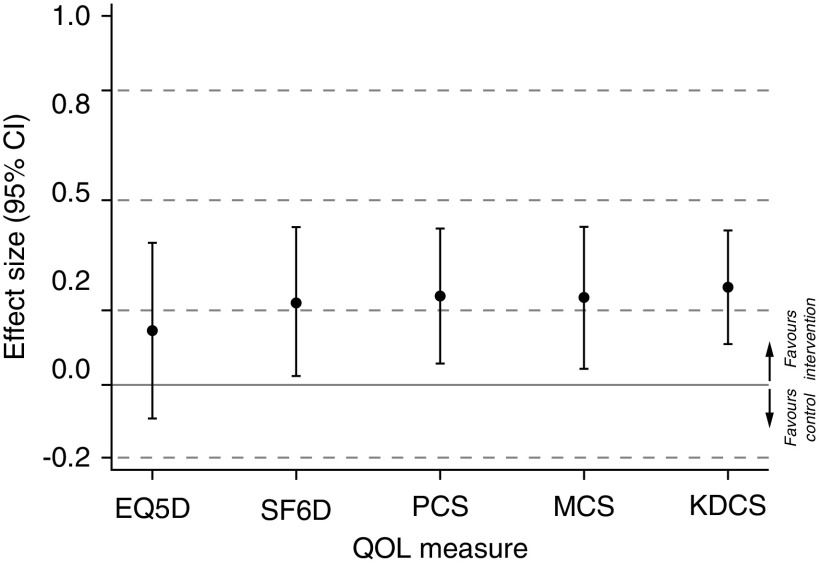
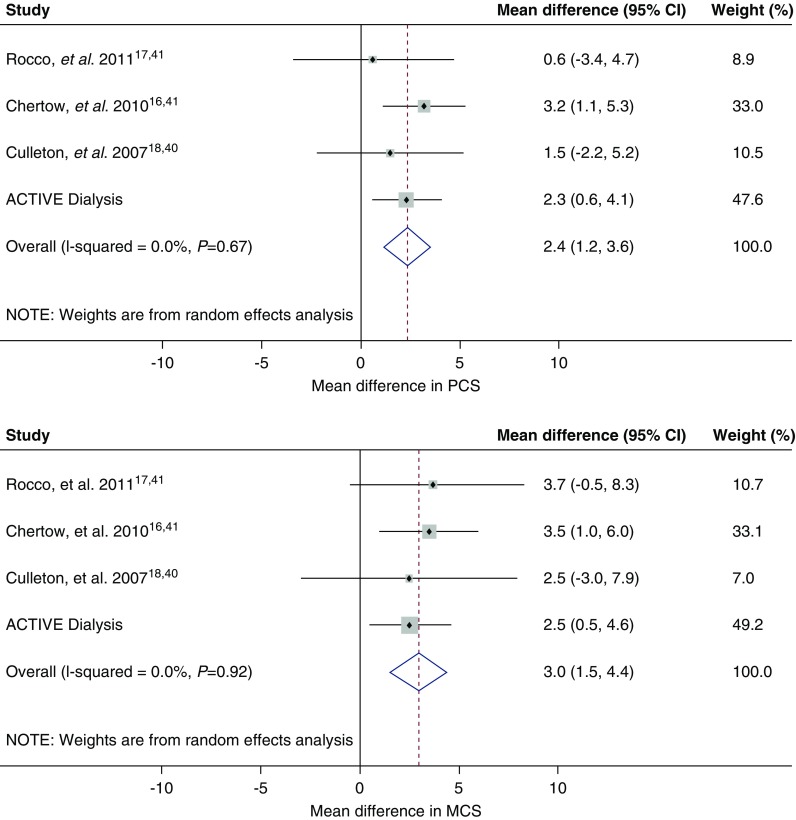
Results: Extended dialysis hours was associated with improvement in Short Form-6 Dimension (mean difference, 0.027; 95% confidence interval [95% CI], 0.00 to 0.05; P=0.03) which was not significant after adjustment for multiple comparisons (Padjusted =0.05). There were no significant differences in EuroQOL-5 Dimensions-3 Level health utility (mean difference, 0.036; 95% CI, -0.02 to 0.09; P=0.2; Padjusted =0.2) or in quality-adjusted life years. There were small positive differences in generic and disease-specific quality of life: Physical Component Summary (mean difference, 2.3; 95% CI, 0.6 to 4.1; P=0.01; Padjusted =0.04), Mental Component Summary (mean difference, 2.5; 95% CI, 0.5 to 4.6; P=0.02; Padjusted =0.05) and Kidney Disease Component Score (mean difference, 3.5; 95% CI, 1.5 to 5.5; P=0.001; Padjusted =0.005). The results did not differ among predefined subgroups or by baseline score.
Conclusions: The effect of extended hours hemodialysis on patient-reported outcome measures reached statistical significance in some but not all measures. Within each measure the effect was consistent across predefined subgroups. The clinical importance of these differences is unclear.
Keywords: Australia; Canada; China; New Zealand; chronic hemodialysis; confidence intervals; home hemodialysis; humans; kidney; kidney diseases; patient reported outcome measures; quality of life; quality-adjusted life years; randomized controlled trials; renal dialysis.
Copyright © 2019 by the American Society of Nephrology.
Figures
Comment in
-
How Extended Hemodialysis Treatment Time Can Affect Patient Quality of Life.Clin J Am Soc Nephrol. 2019 Dec 6;14(12):1687-1689. doi: 10.2215/CJN.12241019. Epub 2019 Oct 31. Clin J Am Soc Nephrol. 2019. PMID: 31672796 Free PMC article. No abstract available.
Similar articles
-
Effect of extended hours dialysis on sleep quality in a randomized trial.Nephrology (Carlton). 2019 Apr;24(4):430-437. doi: 10.1111/nep.13236. Nephrology (Carlton). 2019. PMID: 29424935 Clinical Trial.
-
A Trial of Extending Hemodialysis Hours and Quality of Life.J Am Soc Nephrol. 2017 Jun;28(6):1898-1911. doi: 10.1681/ASN.2015111225. Epub 2017 Feb 1. J Am Soc Nephrol. 2017. PMID: 28151412 Free PMC article. Clinical Trial.
-
Exercise programme to improve quality of life for patients with end-stage kidney disease receiving haemodialysis: the PEDAL RCT.Health Technol Assess. 2021 Jun;25(40):1-52. doi: 10.3310/hta25400. Health Technol Assess. 2021. PMID: 34156335 Free PMC article. Clinical Trial.
-
Comparisons of quality of life between patients underwent peritoneal dialysis and hemodialysis: a systematic review and meta-analysis.Health Qual Life Outcomes. 2020 Jun 18;18(1):191. doi: 10.1186/s12955-020-01449-2. Health Qual Life Outcomes. 2020. PMID: 32552800 Free PMC article.
-
Psychosocial interventions for preventing and treating depression in dialysis patients.Cochrane Database Syst Rev. 2019 Dec 2;12(12):CD004542. doi: 10.1002/14651858.CD004542.pub3. Cochrane Database Syst Rev. 2019. PMID: 31789430 Free PMC article.
Cited by
-
Relationship Between Standardized Measures of Chronic Kidney Disease-associated Pruritus Intensity and Health-related Quality of Life Measured with the EQ-5D Questionnaire: A Mapping Study.Acta Derm Venereol. 2023 Sep 20;103:adv11604. doi: 10.2340/actadv.v103.11604. Acta Derm Venereol. 2023. PMID: 37731210 Free PMC article.
-
A Comparison of Patient-Reported Outcome Measures of Quality of Life By Dialysis Modality in the Treatment of Kidney Failure: A Systematic Review.Can J Kidney Health Dis. 2020 Oct 19;7:2054358120957431. doi: 10.1177/2054358120957431. eCollection 2020. Can J Kidney Health Dis. 2020. PMID: 33149924 Free PMC article. Review.
-
Impact of Difelikefalin on the Health-Related Quality of Life of Haemodialysis Patients with Moderate-To-Severe Chronic Kidney Disease-Associated Pruritus: A Single-Arm Intervention Trial.Patient. 2024 Mar;17(2):203-213. doi: 10.1007/s40271-023-00668-1. Epub 2024 Jan 9. Patient. 2024. PMID: 38196014 Free PMC article. Clinical Trial.
-
How Extended Hemodialysis Treatment Time Can Affect Patient Quality of Life.Clin J Am Soc Nephrol. 2019 Dec 6;14(12):1687-1689. doi: 10.2215/CJN.12241019. Epub 2019 Oct 31. Clin J Am Soc Nephrol. 2019. PMID: 31672796 Free PMC article. No abstract available.
-
Patient-centeredness and the Pareto principle: getting at the matter of what matters to our patients.Nephrol Dial Transplant. 2020 Oct 1;35(10):1647-1648. doi: 10.1093/ndt/gfaa052. Nephrol Dial Transplant. 2020. PMID: 32437539 Free PMC article. No abstract available.
References
-
- United States Renal Data System: 2015 Annual Data Report: Epidemiology of Kidney Disease in the United States, 2015, Bethesda, MD, National Institutes of Health, National Institute of Diabetes and Digestive and Kidney Diseases. Available at: http://www.usrds.org/adr.aspx. Accessed June 11, 2019
-
- Kimmel PL, Patel SS: Quality of life in patients with chronic kidney disease: Focus on end-stage renal disease treated with hemodialysis. Semin Nephrol 26: 68–79, 2006 - PubMed
-
- Sexton DJ, Lowney AC, O’Seaghdha CM, Murphy M, O’Brien T, Casserly LF, McQuillan R, Plant WD, Eustace JA, Kinsella SM, Conlon PJ: Do patient-reported measures of symptoms and health status predict mortality in hemodialysis? An assessment of POS-S Renal and EQ-5D. Hemodial Int 20: 618–630, 2016 - PubMed
Publication types
MeSH terms
LinkOut - more resources
Full Text Sources
Medical
