. 2019 Nov 1;4(21):e125688.
doi: 10.1172/jci.insight.125688.

NK cell defects in X-linked pigmentary reticulate disorder

Affiliations

NK cell defects in X-linked pigmentary reticulate disorder

Petro Starokadomskyy et al. JCI Insight. .

Abstract

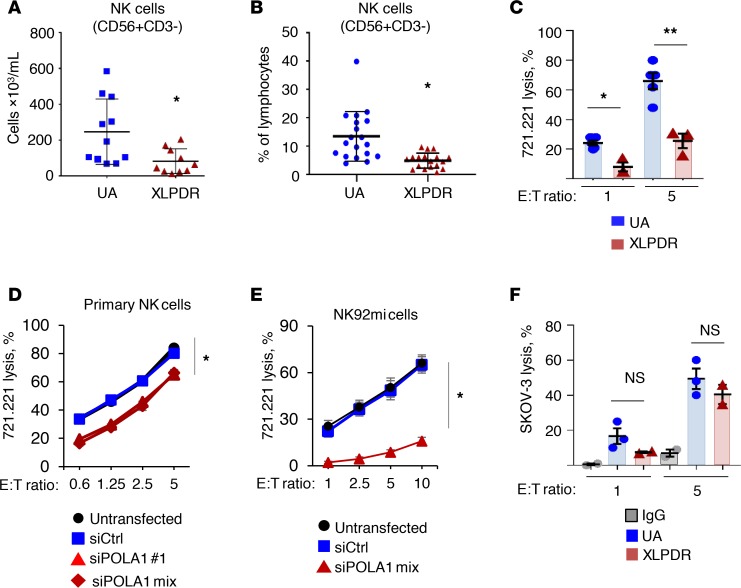
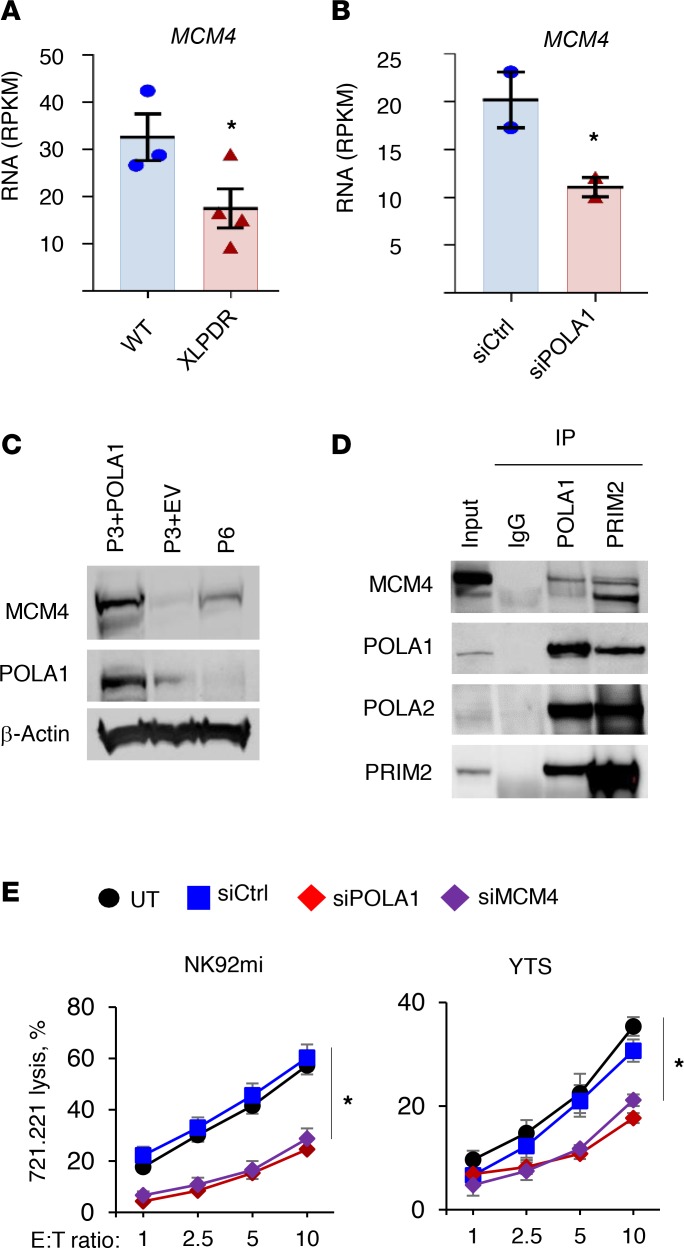
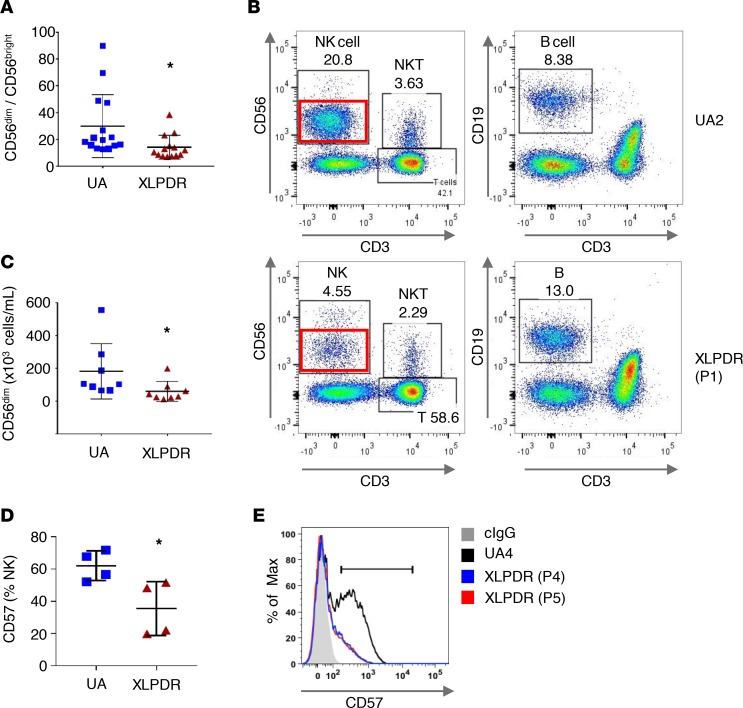
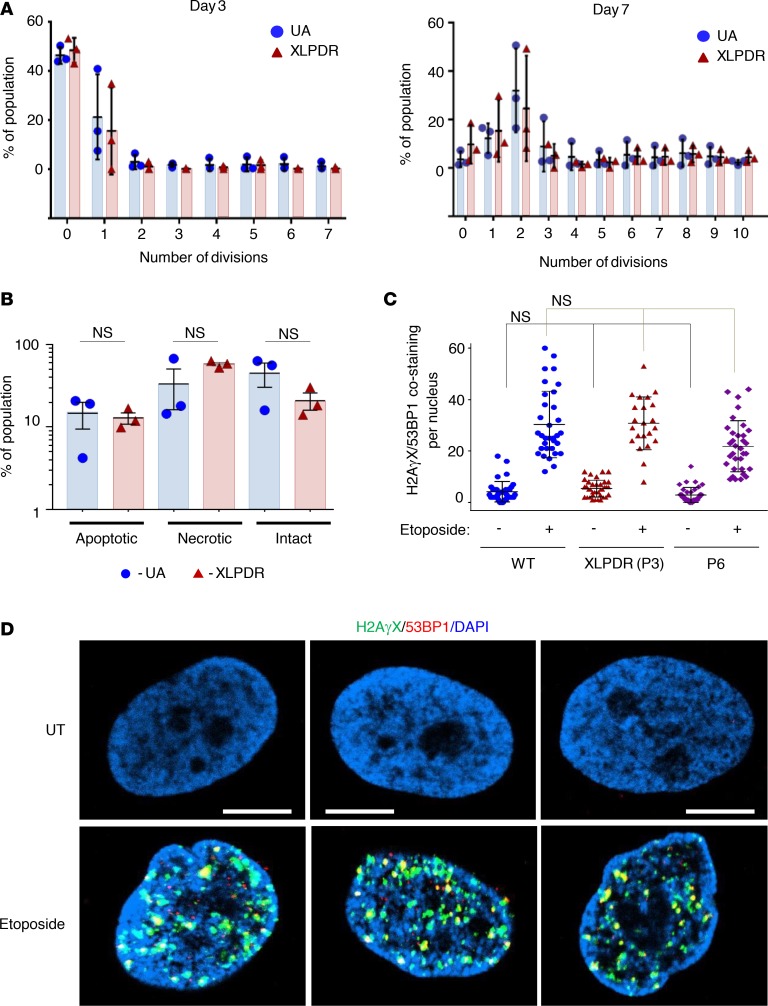
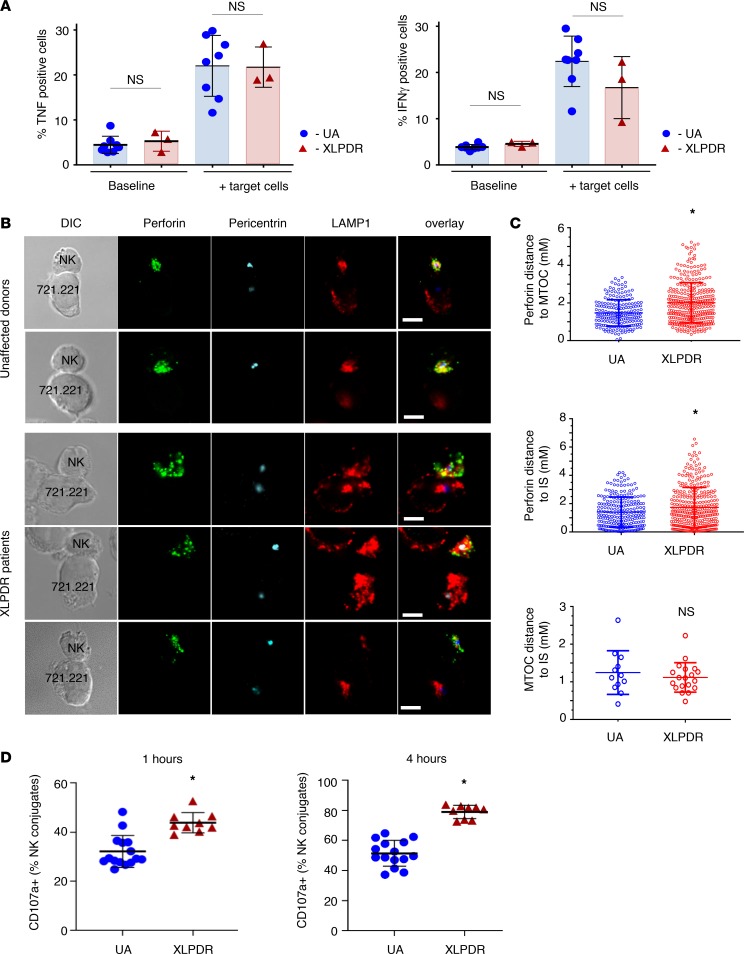
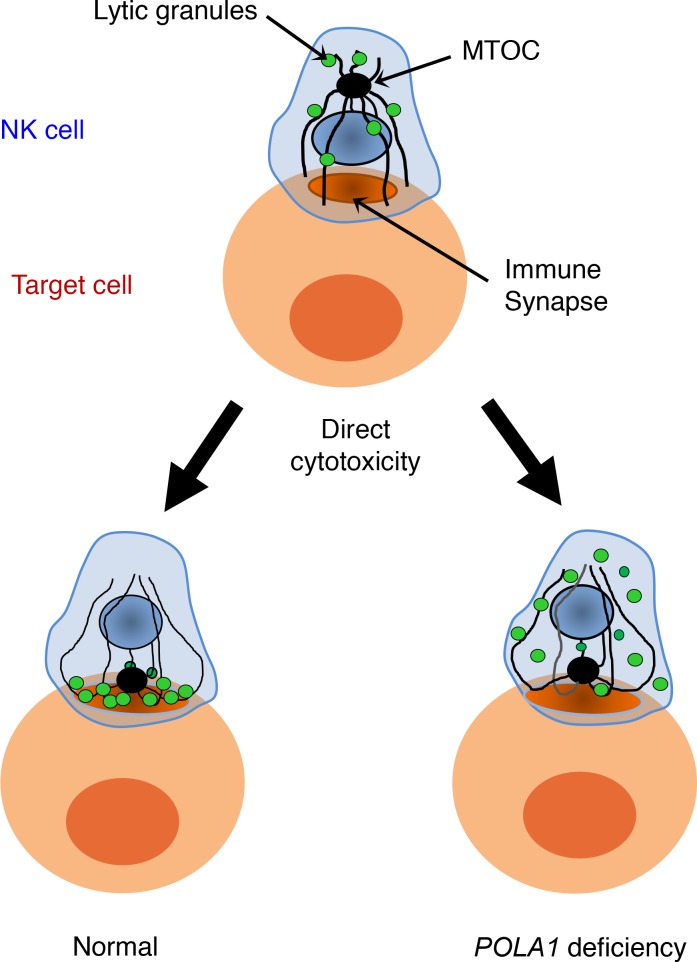
X-linked reticulate pigmentary disorder (XLPDR, Mendelian Inheritance in Man #301220) is a rare syndrome characterized by recurrent infections and sterile multiorgan inflammation. The syndrome is caused by an intronic mutation in POLA1, the gene encoding the catalytic subunit of DNA polymerase-α (Pol-α), which is responsible for Okazaki fragment synthesis during DNA replication. Reduced POLA1 expression in this condition triggers spontaneous type I interferon expression, which can be linked to the autoinflammatory manifestations of the disease. However, the history of recurrent infections in this syndrome is as yet unexplained. Here we report that patients with XLPDR have reduced NK cell cytotoxic activity and decreased numbers of NK cells, particularly differentiated, stage V, cells (CD3-CD56dim). This phenotype is reminiscent of hypomorphic mutations in MCM4, which encodes a component of the minichromosome maintenance (MCM) helicase complex that is functionally linked to Pol-α during the DNA replication process. We find that POLA1 deficiency leads to MCM4 depletion and that both can impair NK cell natural cytotoxicity and show that this is due to a defect in lytic granule polarization. Altogether, our study provides mechanistic connections between Pol-α and the MCM complex and demonstrates their relevance in NK cell function.

Keywords: Infectious disease; Inflammation; Innate immunity; Monogenic diseases; NK cells.


Conflict of interest statement

Conflict of interest: The authors have declared that no conflict of interest exists.

Figures

Figure 1
Figure 1. NK cell direct cytotoxicity is affected in XLPDR patients.
(A) Flow cytometry quantification of NK cells per milliliter in peripheral blood of XLPDR patients (P1–P5) and unaffected individuals (UA4–UA11). Horizontal bars represent the mean; error bars represent the SD. *P < 0.015, Student’s 2-tailed t test. Data are the aggregate from up to 3 independent measurements. (B) Flow cytometry quantification of NK cells in peripheral blood as a percentage of total lymphocytes. P1–P5 and UA1–UA12 are represented. Horizontal bars represent the mean; error bars represent the SD. *P < 0.0005, Student’s 2-tailed t test. Data are the aggregate of 7 independent measurements spanning up to 8 years. (C) NK cell direct cytotoxicity against 721.221 target cells was assessed using NK cells from unaffected controls (UA1, UA2, UA13) or XLDPR patients (P1 and P2), using effector/target (E/T) ratios of 1 and 5. Bars represent the mean; error bars represent the SEM. *P < 0.0065, and **P < 0.0001 by 2-way ANOVA. Data are the aggregate of 2 independent experiments. (D) NK cell direct cytotoxicity against the 721.221 target cell line was determined over the indicated E/T ratios. Primary NK cells obtained from 5 healthy donors (UA14–UA18) were subjected to POLA1 silencing using 2 siRNA duplexes or a pool of them. The data are representative of 2 independent experiments; error bars represent the SEM. *P < 0.0001 by 2-factor ANOVA comparing siPOLA1 samples against controls. Data are the aggregate of 5 independent experiments. (E) Same as D but using the tumor-derived NK cell line NK92mi. The data are representative of 3 independent experiments; error bars represent the SEM. *P < 0.0001 by 2-way ANOVA comparing siPOLA1 mix against control samples. Data are representative of 2 independent experiments. (F) Antibody-dependent cell cytotoxicity (ADCC) of NK cells from unaffected controls (UA8–UA10) and XLPDR patients (P1 and P2). SKOV-3 ovarian cancer cells treated with anti–human epidermal growth factor receptor 2 (anti-HER2) antibodies were used as the target cell line; cells incubated with control antibody (IgG) were used as a negative control. Bars represent the mean; error bars represent the SEM. NS, nonsignificant; P > 0.1 by 2-factor ANOVA comparing UA to XLPDR groups. Data are from a single experiment.
Figure 2
Figure 2. Pol-α/primase and the MCM complex are required for optimal NK cell function.
(A) Expression of MCM4 as determined by RNA-Seq analysis in unaffected (UA1) and XLPDR-derived immortalized dermal fibroblasts (XLPDR, P2 and P3). Bars represent the mean; error bars represent the SEM; *P < 0.05 by Student’s 1-tailed t test. Data are the average of 3 independent experiments. RPKM, reads per kilobase of transcript per million mapped reads. (B) Same as A, but comparing MCM4 expression in UA1 fibroblasts treated with siCtrl or siPOLA1. Bars represent the mean; error bars represent the SEM. *P < 0.05 by Student’s 1-tailed t test. Data are the average of 2 independent experiments. (C) Expression of the indicated proteins was determined by immunoblotting in immortalized dermal fibroblasts derived from an XLPDR patient (P3 + EV), isogenic “rescued” control line (P3 + POLA1), and a patient (P6) with a recently reported POLA1 mutation (c.328G>A). The Western blot is representative of 2 independent experiments. (D) HEK293T cell lysate was subjected to POLA1 or PRIM2 immunoprecipitation and then immunoblotted for MCM4. Nonspecific control antibody (IgG) was used as a negative control. The Western blot is representative of 2 independent experiments. (E) NK cell lines NK29mi (left) and YTS (right) were subjected to POLA1 or MCM4 silencing using corresponding siRNA. NK cell direct cytotoxicity against the 721.221 target cell line was determined over the indicated E/T ratios. Data represent the average of 3 experiments. Error bars represent the SEM. *P < 0.0001 by 2-way ANOVA comparing siPOLA1 or siMCM4 against siCtrl in each E/T ratio. Data are from a single experiment.
Figure 3
Figure 3. POLA1 deficiency affects NK cell maturation and direct cytotoxicity.
(A) Flow cytometry quantification of the CD56dim/CD56bright ratio in peripheral NK cells is significantly affected in XLPDR patients (P1–P5) compared with unaffected control (UA1–UA7, UA10, UA11). Horizontal bars represent the mean; error bars correspond to the SD; *P < 0.02 by Student’s 2-tailed t test. Data are the aggregate of 5 independent experiments. (B) Representative flow cytometry plots of white blood cell subpopulations in an unaffected individual (UA2) and an XLPDR patient (P1). CD56dim (stage V) NK cell subsets are highlighted by red rectangles. (C) Flow cytometry–based quantification of stage V CD56dim NK cells in unaffected individuals (UA4–UA7, U10, UA11) and XLPDR patients (P1–P5). Horizontal bars represent the mean; error bars correspond to the SD; *P < 0.04 by Student’s 1-tailed t test. Data are the aggregate of 2 independent experiments. (D) Flow cytometry–based quantification of stage VI CD57+ NK cells in unaffected individuals (UA1–UA4) and XLPDR patients (P1, P2, P4, P5). Horizontal bars represent the mean; error bars correspond to the SD; *P < 0.03 by Student’s 2-tailed t test. Data are the representative image of 3 independent experiments. (E) FACS analysis of CD56+CD3 NK cells depicting representative CD57 surface expression in an XLPDR proband (P4, P5) compared with an unaffected control (UA4).
Figure 4
Figure 4. POLA1 does not affect cell cycle progression and DNA integrity.
(A) Flow cytometry analysis of NK cell proliferation (based on CFSE dilution) was performed on days 3 and 7 in NK cells isolated from unaffected individuals (UA4, UA5, UA8) and from XLPDR probands (P1, P2, P3). Error bars represent the SEM. XLPDR and UA groups are not different at every division number (P > 0.05 by 2-way ANOVA). Data are representative of 2 independent experiments. (B) Flow cytometry analysis of apoptosis and necrosis (based on annexin V staining) was performed on day 14 in proliferating NK cells as above. Data are the result of 1 experiment. Black bars indicate the mean and error bars represent the SD. (P > 0.05 by 2-way ANOVA.) (C) Quantification of the number of DNA-damaging events per nucleus (colocalized H2AγX and 53BP1 foci) is presented. Each dot represents a cell in each group. Bars correspond to the group average, and error bars correspond to the SD. NS, nonsignificant when compared to its corresponding control (P > 0.05 by 2-way ANOVA). (D) Representative images of DNA damage foci assessed by immunofluorescence staining and confocal microscopy imaging for nuclear H2AγX and 53BP1. Dermal fibroblasts from an XLPDR patient that were rescued for POLA1 expression (P3 + POLA1) were compared to an isogenic control line (P3 + EV) and to fibroblasts from P6. Staining at baseline and after etoposide treatment (1 μM, 5 hours) is shown. Scale bar: 2 μm. Representative images were derived from 2 independent experiments.
Figure 5
Figure 5. POLA1 deficiency affects polarization of lytic granules in activated NK cells.
(A) Flow cytometry analysis of TNF (left) and IFN-γ (right) expression in NK cells, derived from unaffected control individuals (UA1–UA3) and XLPDR patients (P1, P2). Data are derived from 1 experiment; error bars correspond to the SD. NS, nonsignificant (P > 0.05, 2-way ANOVA). (B) Lytic granule and MTOC complex mobilization in NK cells was examined by immunofluorescence staining and confocal microscopy after activation with 721.221 target cells. Perforin (green), pericentrin (MTOC marker; blue), and LAMP1 (red) are depicted. The dashed lines indicate the position of the cell-cell contact site. Scale bars: 5 μm. Representative images of cells from healthy donors and patients with XLPDR are presented. (C) Quantification of confocal microscopy data from B. Distances from MTOC to perforin granules (top), perforin granules to the immunological synapse (center), and MTOC to the immunological synapse (bottom) are presented. Analysis was done using all available images from XLPDR NK cells (n = 19) and unaffected NK cells (n = 12). *P < 0.05; NS, not significant (P > 0.05), by 2-tailed Student’s t test. (D) LAMP1 degranulation in NK target conjugates. NK cells were derived from unaffected individuals (UA6, UA7, UA11, UA12) and XLPDR patients (P3–P5) and incubated for 1 or 4 hours with target 722.221 cells, and surface expression of CD107a was assessed by flow cytometry. Data are the representative image of 3 independent experiments. Horizontal bars represent the mean; error bars correspond to the SD; *P < 0.0001 by Student’s 2-tailed t test.
Figure 6
Figure 6. POLA1 deficiency affects cytotoxic granule polarization in NK cells.

Similar articles

Cited by

References

    1. et al. Familial cutaneous amyloidosis with systemic manifestations in males. Am J Med Genet. 1981;10(1):65–75. doi: 10.1002/ajmg.1320100109. - DOI - PubMed
    1. Partington MW, Prentice RS. X-linked cutaneous amyloidosis: further clinical and pathological observations. Am J Med Genet. 1989;32(1):115–119. doi: 10.1002/ajmg.1320320125. - DOI - PubMed
    1. Adès LC, Rogers M, Sillence DO. An X-linked reticulate pigmentary disorder with systemic manifestations: report of a second family. Pediatr Dermatol. 1993;10(4):344–351. doi: 10.1111/j.1525-1470.1993.tb00396.x. - DOI - PubMed
    1. Anderson RC, Zinn AR, Kim J, Carder KR. X-linked reticulate pigmentary disorder with systemic manifestations: report of a third family and literature review. Pediatr Dermatol. 2005;22(2):122–126. doi: 10.1111/j.1525-1470.2005.22206.x. - DOI - PubMed
    1. Fraile G, Norman F, Reguero ME, Defargues V, Redondo C. Cryptogenic multifocal ulcerous stenosing enteritis (CMUSE) in a man with a diagnosis of X-linked reticulate pigmentary disorder (PDR) Scand J Gastroenterol. 2008;43(4):506–510. doi: 10.1080/03014460701723912. - DOI - PubMed

Publication types

MeSH terms

Substances

Supplementary concepts