. 2019 Nov 1;4(21):e127312.
doi: 10.1172/jci.insight.127312.

TFEB activation in macrophages attenuates postmyocardial infarction ventricular dysfunction independently of ATG5-mediated autophagy

Affiliations

TFEB activation in macrophages attenuates postmyocardial infarction ventricular dysfunction independently of ATG5-mediated autophagy

Ali Javaheri et al. JCI Insight. .

Abstract

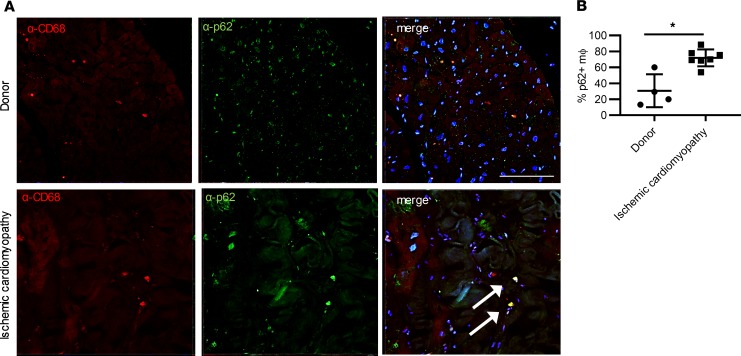
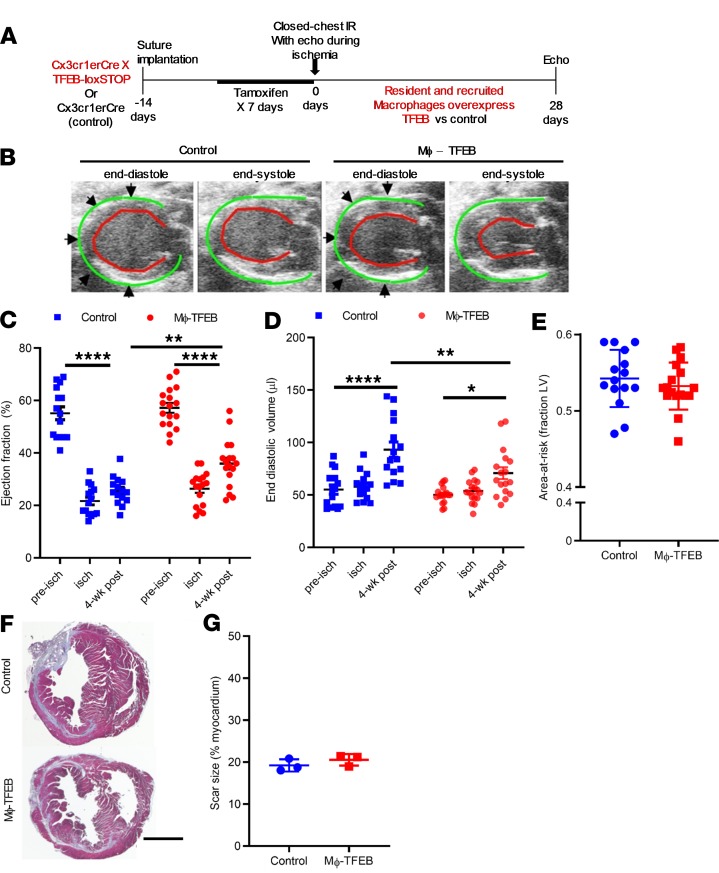
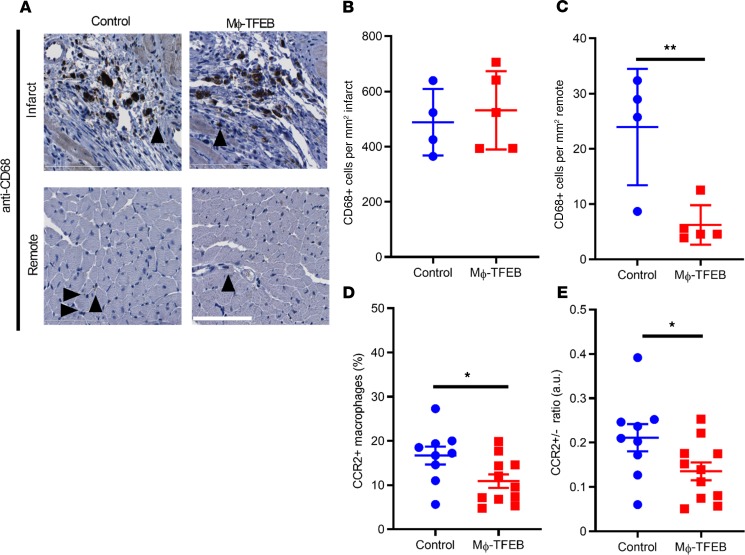
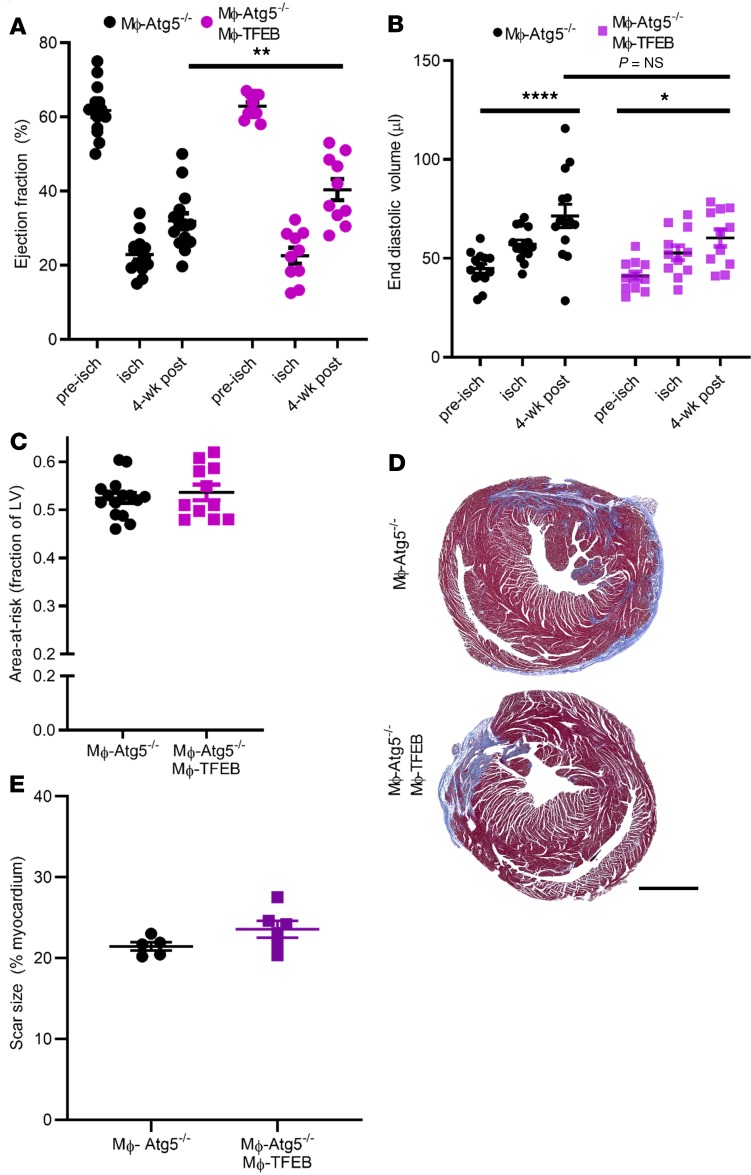
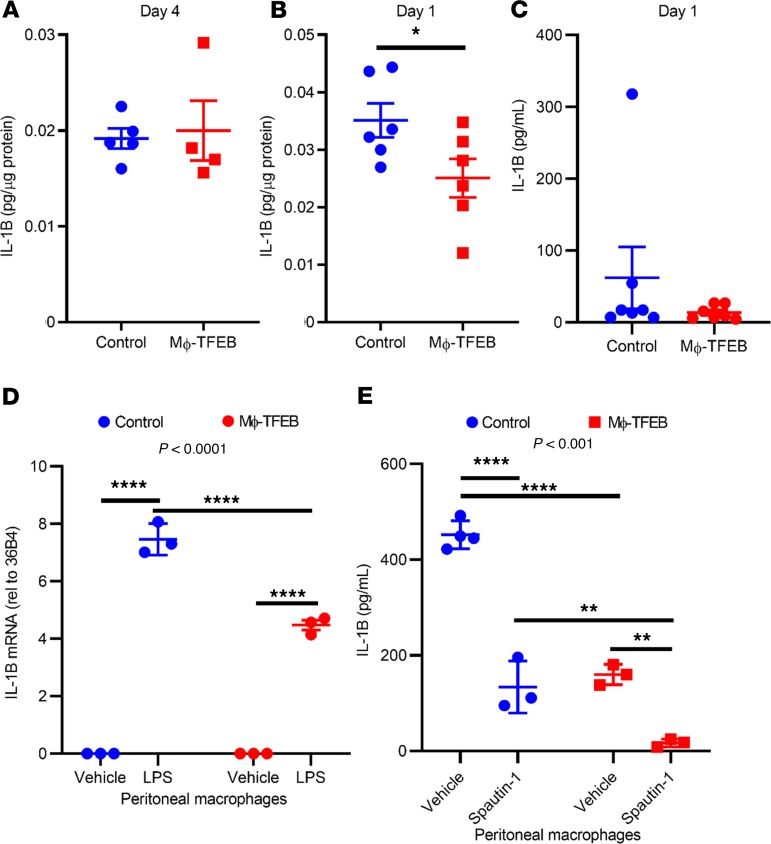
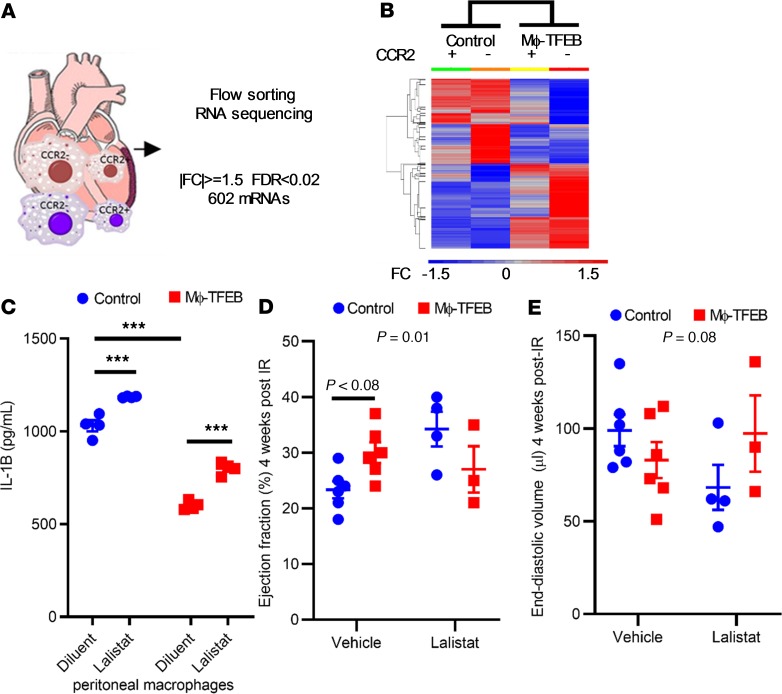
Lysosomes are at the epicenter of cellular processes critical for inflammasome activation in macrophages. Inflammasome activation and IL-1β secretion are implicated in myocardial infarction (MI) and resultant heart failure; however, little is known about how macrophage lysosomes regulate these processes. In mice subjected to cardiac ischemia/reperfusion (IR) injury and humans with ischemic cardiomyopathy, we observed evidence of lysosomal impairment in macrophages. Inducible macrophage-specific overexpression of transcription factor EB (TFEB), a master regulator of lysosome biogenesis (Mϕ-TFEB), attenuated postinfarction remodeling, decreased abundance of proinflammatory macrophages, and reduced levels of myocardial IL-1β compared with controls. Surprisingly, neither inflammasome suppression nor Mϕ-TFEB-mediated attenuation of postinfarction myocardial dysfunction required intact ATG5-dependent macroautophagy (hereafter termed "autophagy"). RNA-seq of flow-sorted macrophages postinfarction revealed that Mϕ-TFEB upregulated key targets involved in lysosomal lipid metabolism. Specifically, inhibition of the TFEB target, lysosomal acid lipase, in vivo abrogated the beneficial effect of Mϕ-TFEB on postinfarction ventricular function. Thus, TFEB reprograms macrophage lysosomal lipid metabolism to attenuate remodeling after IR, suggesting an alternative paradigm whereby lysosome function affects inflammation.

Keywords: Autophagy; Cardiology; Inflammation; Lysosomes; Macrophages.


Conflict of interest statement

Conflict of interest: The authors have declared that no conflict of interest exists.

Figures

Figure 1
Figure 1. Autophagy is altered in human cardiac macrophages in ischemic cardiomyopathy.
(A) Immunohistochemistry demonstrating anti-CD68 and anti-p62 in human hearts (donor versus ischemic cardiomyopathy). Arrows point to macrophages stained with CD68 expressing p62 by immunohistochemistry. Scale bar = 100 μm. (B) Quantification of staining in A. n = 4 Donor, n = 9 ischemic cardiomyopathy samples per group. *P < 0.05 by Mann-Whitney U test with individual data points, mean, and standard error shown in B.
Figure 2
Figure 2. Autophagy and lysosomal biogenesis are perturbed after cardiac ischemia/reperfusion injury.
(A) Flow-gating strategy to identify monocytes and macrophages in hearts from mice subject to sham or ischemia/reperfusion (IR) surgeries 4 days after IR. (B) Histogram depicting LysoTracker Red staining in monocytes and macrophages from sham versus day 4 hearts after IR. (C) Quantification of LysoTracker Red mean fluorescence intensity in macrophages versus monocytes at day 4. n = 4/group, Student’s t test. (D) Representative histogram of LC3-RFP signal intensity (x axis) 7 days after closed-chest IR or sham surgery. (E) Ratio of autophagosomes/autolysosomes in CCR2+ versus CCR2 macrophages after closed-chest IR or sham surgery. n = 3/group, 2-way ANOVA with multiple comparison (Tukey’s t test), with interaction P value shown on graph. Individual data points with mean and standard error are shown on each graph. *P < 0.05; **P < 0.01; ***P < 0.001; ****P < 0.0001.
Figure 3
Figure 3. Mϕ-TFEB attenuates ventricular dysfunction after ischemia/reperfusion.
(A) Schematic detailing closed-chest ischemia/reperfusion (IR) protocol in control versus Mϕ-TFEB mice. (B) Representative 2D-echocardiographic images from control versus Mϕ-TFEB 4 weeks after IR. Green lines highlight the epicardial border; red lines demarcate the endocardium. (C) Ejection fraction (%, y axis) in control versus Mϕ-TFEB prior to (pre-isch), during (isch), and 4 weeks after IR injury. Controls, n = 15; Mϕ-TFEB, n = 17. 2-way ANOVA with multiple comparisons (Tukey’s t test). (D) End diastolic volume in mice modeled as in B. (E) Area-at-risk (y axis) in mice modeled as in B. Student’s t test. (F and G) Representative Masson’s trichrome stained cardiac tissue (F) from control and Mϕ-TFEB hearts 4 weeks after IR, with quantification of scar size (G) and 2-way Student’s t test. Scale bar = 1 mm. n = 3/group. Individual data points with mean and standard error are shown on each graph. *P < 0.05; **P < 0.01; ****P < 0.0001
Figure 4
Figure 4. Mϕ-TFEB alters inflammatory cell composition after ischemia/reperfusion in the myocardium.
(A) Representative anti-CD68 stained (black arrows) image in infarcted and remote myocardium with hematoxylin counterstaining. Scale bar = 100 μm. (B and C) Quantification of CD68+ cells in infarct and remote myocardium in control versus Mϕ-TFEB mice 28 days after ischemia/reperfusion (IR). n = 4, control; n = 5 Mϕ-TFEB. (D) Percentage of CCR2+ macrophages assessed by flow cytometry 28 days after IR in control (n = 9) versus Mf-TFEB (n = 11) mice. (E) Ratio of CCR2+/CCR2 macrophages in control (n = 9) versus Mϕ-TFEB (n = 11) mice 28 days after IR. Individual data points with mean and standard error are shown on each graph. *P < 0.05; **P < 0.01 by Student’s t test.
Figure 5
Figure 5. ATG5-depenent autophagy is not required for attenuation of ventricular dysfunction after IR by Mϕ-TFEB.
(A) Ejection fraction (%, y axis) in Mϕ-Atg5–/– versus Mϕ-TFEB Atg5–/– prior to (pre-isch), during (isch), and 4 weeks after ischemia/reperfusion (IR) injury. n = 15 Mϕ-Atg5–/–; n = 11 Mϕ-Atg5–/– Mϕ-TFEB, 2-way ANOVA with multiple comparisons (Tukey’s t test). (B) End-diastolic volume in animals modeled as in A. (C) Area-at-risk (y axis) during ischemia from mice in A, Student’s t test. (D and E) Representative Masson’s trichrome stained cardiac tissue (D) and quantification of scar size (E) in Mϕ-Atg5–/– (n = 5) versus Mϕ-TFEB Atg5–/– (n = 6) 28 days after IR. Student’s t test. Scale bar = 1 mm. Individual data points with mean and SEM are shown on each graph. *P < 0.05; **P < 0.01; ****P < 0.0001
Figure 6
Figure 6. Mϕ-TFEB attenuates IL-1β secretion independent of autophagy.
(A and B) IL-1β myocardial protein levels at day 4 (A, n = 5 controls; n = 4 Mϕ-TFEB) and at day 1 (B, n = 6 controls; n = 6 Mϕ-TFEB) after ischemia/reperfusion (IR). (C) Serum IL-1β levels at day 1 after IR. n = 7/group, Student’s t test for AC. (D) IL-1β mRNA from peritoneal macrophages (pMACs) stimulated with LPS for 4 hours, n = 3/group, 2-way ANOVA with Tukey’s t test for multiple comparisons; interaction P value shown at top of graph. (E) IL-1β protein levels in supernatants from pMACs pretreated with diluent or Spautin-1 (10 μM) for 30 minutes followed by stimulation with LPS (2 hours) and ATP (30 minutes). n = 3–4 cell replicates/time point, 2-way ANOVA with Tukey’s t test for multiple comparisons and interaction P value shown on graph. For D and E only, representative data are shown with cellular replicates from cells isolated on a single day; all peritoneal macrophage experiments were repeated at minimum 3 times on separate days; individual data points with mean and standard error are shown on each graph. *P < 0.05; **P < 0.01; ***P < 0.001; ****P < 0.0001.
Figure 7
Figure 7. RNA-seq identifies lysosomal acid lipase as critical for Mϕ-TFEB in vivo effects.
(A) Diagram describing RNA-seq of flow-sorted macrophages 7 days after ischemia/reperfusion (IR). (B) Unbiased hierarchical clustering of mRNAs differentially expressed in Mϕ-TFEB versus control cardiac macrophages. n = 4–5 mice/group. (C) Lysosomal acid lipase (LAL) inhibition increases IL-1β secretion in peritoneal macrophages (pMACs) stimulated with LPS and ATP. n = 3/cellular replicates from cells isolated on a single day; all peritoneal macrophage experiments were repeated at minimum 3 times on separate days. 2-way ANOVA with multiple testing correction (Tukey’s t test). (D and E) Ejection fraction and end-diastolic volume in control and Mϕ-TFEB mice treated with vehicle (n = 6) or Lalistat (n = 4), 2-way ANOVA with multiple comparison correction (Sidak test, with interaction P value shown on graph). Individual data points with mean and standard error are shown on each graph. ***P < 0.001.

References

    1. Honold L, Nahrendorf M. Resident and monocyte-derived macrophages in cardiovascular disease. Circ Res. 2018;122(1):113–127. doi: 10.1161/CIRCRESAHA.117.311071. - DOI - PMC - PubMed
    1. Epelman S, Liu PP, Mann DL. Role of innate and adaptive immune mechanisms in cardiac injury and repair. Nat Rev Immunol. 2015;15(2):117–129. doi: 10.1038/nri3800. - DOI - PMC - PubMed
    1. Libby P, Hansson GK. Inflammation and immunity in diseases of the arterial tree: players and layers. Circ Res. 2015;116(2):307–311. doi: 10.1161/CIRCRESAHA.116.301313. - DOI - PMC - PubMed
    1. Frantz S, Nahrendorf M. Cardiac macrophages and their role in ischaemic heart disease. Cardiovasc Res. 2014;102(2):240–248. doi: 10.1093/cvr/cvu025. - DOI - PMC - PubMed
    1. Dutta P, Nahrendorf M. Monocytes in myocardial infarction. Arterioscler Thromb Vasc Biol. 2015;35(5):1066–1070. doi: 10.1161/ATVBAHA.114.304652. - DOI - PMC - PubMed

Publication types

Substances