. 2019 Oct 31;10(1):4965.
doi: 10.1038/s41467-019-12985-x.

Clinically relevant molecular subtypes and genomic alteration-independent differentiation in gynecologic carcinosarcoma

Affiliations

Clinically relevant molecular subtypes and genomic alteration-independent differentiation in gynecologic carcinosarcoma

Osamu Gotoh et al. Nat Commun. .

Abstract

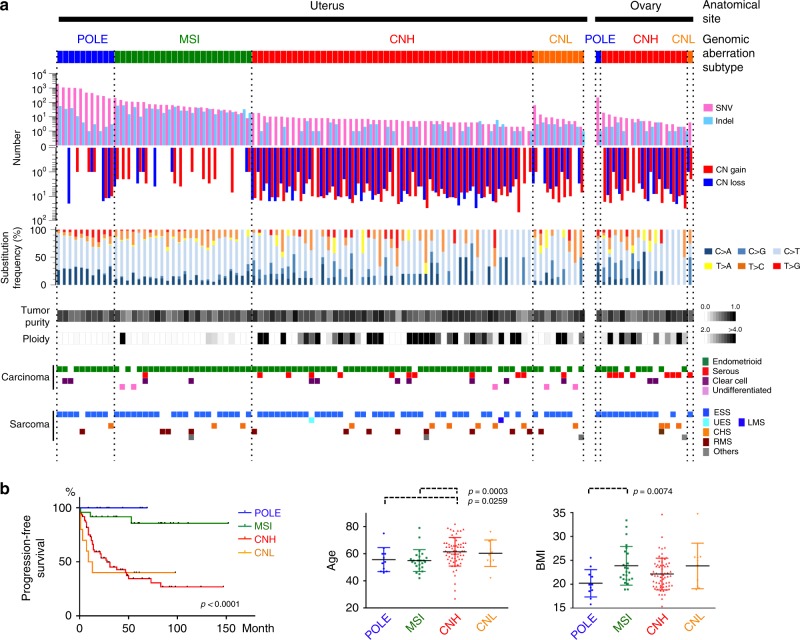
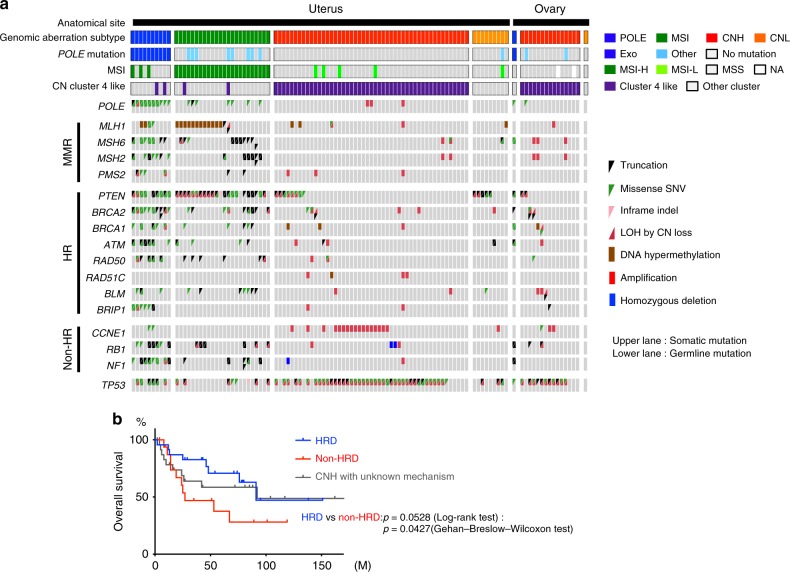
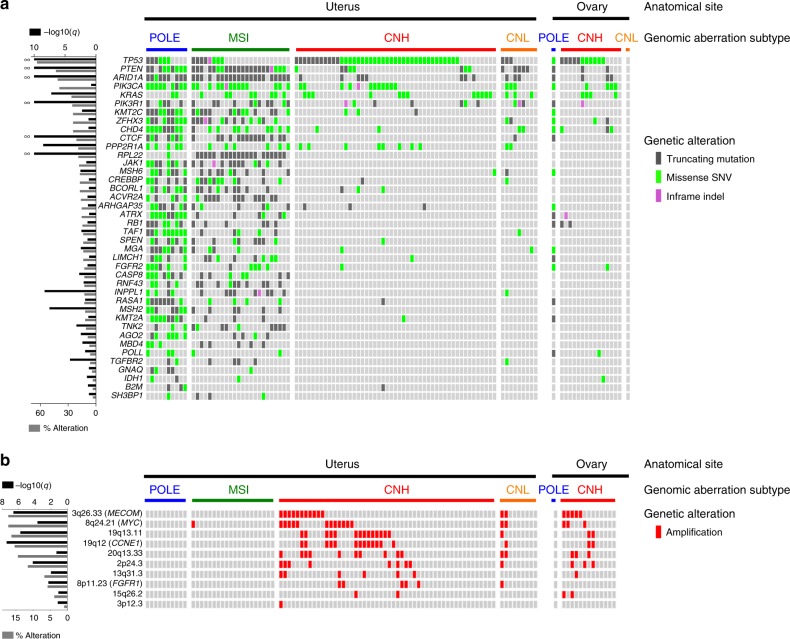
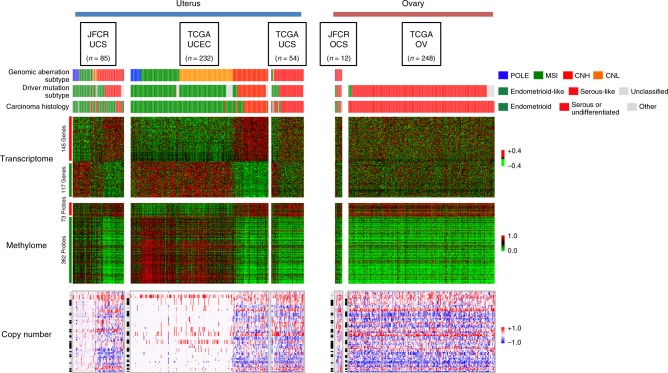
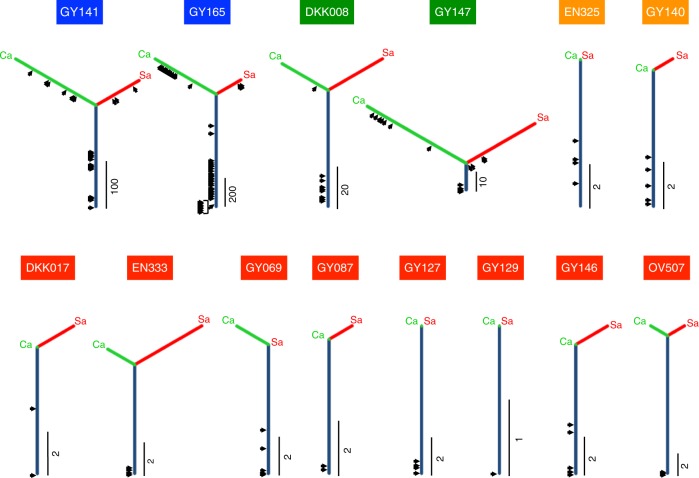
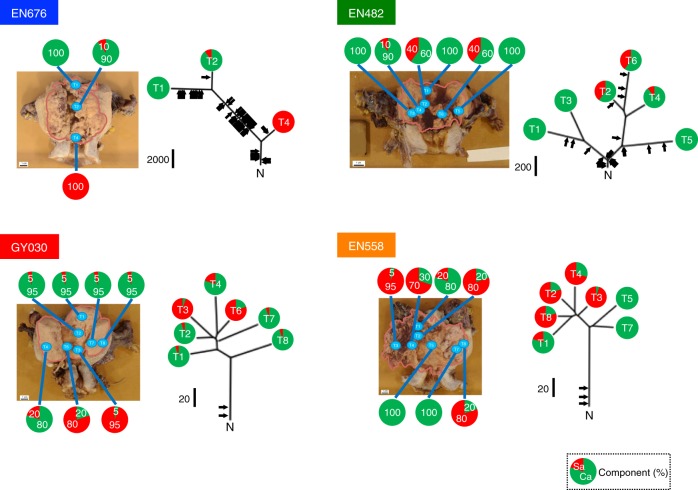
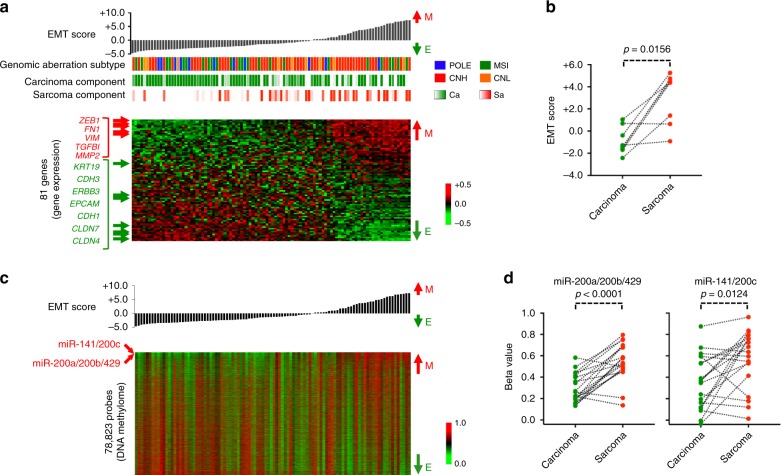
Carcinosarcoma (CS) of the uterus or ovary is a rare, aggressive and biphasic neoplasm composed of carcinoma and sarcoma elements. Previous genomic studies have identified the driver genes and genomic properties associated with CS. However, there is still no molecular subtyping scheme with clinical relevance for this disease. Here, we sequence 109 CS samples, focusing on 596 genes. We identify four molecular subtypes that resemble those observed in endometrial carcinoma: POLE-mutated, microsatellite instability, copy number high, and copy number low subtypes. These molecular subtypes are linked with DNA repair deficiencies, potential therapeutic strategies, and multiple clinicopathological features, including patient outcomes. Multi-regional comparative sequencing reveals genomic alteration-independent CS cell differentiation. Transcriptome and DNA methylome analyses confirm epithelial-mesenchymal transition as a mechanism of sarcoma differentiation. The current study thus provides therapeutic possibilities for CS as well as clues to understanding the molecular histogenic mechanism of its development.


Conflict of interest statement

The authors declare no competing interests.

Figures

Fig. 1
Fig. 1
Genomic aberration profiling identified four molecular subtypes that correlate with various clinicopathological features. a Patterns of genomic alterations in carcinosarcoma (CS) genomic aberration subtypes (MSI, POLE, CNH, and CNL). Uterine (92) and ovarian (17) samples were sorted according to the number of SNVs within a subtype. Panels from top to bottom: bar plots for number of SNVs (pink) and indels (pale blue); bar plots for number of segments with copy-number aberration (CN gain, red; CN loss, blue); rates in percent of nucleotide substitutions (C > A, indigo; C > G, navy blue; C > T, sky blue; T > A, yellow; T > C, orange; T > G, vermilion); tumor purity; tumor ploidy; histopathological diagnosis of carcinoma components (endometrioid, green; serous, red; clear cell, violet; undifferentiated, pink); and histopathological diagnosis of sarcoma components (ESS, sky blue; RMS, brown; CHS, yellowish brown; others, gray). POLE, POLE-mutated; MSI, microsatellite instability; CNH, copy number high; CNL, copy number low; SNV, single nucleotide variant; CNV, copy number variant; CN, copy number; ESS, endometrial stromal sarcoma; RMS, rhabdomyosarcoma; CHS, chondrosarcoma. b Clinical relevance of CS genomic aberration subtypes. Statistically significant parameters are shown among CS genomic subtypes. Left panel. Relapse-free survival in Kaplan–Meier curve. P-values were computed with log-rank test. Middle panel. Age. P-values were computed with the Mann–Whitney U-test. Right panel. Body mass index (BMI). P-values were computed with the Mann–Whitney U-test. Bars and error bars indicate mean and standard deviation
Fig. 2
Fig. 2
Germline and somatic inactivation of DNA repair genes in carcinosarcoma (CS) genomic aberration subtypes. a Relationship between genomic aberration subtype and DNA repair gene mutation. Status of inactivation of POLE, mismatch repair (MMR), and homologous recombination (HR) genes are sorted according to CS subtype and shown along with mutational status of TP53 using Oncoprint. Color code is as follows: truncating mutation, black triangle; missense SNV, green triangle; in-frame indel, pink triangle; loss of heterozygosity (LOH) in wildtype allele by copy-number loss, red triangle; promoter hypermethylation, brown rectangle; amplification, red rectangle; and homozygous deletion, blue rectangle. Somatic and germline mutations are shown in the upper and lower rows, respectively. Using Oncoprint, we show germline missense SNVs only when pathogenic or likely pathogenic, as according to the American College of Medical Genetics and Genomics, Association for Molecular Pathology (ACMG) guidelines (see Methods). Note that 2 of 24 MSI cases (one had MLH1 c.306 + 1_306 + 2delGT, another had MSH2 p.Q374X and MSH6 c.4001 + 2_4001 + 5delTAAC), and 5 of 64 CNH cases (BRCA1 c.5278-1G > A [this case was reported in Abe 2014], BRCA2 p.V1447X, BRCA2 p.T1858fs, BRCA2 p.Y2154fs, and BLM p.K1056fs) had germline mutations, all of which had lost the wildtype allele by LOH or by additional somatic truncation in the tumor samples. b Overall survival of patients with CNH tumors with HRD, non-HRD and the unknown mechanisms. HRD: Homologous recombination deficiency
Fig. 3
Fig. 3
Somatic driver genes in carcinosarcoma (CS) subtypes. a Somatic driver SNVs and indels. Driver genes were computed by IntOGen using somatic SNVs and indels (from target panel or exome sequencing data focusing on 596 genes of the target panel; n = 109). The mutations are presented with Oncoprint according to CS genomic subtype in descending order of mutational frequency in the cohort. Driver genes with statistical significance of q< 0.02 are shown. Mutational frequency in the cohort (gray bar) and q-value for each driver gene (black bar) are shown on the left. Color code is as follows: somatic missense SNV, yellow green; somatic truncating mutation, gray; and somatic in-frame indel, lilac. b Somatic driver CNVs. CNV driver genes were detected by GISTIC using CNVs called (from SNP6 array data; n = 105). Mutational frequency in the cohort (gray bar) and q-value for each driver gene (black bar) are shown on the left. Amplification (CN ≥ 6) is shown in red. We do not show copy number gain (CN = 3, 4, or 5) or loss (CN = 1). Note that only amplification was detected, and no homozygous deletion (CN = 0). CN; copy number
Fig. 4
Fig. 4
Genomic aberration subtypes in the transcriptome, DNA methylome, and copy number data derived from uterine and ovarian cancers. Heatmaps for gene expression (upper panel; red and green color indicate high and low expression), CpG methylation (middle panel; red and green color indicate hyper- and hypo- methylation of the CpG site) and aberrant copy number segments (lower panel; red and blue color indicate gain and loss of segments in copy number) are shown. For the transcriptome or DNA methylome, serous (red line) vs. endometrioid (green line) signatures were generated using the uterine corpus endometrial carcinoma datasets in The Cancer Genome Atlas repository (TCGA UCEC n = 232) and applied to uterine and ovarian carcinosarcoma (UCS and OCS) datasets from the JFCR (Japanese Foundation for Cancer Research), TCGA (JFCR UCS n = 85, TCGA UCS n = 54, and JFCR OCS n = 12), and from TCGA high-grade serous ovarian cancer (TCGA OV n = 248). Data are presented as heatmaps. The serous vs. endometrioid signatures consisted of 145 and 117 genes for the transcriptome and 73 and 362 probes for the DNA methylome. For copy number data, the heatmaps show abnormal segments detected by EXCAVATOR and GISTIC in chromosomal order. Genomic aberration subtypes (POLE, blue; MSI, green; CNH, red; and CNL, orange), driver mutation subtypes (endometrioid-like, green; serous-like, red; and unclassified, gray), and carcinoma histology (endometrioid, green; serous, red; and the other histologies, gray) are presented above the panels
Fig. 5
Fig. 5
Clonal evolution in the carcinoma and sarcoma elements inferred from SNVs/indels based on the 596-gene panel. Phylogenetic trees are used to represent genetic similarity of the carcinoma and sarcoma components in the primary tumor. A trunk (navy) and a branch (yellow green; carcinoma and cherry color; sarcoma) represent shared and private mutations, respectively. The length of the trunk/branch is proportional to the number of SNVs and indels, and an index beside each tree indicates the number of base pairs. The timing of driver mutation acquisition is shown with an arrow. A case ID is shown on a tree with the color indicating the genomic aberration subtype: blue, POLE; green, MSI; red, CNH; and orange, CNL). Ca, carcinoma; Sa, sarcoma
Fig. 6
Fig. 6
Phylogenetic tree analyses with SNVs and indels from the multi-regional exome-sequenced samples of uterine CSs. We selected representative tumors that were completely resected during surgery for each genomic aberration subtype (blue, POLE; green, MSI; red, CNH; and orange, CNL) and rendered to multi-regional exome sequencing. The phylogenetic tree (right) is presented alongside the entire tumor (left) with the margin shown as a pink line. The positions of sample collection are shown. Trunk/branch length is proportional to the total number of SNVs and indels. An index black bar beside the trunk indicates the number of base-pair mutations. The timing of driver mutation acquisition is shown with an arrow. Ca, carcinoma; Sa, sarcoma. The proportions of carcinoma and sarcoma components in each CS sample are shown as a pie chart, with green and red colors indicating the proportion of each component
Fig. 7
Fig. 7
Epithelial-mesenchymal transition (EMT) in the transcriptome and DNA methylome of carcinosarcoma (CS) tumors. a Relationship among EMT score, EMT gene expression, genomic aberration subtype, and carcinoma or sarcoma content in a CS tumor. CS samples are sorted according to EMT score, calculated by the first principal component of 81 EMT marker genes. Red and green indicate high and low expression of the genes in the heatmap. Representative epithelial and mesenchymal genes are shown to the left of the heatmap in green and red, respectively. Color codes for the genomic aberration subtype are as follows: POLE, blue; MSI, green; CNH, red; and CNL, orange. Carcinoma and sarcoma content in a CS sample is shown by gradients of green and red, respectively. E; epithelial, M; mesenchymal. b EMT score of micro-dissected carcinoma or sarcoma components. The EMT scores were computed with RNA-seq data derived from the carcinoma and sarcoma components separately captured by laser capture microdissection. The Wilcoxon signed rank test was used to evaluate statistical significance. c DNA methylome correlated with EMT score across CS samples. CpG probes were selected by variable methylation within the top 20% variance. The resultant 78,823-probe β-values were sorted according to EMT score and are shown as a heatmap. The positions of CpG sites for miR-141/200c and miR-200a/200b/429 are indicated beside the heatmap in red. d miR-200a/200b/429 and miR-141/200c expression of micro-dissected carcinoma or sarcoma components. The Wilcoxon signed rank test was used to evaluate statistical significance

References

    1. McCluggage WG. Malignant biphasic uterine tumours: carcinosarcomas or metaplastic carcinomas? J. Clin. Pathol. 2002;55:321–325. doi: 10.1136/jcp.55.5.321. - DOI - PMC - PubMed
    1. Bansal N, et al. Uterine carcinosarcomas and grade 3 endometrioid cancers: evidence for distinct tumor behavior. Obstet. Gynecol. 2008;112:64–70. doi: 10.1097/AOG.0b013e318176157c. - DOI - PubMed
    1. Kernochan LE, Garcia RL. Carcinosarcomas (malignant mixed Mullerian tumor) of the uterus: advances in elucidation of biologic and clinical characteristics. J. Natl Compr. Canc. Netw. 2009;7:550–556. doi: 10.6004/jnccn.2009.0037. - DOI - PubMed
    1. Berton-Rigaud D, et al. Gynecologic Cancer InterGroup (GCIG) consensus review for uterine and ovarian carcinosarcoma. Int. J. Gynecol. Cancer. 2014;24:S55–S60. doi: 10.1097/IGC.0000000000000228. - DOI - PubMed
    1. Cantrell LA, Blank SV, Duska LR. Uterine carcinosarcoma: a review of the literature. Gynecol. Oncol. 2015;137:581–588. doi: 10.1016/j.ygyno.2015.03.041. - DOI - PubMed

Publication types

MeSH terms