. 2019 Oct 31;6(1):258.
doi: 10.1038/s41597-019-0171-x.

A multi-omics digital research object for the genetics of sleep regulation

Affiliations

A multi-omics digital research object for the genetics of sleep regulation

Maxime Jan et al. Sci Data. .

Abstract

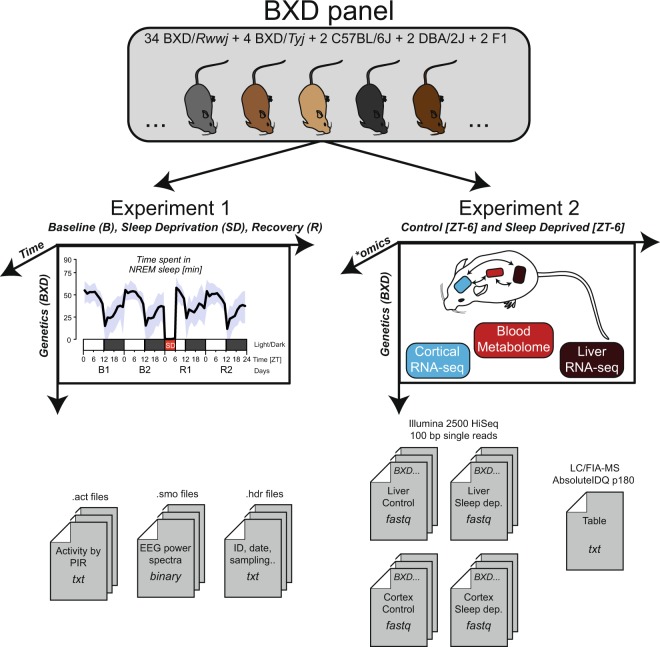
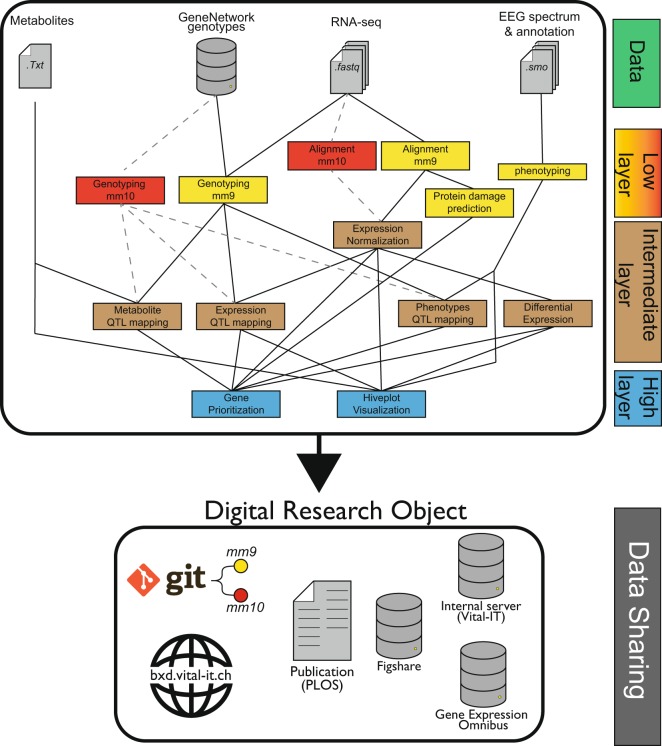
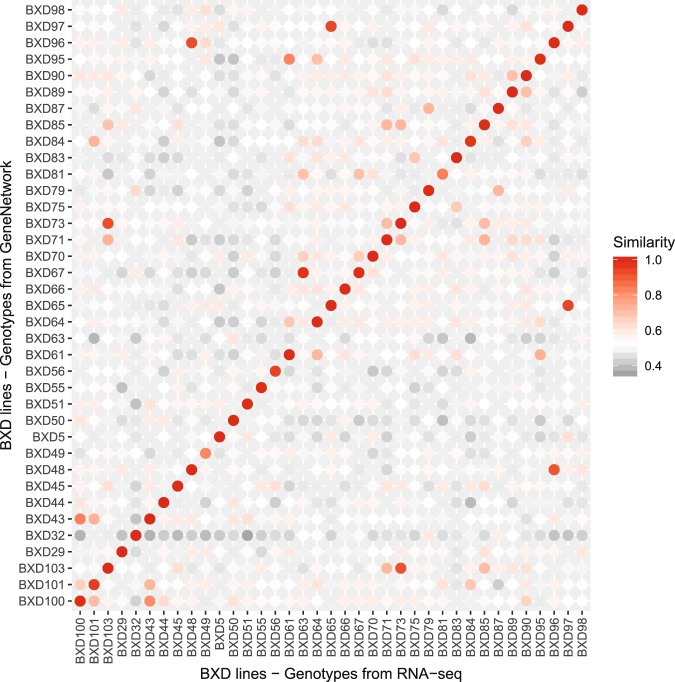
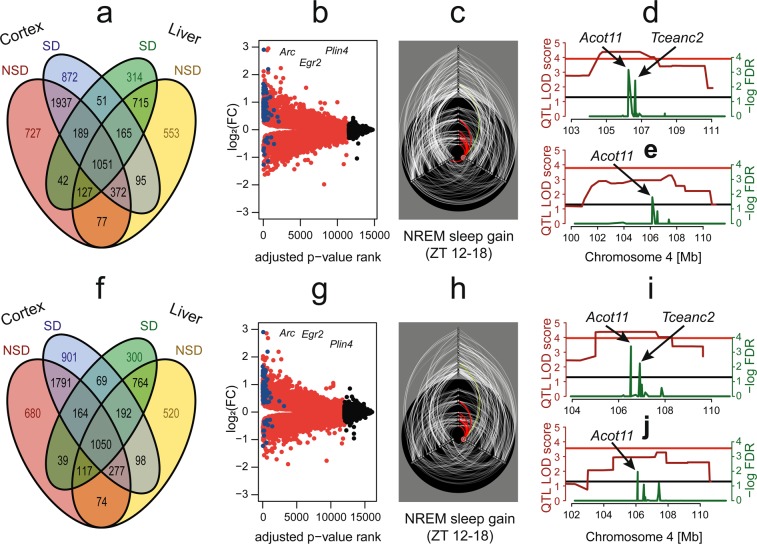
With the aim to uncover the molecular pathways underlying the regulation of sleep, we recently assembled an extensive and comprehensive systems genetics dataset interrogating a genetic reference population of mice at the levels of the genome, the brain and liver transcriptomes, the plasma metabolome, and the sleep-wake phenome. To facilitate a meaningful and efficient re-use of this public resource by others we designed, describe in detail, and made available a Digital Research Object (DRO), embedding data, documentation, and analytics. We present and discuss both the advantages and limitations of our multi-modal resource and analytic pipeline. The reproducibility of the results was tested by a bioinformatician not implicated in the original project and the robustness of results was assessed by re-annotating genetic and transcriptome data from the mm9 to the mm10 mouse genome assembly.


Conflict of interest statement

The authors declare no competing interests.

Figures

Fig. 1
Fig. 1
Data generation. The behavioral/EEG end-phenotypes of the BXD mouse panel were quantified in Experiment 1. Mice were recorded for 4 days: 2 days of baseline (B1 & B2), followed by 6 h of sleep deprivation (SD) and 2 days of recovery (R1 & R2). EEG spectral composition was written in .smo files, activity in .act files and meta-data in .hdr files. Blood metabolomics, liver transcriptomics and cortical transcriptomics were quantified in Experiment 2. ‘Control’ and ‘Sleep deprived’ batches were sampled at a single time point: ZT6 (i.e. directly after sleep deprivation for the ‘sleep deprived’ batch). Transcriptomics was performed on pooled sampled per BXD strains. For blood metabolomics, metabolite quantification was performed for each BXD replicates. Adapted from.
Fig. 2
Fig. 2
Median PHRED read quality per base for BXD RNA-sequencing. PHRED quality score based on illumina 1.9. (a) Samples from Cortex during control (NSD). (b) Samples from Cortex after sleep deprivation (SD). (c) Samples from Liver during control (NSD). (d) Samples from Liver after sleep deprivation (SD). Median score was computed using MultiQC.
Fig. 3
Fig. 3
Summary of the bioinformatic analytical pipeline. Representation of the main bioinformatics methods used. Original analyses were performed using the mm9 mouse assembly (yellow). Results were also reproduced using the mm10 mouse assembly (red) and all downstream analyses. Layers represent the scripts organization on gitlab and available intermediate files.
Fig. 4
Fig. 4
Similarity matrix [in %] between RNA-seq variant calling and GeneNetwork genotypes. A similarity of 1 indicates that all common genotypes are similar. We here compare only genotypes that were labeled as ‘B’ or ‘D’ and excluded unknown ‘U’ or heterozygous ‘H’ genotypes. BXD63 genotypic similarity in our dataset was low and could indicate mislabeling.
Fig. 5
Fig. 5
Robustness of the analysis pipeline. (a to e) Technical reanalysis with mm9 reference genome. (f to j) Reanalysis with mm10 reference genome. (a and f) Venn diagram of significant cis-eQTL. (b and g) Volcano plot of differential gene expression in cortex. (c and h): Hiveplot for NREM sleep gain during recovery with highlight on Acot11. (d,e,i,j) Gene prioritization for NREM sleep gain during recovery (d and i) or phosphatidylcholine acyl-alkyl C38:2 levels (e and j). recovery = first 6 hours of dark period after sleep deprivation (ZT 12–18), SD = sleep deprivation, NSD = not sleep deprivation (control), FC = fold-change, NREM = non-rapid eye movement, LOD = logarithm of odds, FDR = false discovery rate.

References

    1. Schmid SM, Hallschmid M, Schultes B. The metabolic burden of sleep loss. The Lancet Diabetes & Endocrinology. 2015;3:52–62. doi: 10.1016/S2213-8587(14)70012-9. - DOI - PubMed
    1. Diessler Shanaz, Jan Maxime, Emmenegger Yann, Guex Nicolas, Middleton Benita, Skene Debra J., Ibberson Mark, Burdet Frederic, Götz Lou, Pagni Marco, Sankar Martial, Liechti Robin, Hor Charlotte N., Xenarios Ioannis, Franken Paul. A systems genetics resource and analysis of sleep regulation in the mouse. PLOS Biology. 2018;16(8):e2005750. doi: 10.1371/journal.pbio.2005750. - DOI - PMC - PubMed
    1. Civelek M, Lusis AJ. Systems genetics approaches to understand complex traits. Nature Reviews Genetics. 2014;15:34–48. doi: 10.1038/nrg3575. - DOI - PMC - PubMed
    1. Peirce JL, Lu L, Gu J, Silver LM, Williams RW. A new set of BXD recombinant inbred lines from advanced intercross populations in mice. BMC Genetics. 2004;5:7. doi: 10.1186/1471-2156-5-7. - DOI - PMC - PubMed
    1. Franken P, Chollet D, Tafti M. The homeostatic regulation of sleep need is under genetic control. The Journal of neuroscience: the official journal of the Society for Neuroscience. 2001;21:2610–2621. doi: 10.1523/JNEUROSCI.21-08-02610.2001. - DOI - PMC - PubMed