. 2019 Oct 31;6(1):252.
doi: 10.1038/s41597-019-0193-4.

The Signaling Pathways Project, an integrated 'omics knowledgebase for mammalian cellular signaling pathways

Affiliations

The Signaling Pathways Project, an integrated 'omics knowledgebase for mammalian cellular signaling pathways

Scott A Ochsner et al. Sci Data. .

Abstract

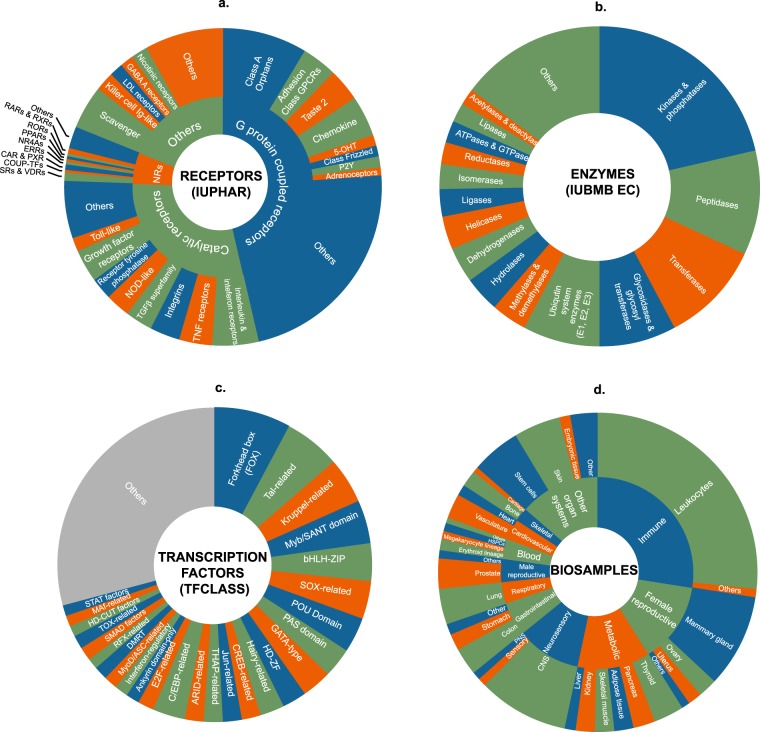
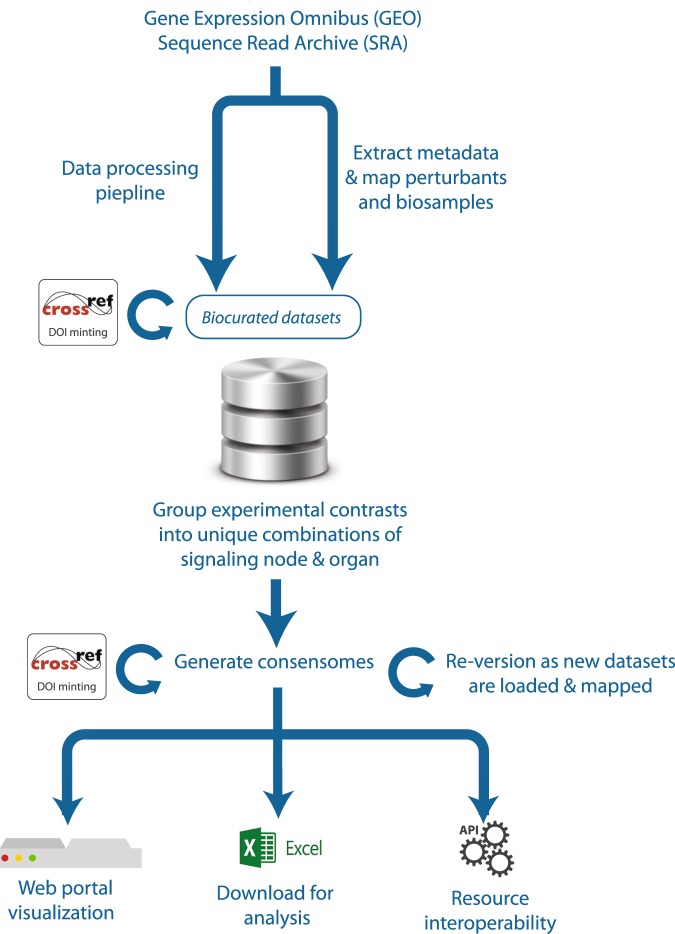
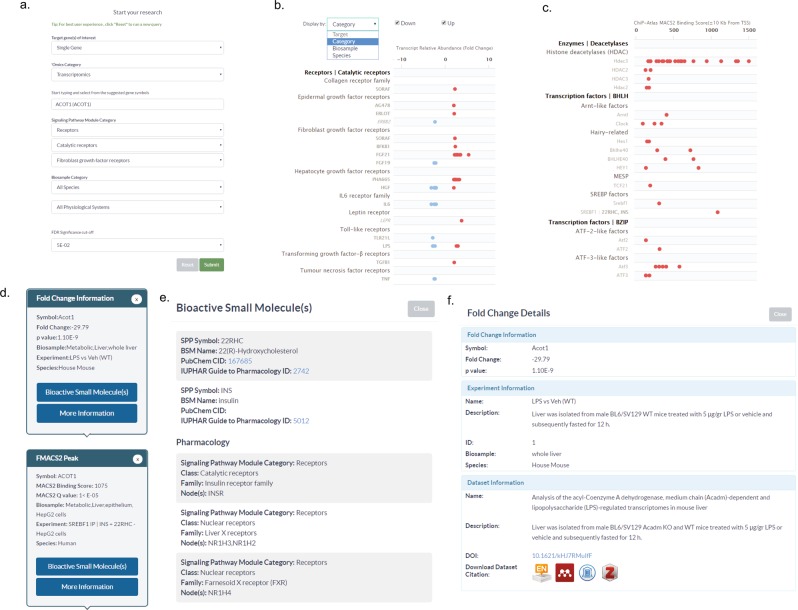
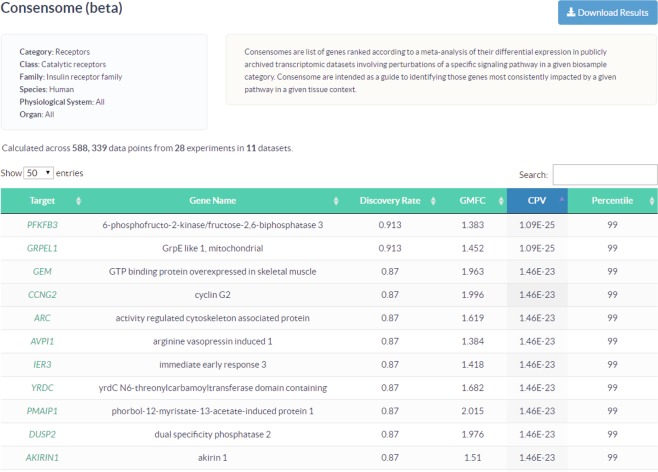
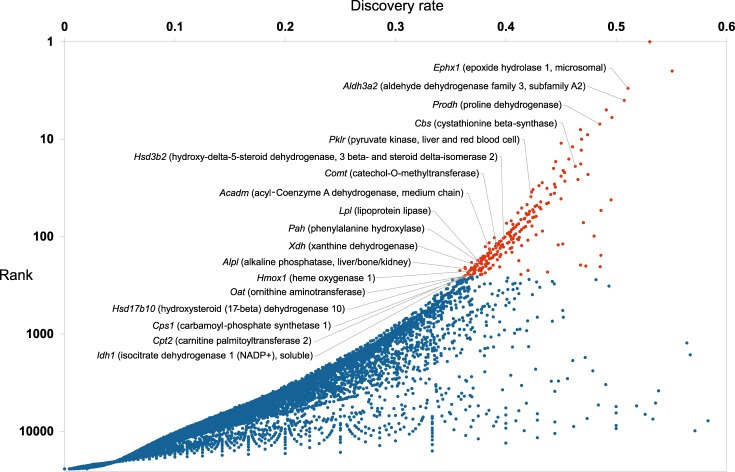
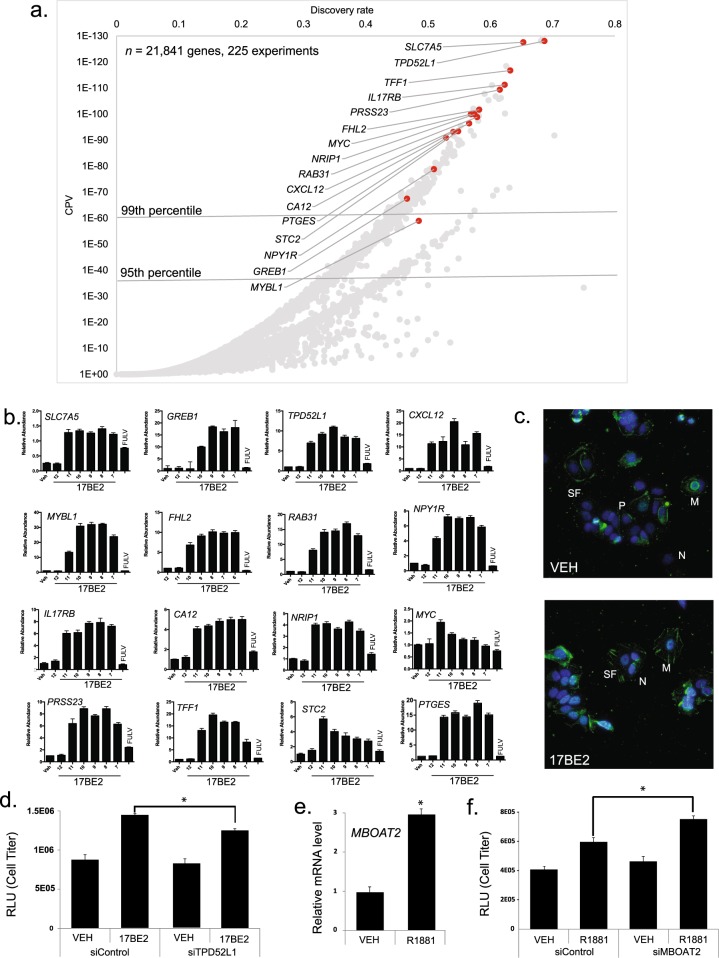
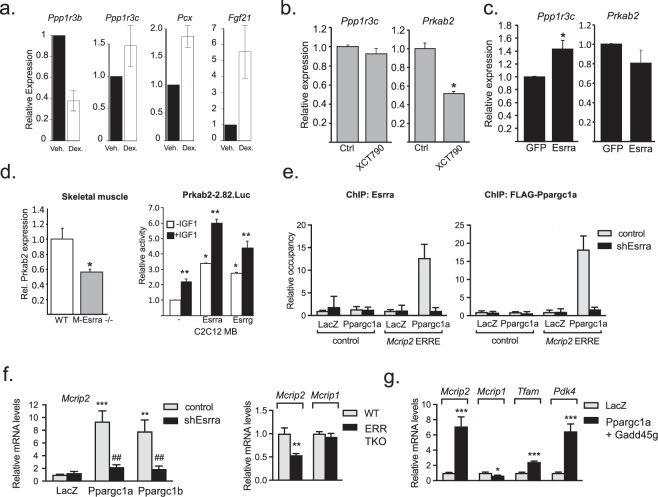
Mining of integrated public transcriptomic and ChIP-Seq (cistromic) datasets can illuminate functions of mammalian cellular signaling pathways not yet explored in the research literature. Here, we designed a web knowledgebase, the Signaling Pathways Project (SPP), which incorporates community classifications of signaling pathway nodes (receptors, enzymes, transcription factors and co-nodes) and their cognate bioactive small molecules. We then mapped over 10,000 public transcriptomic or cistromic experiments to their pathway node or biosample of study. To enable prediction of pathway node-gene target transcriptional regulatory relationships through SPP, we generated consensus 'omics signatures, or consensomes, which ranked genes based on measures of their significant differential expression or promoter occupancy across transcriptomic or cistromic experiments mapped to a specific node family. Consensomes were validated using alignment with canonical literature knowledge, gene target-level integration of transcriptomic and cistromic data points, and in bench experiments confirming previously uncharacterized node-gene target regulatory relationships. To expose the SPP knowledgebase to researchers, a web browser interface was designed that accommodates numerous routine data mining strategies. SPP is freely accessible at https://www.signalingpathways.org .


Conflict of interest statement

Charles Foulds has equity in Coactigon, Inc.

Figures

Fig. 1
Fig. 1
Scope of the major signaling pathway module and biosample classifications in the SPP knowledgebase. Stable community-endorsed classifications for: (a) cellular receptors (International Union of Pharmacology, IUPHAR); (b) enzymes (International Union of Biochemistry and Molecular Biology, IUBMB) and (c) transcription factors (TFClass) make up the foundation of the SPP data model. In addition, categorization of tissue and cell line biosamples according to their organ and physiological system of origin (d) facilitates an appreciation of tissue-specific patterns of transcriptional regulation. 5OHT, 5 hydroxytryptamine receptors; LDL, low density lipoprotein; NRs, nuclear receptors. For purposes of clarity, omitted from the transcription factors sunburst are factors with >3 adjacent zinc fingers (482 genes), Hox-related factors (180 genes), multiple dispersed zinc finger factors (140 genes) and other factors with up to three adjacent zinc fingers (24 genes). Note that this represents the theoretical scope of SPP; not all entities depicted are represented in the current version of the SPP knowledgebase. A full list of current datasets can be found at https://www.signalingpathways.org/datasets/index.jsf.
Fig. 2
Fig. 2
Schematic depiction of SPP biocuration and FAIR annotation pipeline. See the Methods section for additional information.
Fig. 3
Fig. 3
Key elements of the SPP query and reporting interface. (a) Ominer query form. (b) The transcriptomic Regulation Report. The default display for single gene queries is by Category, which can be adjusted to cluster data points by biosample or species. The default display for multi-gene queries is by Target. (c) The cistromic Regulation Report. IP antigens are identified using case-sensitive AGSs to denote experiments in different species. (d) Fold Change information windows for transcriptomic (upper) and cistromic (lower) Regulation Reports display essential information on the data point. (e) The Bioactive Small Molecule window displays the pharmacology of any BSMs used in the experiment. (f) The Fold Change Detail window places the data point in the context of the wider experiment and dataset, and provides for citation of the dataset.
Fig. 4
Fig. 4
Consensome user interface. The example shows genomic targets most frequently significantly differentially expressed in response to genetic or pharmacological manipulation of the human insulin receptor in a transcriptomic experiment. Targets are ranked by default by the consensome P value (CPV), which equates to the probability that the observed frequency of differential expression occurs by chance. Target symbols link to a SPP Regulation Report filtered by the consensome category and biosample parameters to show the underlying data points.
Fig. 5
Fig. 5
Scatterplot of the mouse all nodes liver transcriptomic consensome. This plot distills data from nearly 300 distinct experiments to convey a visual appreciation of the relative rates of differential expression of murine genes across a variety of hepatic signaling contexts. Genes in the 99th percentile are highlighted in orange. For cross-reference with Table 5, genes encoding selected metabolic enzymes in the 99th percentile are called out by gene symbol and name. For details, refer to the Transcriptomic Consensomes subsection in the Generation of Consensomes section of the Methods.
Fig. 6
Fig. 6
Validation of ER regulation of TPD52L1 and AR regulation of MBOAT2. (a) Scatterplot of the ERs-Hs-MG transcriptomic consensome. Genes selected for Q-PCR validation are colored orange and called out by approved gene symbol. 99th and 95th percentile cut-offs are shown for reference. (b) Q-PCR analysis of dose dependent induction by 17BE2 in MCF-7 cells of targets with elevated rankings in the ER-Hs-MG transcriptomic consensome. Cells were treated for 18 h with varying concentrations of 17BE2 alone or 1 nM 17BE2 in combination with 100 nM of the selective ER downregulator FULV. Consistent with the strong ER family node dependence of regulation predicted by the ERs-Hs-MG transcriptomic and ChIP-Seq consensomes, FULV completely abolishes 17BE2 induction of all target genes tested. Each number is representative of −log[17BE2] such that the number 9 is equivalent to 1 nM 17BE2. Data are representative of three independent experiments. (c) MCF-7 cells were immunolabeled with TPD52L1 antibody (green) and imaged by deconvolution widefield microscopy. Images shown are max intensity projections, where DAPI (blue) stains DNA. Scale bar is 10μm. (in the inset, 5μm). M, membrane; N, nucleus; P, perinuclear junctions; SF, stress fibers. (d) Depletion of TPD52L1 restricts MCF-7 cell viability. (e) Induction of MBOAT2 in LNCaP prostate epithelial cells upon treatment with 0.1 nM AR agonist R1881. (f) AR-stimulated viability of LNCaP cells is enhanced by depletion of MBOAT2. Cells were harvested on Day 5. Gene expression of KLK3 and FKBP5, known canonical AR target genes, was slightly reduced or unaffected, respectively, by MBOAT2 siRNA knockdown (data not shown). Statistical significance was determined using PRISM by One-way ANOVA with Tukey’s multiple comparison test. *p < 1E-04.
Fig. 7
Fig. 7
Validation of consensome predictions of genomic targets for GR, ERR and IR. (a) Ppp1r3c is regulated by GR. Mouse Hepa-1-c hepatoma cells were treated with 250 nM dexamethasone (DEX) for 48 h, followed by qPCR of glycogenic genes including Ppp1r3c, Ppp1r3b and the established GR/NR3C1 targets pyruvate carboxylase (Pcx) and Fgf21. (b) Endogenous Ppp1r3c and Prkab2 transcripts were measured by quantitative real-time PCR in C2C12 day 3 myotubes treated with vehicle or 5 μM of the Esrra inverse agonist XCT790 (IC50~0.5 mM) for 24 h. (c) Endogenous Ppp1r3c and Prkab2 transcripts were measured by quantitative real-time PCR in C2C12 day 3 myotubes transduced with recombinant adenovirus expressing GFP or human Esrra/ERRα. Experimental transcript levels were normalized to 36B4 expression and results are expressed as the mean ± S.E.M. Asterisks * indicate significant difference vehicle vs. treatment groups, (p ≤ 0.05, n = 3). (d) Left panel. Expression of Prkab2 transcript is reduced by 40% in Esrra-depleted skeletal muscle compared to wild-type tissue. Endogenous Prkab2 expression was assayed by Q-PCR in vastus lateralis muscles of male wild-type (WT) or Esrr1−/− mice (ERRα−/−). Prkab2 transcript was normalized to 36B4 expression and results are expressed as the mean (±S.E.M). Asterisk * indicates significant difference between groups (p < 0.05, n = 4). Right panel. Activity of the Prkab2.-2.82.Luc promoter-reporter in C2C12 myoblasts (MB) cotransfected with vector, ERRα/Esrra or ERRγ/Esrrg, as indicated. One day post-transfection MB were then cultured in 0.1% FBS overnight −/+10 nM IGF1 treatment for 24 hours. Data are reported as mean luciferase/renilla values normalized to control ( ± S.E.M.) for three trials. Asterisks indicate significant differences between transfection conditions (*) or IGF1 treatment (**), (p ≤ 0.05, n = 3). (e) ChIP of Esrra (left panel) and Ppargc1a (right panel) at the Mcrip2 ERRE. C2C12 myotubes were treated as described in Methods. Relative occupancy represents the amount of Mcrip2 DNA (or of a control genomic region that has no ERR binding sites) that is immunoprecipitated by anti-Esrra or anti-Flag (detecting the Flag-tagged Ppargc1a in the different myotubes, relative to the DNA immunoprecipitated in LacZ/control shRNA cells (which has been set as 1 for each DNA region). Data are mean ± SD (n = 3). (f) Left panel. Mcrip2 is induced by Ppargc1 co-nodes in C2C12 myotubes in an Esrra-dependent manner. RNA (isolated 24 hrs after Ppargc1a/b expression) was analyzed by RT-qPCR. Data are normalized to 36B4, and expressed relative to levels in LacZ/shGFP cells. Right panel. Expression levels of Mcrip2, but not the related gene Mcrip1, are decreased in primary brown adipocytes lacking Esrra, Esrrb and Esrrg (ERR TKO), relative to ERR WT mice. mRNA levels were determined as in left panel. (g) Simulation of chronic adrenergic stimulation of primary brown adipocytes by overexpression of Ppargc1a and Gadd45g significantly increases expression of Mcrip2 relative to mock-transfected adipocytes. Included as controls are the OXPHOS genes Tfam and Pdk4, encoding pyruvate dehydrogenase kinase isoform 4, a characterized ERR target and the third highest ranked target in the All nodes-Mm-adipose transcriptomic consensome signature. Differentiated adipocytes were infected with adenoviruses expressing Ppargc1a and Gadd45g and mRNA levels measured as described in the Methods section.

Similar articles

Cited by

References

    1. Taniguchi CM, Emanuelli B, Kahn CR. Critical nodes in signalling pathways: insights into insulin action. Nat Rev Mol Cell Biol. 2006;7:85–96. doi: 10.1038/nrm1837. - DOI - PubMed
    1. Fabregat A, et al. The Reactome pathway Knowledgebase. Nucleic Acids Res. 2016;44:D481–487. doi: 10.1093/nar/gkv1351. - DOI - PMC - PubMed
    1. Wilkinson MD, et al. The FAIR Guiding Principles for scientific data management and stewardship. Sci Data. 2016;3:160018. doi: 10.1038/sdata.2016.18. - DOI - PMC - PubMed
    1. Darlington YF, et al. Improving the discoverability, accessibility, and citability of omics datasets: a case report. J Am Med Inform Assoc. 2017;24:388–393. doi: 10.1093/jamia/ocw096. - DOI - PMC - PubMed
    1. Becnel Lauren B., Ochsner Scott A., Darlington Yolanda F., McOwiti Apollo, Kankanamge Wasula H., Dehart Michael, Naumov Alexey, McKenna Neil J. Discovering relationships between nuclear receptor signaling pathways, genes, and tissues in Transcriptomine. Science Signaling. 2017;10(476):eaah6275. doi: 10.1126/scisignal.aah6275. - DOI - PubMed