Meta-Analysis
. 2019 Oct 31;10(1):4955.
doi: 10.1038/s41467-019-12760-y.

GWAS for systemic sclerosis identifies multiple risk loci and highlights fibrotic and vasculopathy pathways

Collaborators, Affiliations
Meta-Analysis

GWAS for systemic sclerosis identifies multiple risk loci and highlights fibrotic and vasculopathy pathways

Elena López-Isac et al. Nat Commun. .

Abstract

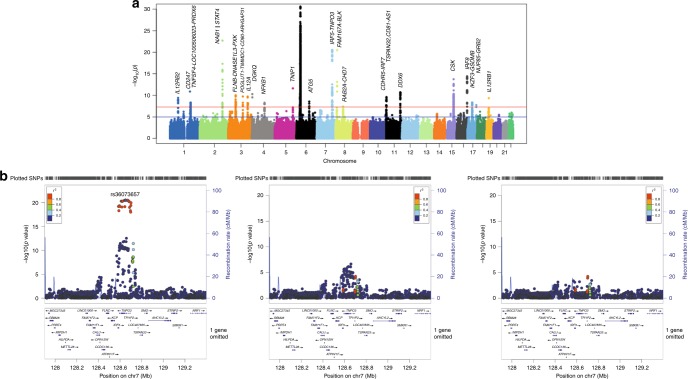
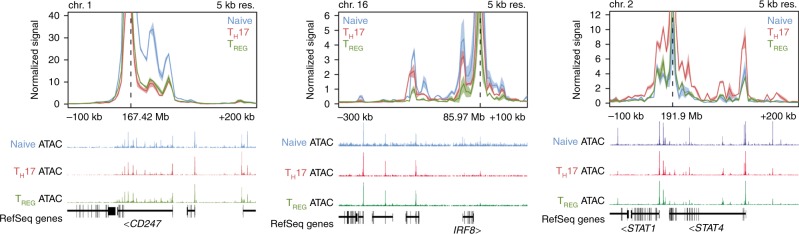
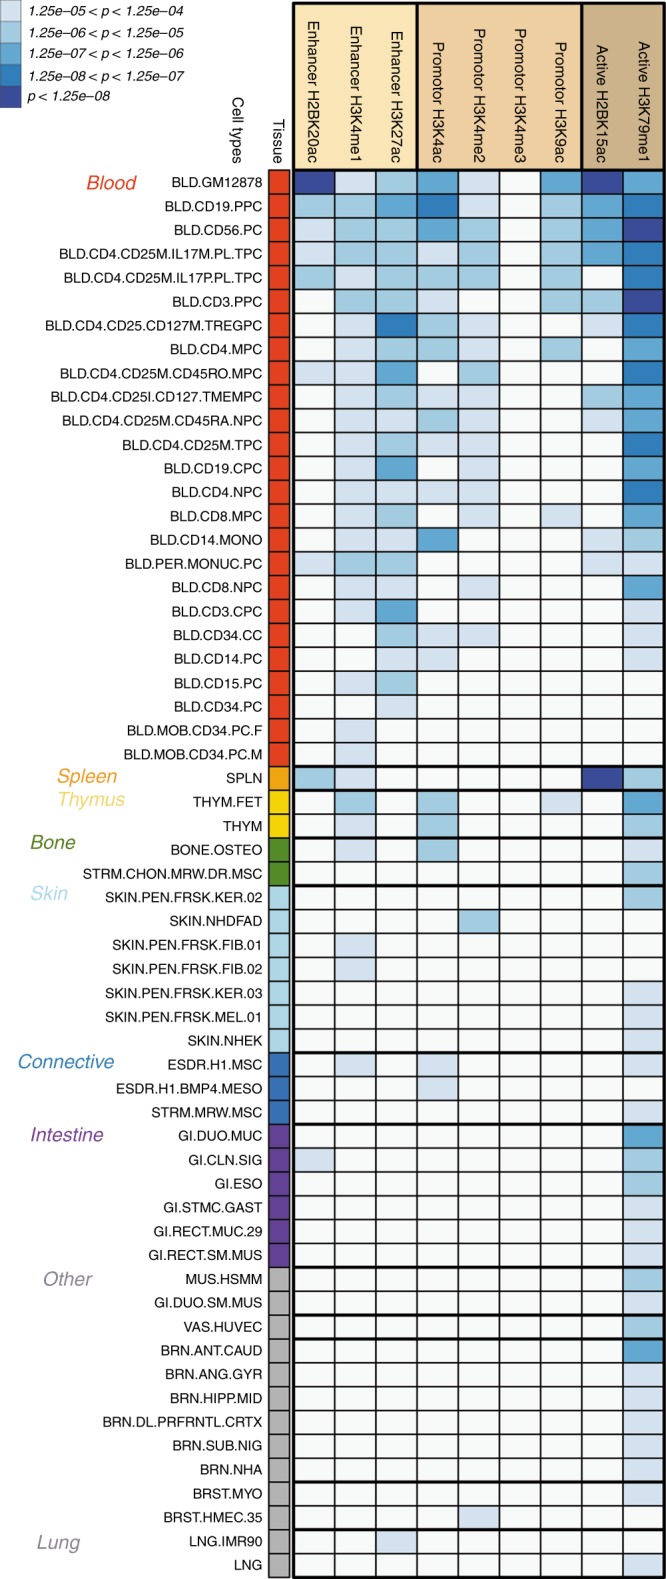
Systemic sclerosis (SSc) is an autoimmune disease that shows one of the highest mortality rates among rheumatic diseases. We perform a large genome-wide association study (GWAS), and meta-analysis with previous GWASs, in 26,679 individuals and identify 27 independent genome-wide associated signals, including 13 new risk loci. The novel associations nearly double the number of genome-wide hits reported for SSc thus far. We define 95% credible sets of less than 5 likely causal variants in 12 loci. Additionally, we identify specific SSc subtype-associated signals. Functional analysis of high-priority variants shows the potential function of SSc signals, with the identification of 43 robust target genes through HiChIP. Our results point towards molecular pathways potentially involved in vasculopathy and fibrosis, two main hallmarks in SSc, and highlight the spectrum of critical cell types for the disease. This work supports a better understanding of the genetic basis of SSc and provides directions for future functional experiments.


Conflict of interest statement

H.Y.C. is a co-founder of Accent Therapeutics and advisor to 10x Genomics and Spring Discovery. All other authors declare no competing interests.

Figures

Fig. 1
Fig. 1
Association signals for systemic sclerosis in a large meta-GWAS. a Manhattan plot representing the meta-GWAS results. The −log10 of the p values are plotted against their physical chromosomal position. The red and blue lines represent the genome-wide level of significance (p < 5 × 10−8) and p value threshold at p < 1 × 10−5, respectively. The plot has been truncated at p < 1 × 10−30. The lowest p value was observed within the MHC region for rs6457617 (association test p = 3.25 × 10−43). b Locuszoom to depict independent association signals in IRF5-TNPO3. From left to right, locuszoom of the association signals in IRF5-TNPO3 for the global meta-analysis; association signals conditioned on the lead SNP (rs36073657), and conditioned on rs36073657 and the secondary signal at the locus (rs12155080)
Fig. 2
Fig. 2
H3K27ac HiChIP signals at systemic sclerosis loci in human CD4+ T cells. The SNPs with maximum Posterior Probabilities in each locus were set as anchor points to assess promoter-enhancer chromatin interactions. Representation of overlap with ATAC-seq peaks is included. Chr, chromosome; Kb, kilo base; Mb, mega base; Res, resolution
Fig. 3
Fig. 3
Tissue-specific enrichment for systemic sclerosis associations in epigenetic marks. The heatmap displays the significant enrichment (p value < 1.25 × 10−4) in 59 out of the 127 cell and tissue types in Roadmap Epigenomics Consortium and the Encyclopedia of DNA Elements (ENCODE) projects. The enrichment p values are plotted with different colors according to the strength of the significance. Since the enrichments were computed at various GWAS p value cutoffs (5 × 10−6, 5 × 10−7, 5 × 10−8), the most significant p value was selected if a cell type/epigenetic mark combination showed more than one significant enrichment across the different cutoffs. Supplementary Data 13 provides the correspondence between cell codes and cell types

Comment in

  • New genetic risk loci found for SSc.
    Clarke J. Clarke J. Nat Rev Rheumatol. 2020 Jan;16(1):4. doi: 10.1038/s41584-019-0342-3. Nat Rev Rheumatol. 2020. PMID: 31754243 No abstract available.

Similar articles

Cited by

References

    1. Barnes J, Mayes MD. Epidemiology of systemic sclerosis: incidence, prevalence, survival, risk factors, malignancy, and environmental triggers. Curr. Opin. Rheumatol. 2012;24:165–170. doi: 10.1097/BOR.0b013e32834ff2e8. - DOI - PubMed
    1. Gabrielli A, Avvedimento EV, Krieg T. Scleroderma. N. Engl. J. Med. 2009;360:1989–2003. doi: 10.1056/NEJMra0806188. - DOI - PubMed
    1. Denton CP, Khanna D. Systemic sclerosis. Lancet. 2017;390:1685–1699. doi: 10.1016/S0140-6736(17)30933-9. - DOI - PubMed
    1. Steen VD, Medsger TA. Changes in causes of death in systemic sclerosis, 1972-2002. Ann. Rheum. Dis. 2007;66:940–944. doi: 10.1136/ard.2006.066068. - DOI - PMC - PubMed
    1. Nelson MR, et al. The support of human genetic evidence for approved drug indications. Nat. Genet. 2015;47:856–860. doi: 10.1038/ng.3314. - DOI - PubMed

Publication types