. 2019 Oct 31;10(1):4970.
doi: 10.1038/s41467-019-12956-2.

Plasticity of the Mycobacterium tuberculosis respiratory chain and its impact on tuberculosis drug development

Affiliations

Plasticity of the Mycobacterium tuberculosis respiratory chain and its impact on tuberculosis drug development

Tiago Beites et al. Nat Commun. .

Abstract

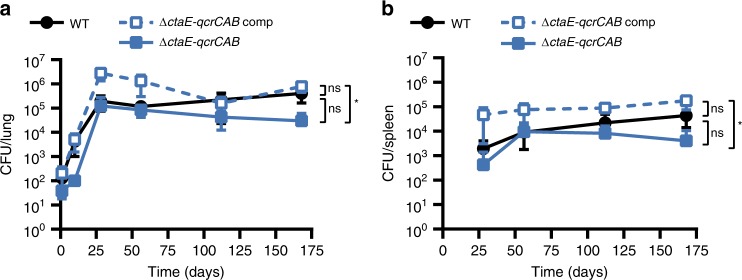
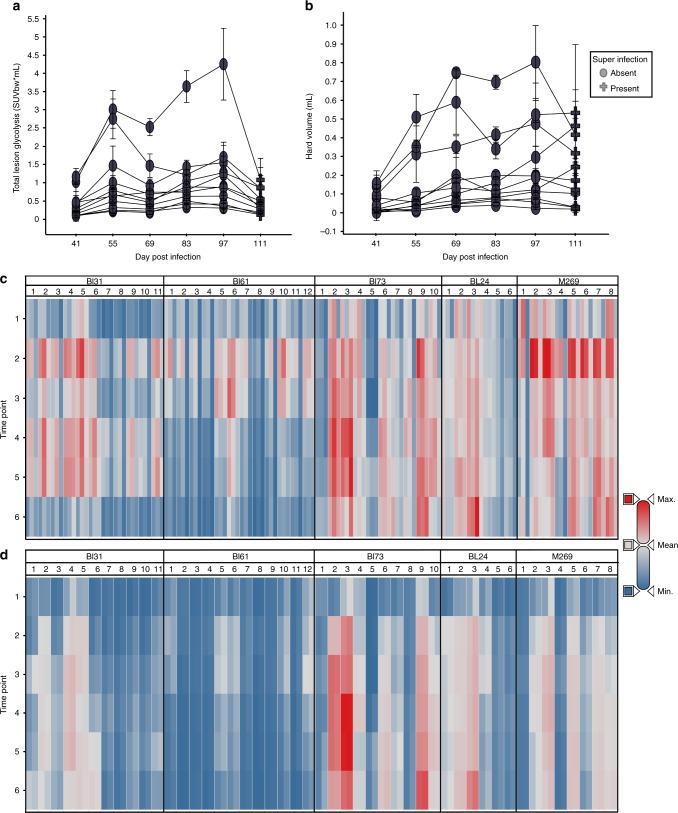
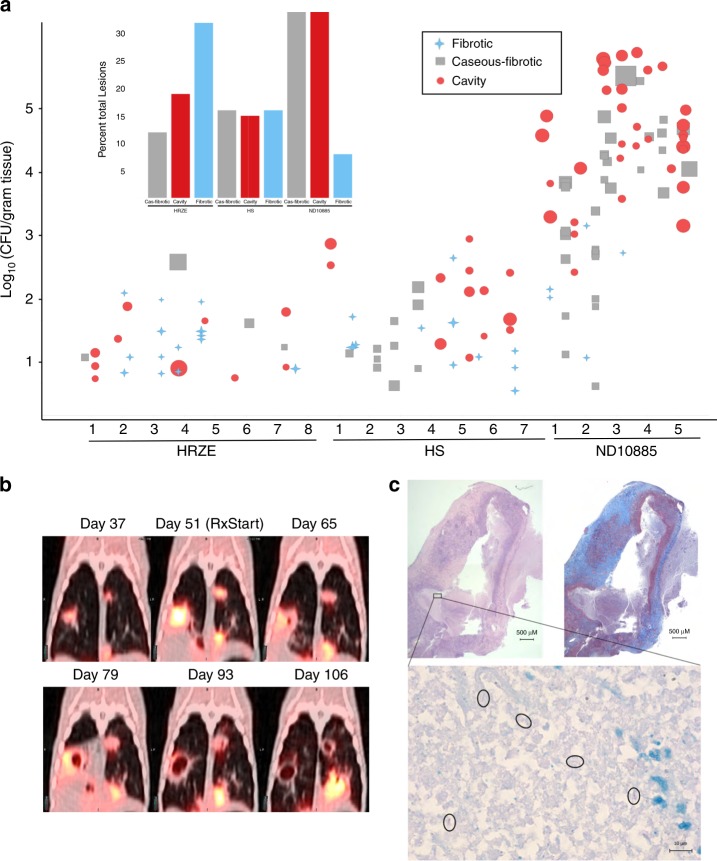
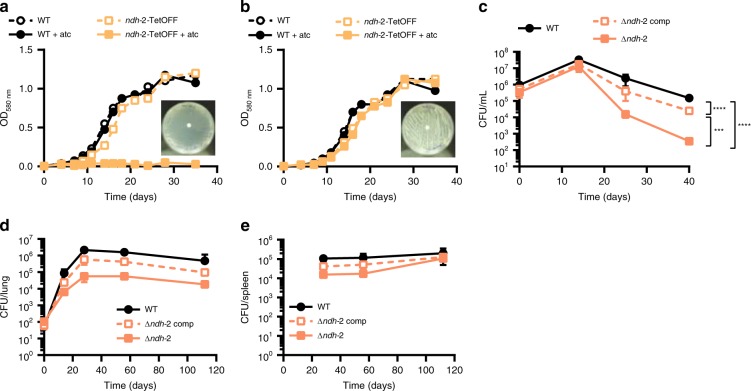
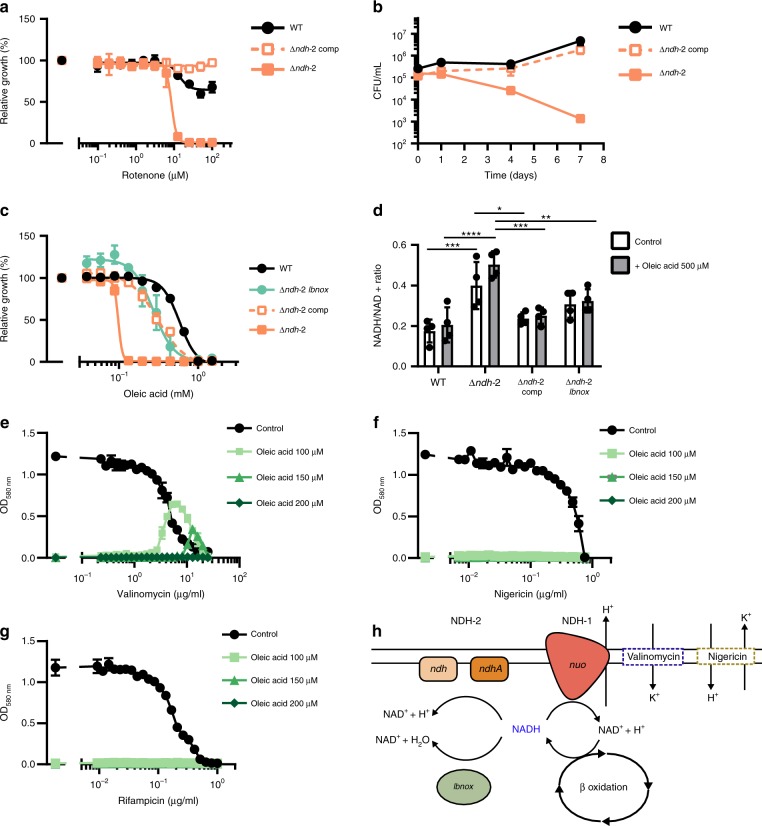
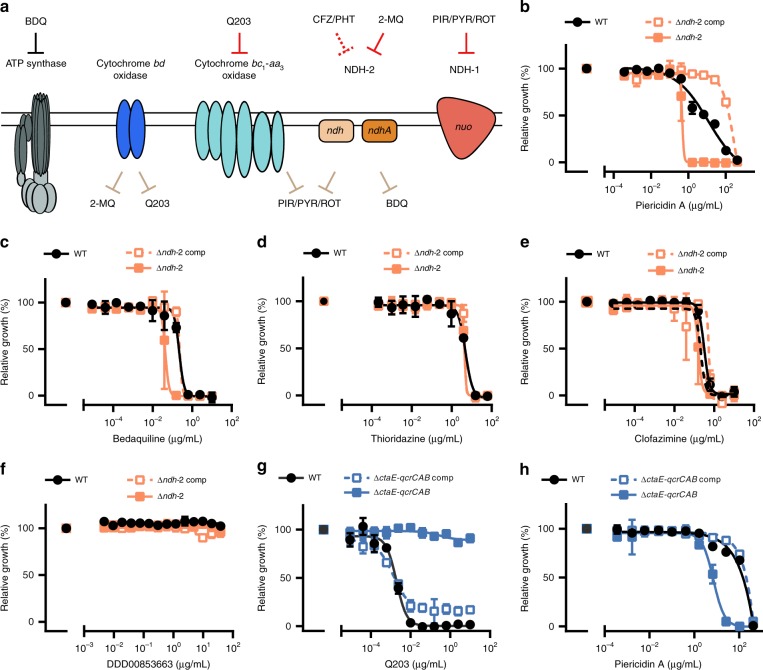
The viability of Mycobacterium tuberculosis (Mtb) depends on energy generated by its respiratory chain. Cytochrome bc1-aa3 oxidase and type-2 NADH dehydrogenase (NDH-2) are respiratory chain components predicted to be essential, and are currently targeted for drug development. Here we demonstrate that an Mtb cytochrome bc1-aa3 oxidase deletion mutant is viable and only partially attenuated in mice. Moreover, treatment of Mtb-infected marmosets with a cytochrome bc1-aa3 oxidase inhibitor controls disease progression and reduces lesion-associated inflammation, but most lesions become cavitary. Deletion of both NDH-2 encoding genes (Δndh-2 mutant) reveals that the essentiality of NDH-2 as shown in standard growth media is due to the presence of fatty acids. The Δndh-2 mutant is only mildly attenuated in mice and not differently susceptible to clofazimine, a drug in clinical use proposed to engage NDH-2. These results demonstrate the intrinsic plasticity of Mtb's respiratory chain, and highlight the challenges associated with targeting the pathogen's respiratory enzymes for tuberculosis drug development.


Conflict of interest statement

The authors declare the following competing interests: TM and PVD are employees of Eli Lilly and Company.

Figures

Fig. 1
Fig. 1
The cytochrome bc1-aa3 complex is dispensable for growth and persistence of Mtb in mice. Growth and persistence of ΔctaE-qcrCAB in mouse lungs (a) and spleens (b). Data are averages of CFUs from at least three mice per time point. Error bars correspond to standard deviation. “Comp” stands for complemented. Statistical significance was assessed by one-way ANOVA followed by post hoc test (Tukey test; GraphPad Prism). *P < 0.05; ns - not significant. Source data are provided as a Source Data file
Fig. 2
Fig. 2
ND10885 treatment of M. tuberculosis infected marmosets. a Total lesion glycolysis within each individual lesion for a single animal. The timeline begins 41 days post-infection and treatment within this animal begins at Day 55. Most lesions appear to become less FDG avid within the first 2 weeks of treatment and then stabilize or progress for 2-month treatment period. In untreated animals all lesions would have continued to progress. Symbols represent the mean and error bars of the standard deviation of three independent readers. b Hard lesion volume (−100 HU to +200 HU) in most lesions the volume growth slows when treatment starts but it is maintained at the same level as the last pretreatment scan (Day 55). Symbols represent the mean and error bars the standard deviation of three independent readers. c Heat map of the lesion-level total PET data for all five animals that were treated with ND10885. Timepoint 2 is the equivalent of Day 55 in panels (a) and (b), the starting point of drug administration. Most lesions in these animals behave in the same way as those shown in panel (a), the total inflammation in each decreases from timepoint 2 to the end of therapy. For each lesion the three bars represent SUVmax, SUVmean and total lesion glycolysis. d The lesional volume change in each lesion for all animals across the same treatment period. Again similar to the pattern shown in panel (b) volume plateaus in most lesions at timepoint 3, 2 weeks after the initiation of treatment. For each lesion two bars are shown, the left bar indicates volume in the hard range (−100 to + 200 HU) while on the right the total lesion volume (from −500 to + 200 HU) is shown. Source data are provided as a Source Data file
Fig. 3
Fig. 3
ND10885 treatment in infected marmosets allows cavity formation. a Lesion pathology at necropsy for marmosets treated with three different drug regimens. HRZE, isoniazid, rifampicin, pyrazinamide, and ethambutol; HS, isoniaizid, and streptomycin (CFU data and PK have been previously published for both control arms; ref. ). Each number refers to an individual animal and each symbol above it describes the pathology of each individual lesion within that animal, the size of the symbol is according to the size of the lesion, small symbols are 1 mm lesions and the largest symbols are ~10 mm lesions. The inset bar graph summarizes the same data according to the total percentage of lesions in each of the three pathology types. Source data are provided as a Source Data file. b an example of PET/CT images of one animal treated with ND10885 over time, the first image is 37 days after infection with a low-dose aerosol of M. tuberculosis, the second image is day 51 and immediately after that image the animal began receiving ND10885. There are two lesions, one on the right and one on the left that progressively cavitate and expel their contents. c Pathology images of one of these cavities showing on the top left the H&E stained slice and on the right the Masson’s Trichrome stain to illustrate the fibrous cavity wall. In both panels the scale bar is 500 μm. The small black box in the H&E slice is shown at ×100 with a 10-μm scale bar with acid-fast staining showing the presence of multiple individual bacilli (circled)
Fig. 4
Fig. 4
NDH-2 is essential for growth with fatty acids. Growth with (a) or without fatty acids (b). Data are representative of two independent experiments. c Growth and survival in the Wayne model of hypoxia. Data are averages of six to eight data points from two independent experiments. Growth and persistence in lungs (d) and spleens (e) of C57BL/6 mice. Data are averages from four mice per time point and representative of two independent infections. Error bars correspond to standard deviation. “Comp” stands for complemented. Statistical significance was assessed by one-way ANOVA followed by post hoc test (Tukey test; GraphPad Prism). Differences between strains in (d) and (e) are not significant. ***P < 0.001; ****P < 0.0001. Source data are provided as a Source Data file
Fig. 5
Fig. 5
NDH-2 is required for redox homeostasis and counteracts inhibition of NDH-1. a Impact of rotenone on growth. b Survival in fatty-acid-free Sauton’s minimal medium supplemented with 50 μg/mL rotenone. c Impact of oleic acid on growth. (d) NADH/NAD + intracellular ratio after 6 h in modified Sauton’s minimal medium supplemented with DMSO (1%, control), or oleic acid (500 μM). Impact of valinomycin (e), nigericin (f), and rifampicin (g) on growth in modified Sauton’s minimal medium supplemented with DMSO (1%; control), or oleic acid at different concentrations (100 μM, 150 μM, and 200 μM). h Proposed mechanism of NDH-2 essentiality in the presence of fatty acids. Data are averages of three data points and representative of at least two independent experiments. Error bars correspond to standard deviation. “Comp” stands for complemented. Statistical significance was assessed by one-way ANOVA followed by post hoc test (Tukey test; GraphPad Prism). *P < 0.05; **P < 0.01; ***P < 0.001; ****P < 0.0001. Source data are provided as a Source Data file
Fig. 6
Fig. 6
Chemical–genetic interactions. a Summary of chemical–genetic interactions. Red lines represent direct interactions that are consistent (solid red lines) or inconsistent (dotted red lines) with the chemical–genetic interactions defined in this study. Brown lines represent chemical–genetic interactions that have been defined in this study and are most likely indirect. Impact of piericidin A (b, h) bedaquiline (c) thioridazine (d), clofazimine (e), DDD00853663 (f), and Q203 (g) on growth. Data are averages of three cultures and represent at least two independent experiments. Error bars correspond to standard deviation. BDQ, bedaquiline; CFZ, clofazimine; PHT, phenothiazines; PIR, piericidin A; PYR, pyridaben; ROT, rotenone; 2-MQ, 2-mercapto-quinazolinones. “Comp” stands for complemented. Source data are provided as a Source Data file

References

    1. Mahajan R. Bedaquiline: First FDA-approved tuberculosis drug in 40 years. Int J. Appl Basic Med. Res. 2013;3:1–2. doi: 10.4103/2229-516X.112228. - DOI - PMC - PubMed
    1. Hards K, et al. Bactericidal mode of action of bedaquiline. J. Antimicrobial Chemother. 2015;70:2028–2037. - PubMed
    1. Cook, G. M., Hards, K., Vilcheze, C., Hartman, T. & Berney, M. Energetics of respiration and oxidative phosphorylation in mycobacteria. Microbiol. Spectr. 2, 10.1128/microbiolspec.MGM2-0015-2013 (2014). - PMC - PubMed
    1. Rao SP, Alonso S, Rand L, Dick T, Pethe K. The protonmotive force is required for maintaining ATP homeostasis and viability of hypoxic, nonreplicating Mycobacterium tuberculosis. Proc. Natl Acad. Sci. USA. 2008;105:11945–11950. doi: 10.1073/pnas.0711697105. - DOI - PMC - PubMed
    1. Griffin JE, et al. High-resolution phenotypic profiling defines genes essential for mycobacterial growth and cholesterol catabolism. PLoS Pathog. 2011;7:e1002251. doi: 10.1371/journal.ppat.1002251. - DOI - PMC - PubMed

Publication types

MeSH terms

LinkOut - more resources