. 2019 Oct 31;6(1):256.
doi: 10.1038/s41597-019-0202-7.

STATegra, a comprehensive multi-omics dataset of B-cell differentiation in mouse

Affiliations

STATegra, a comprehensive multi-omics dataset of B-cell differentiation in mouse

David Gomez-Cabrero et al. Sci Data. .

Abstract

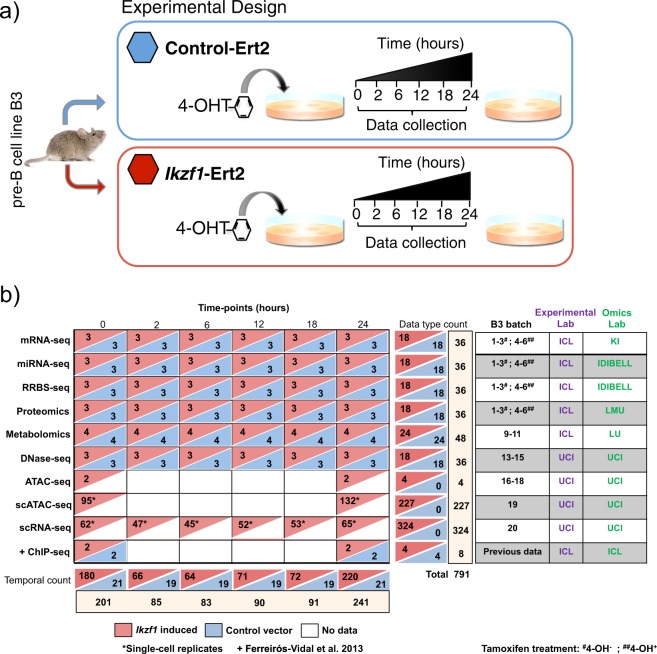
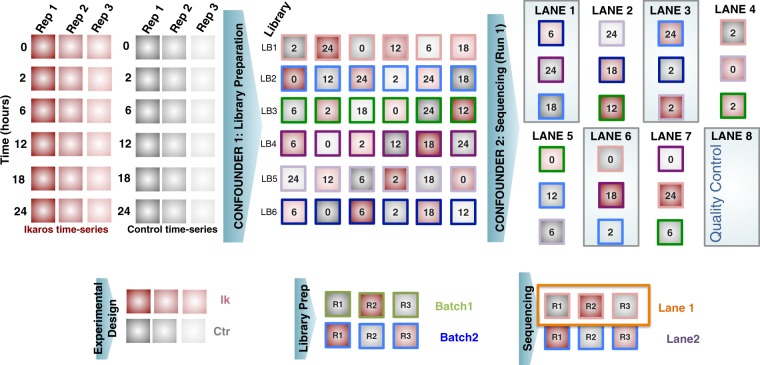
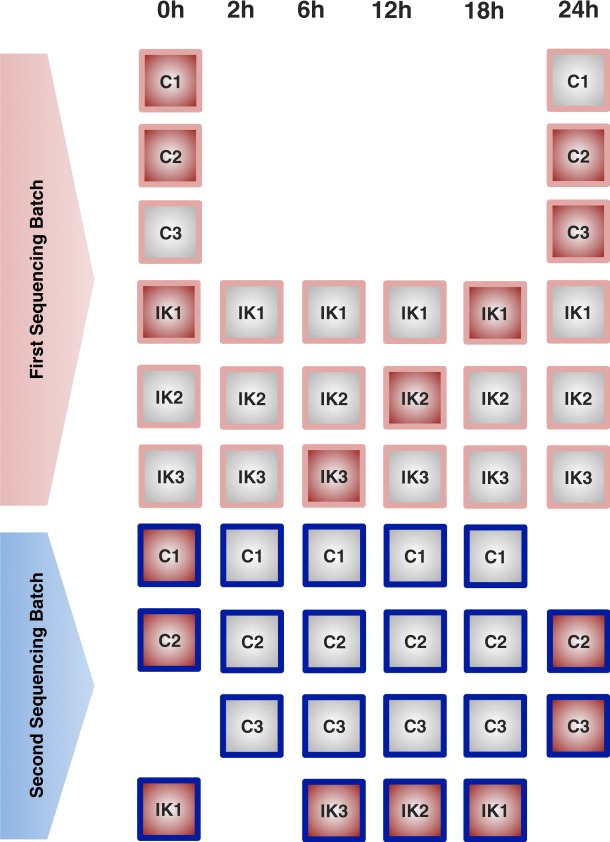
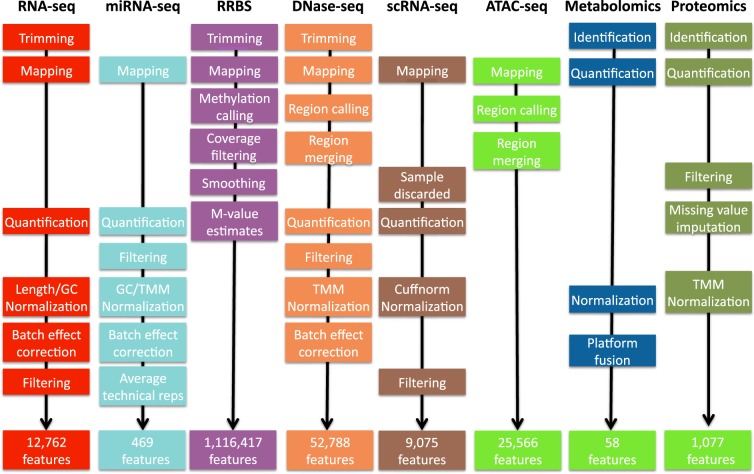
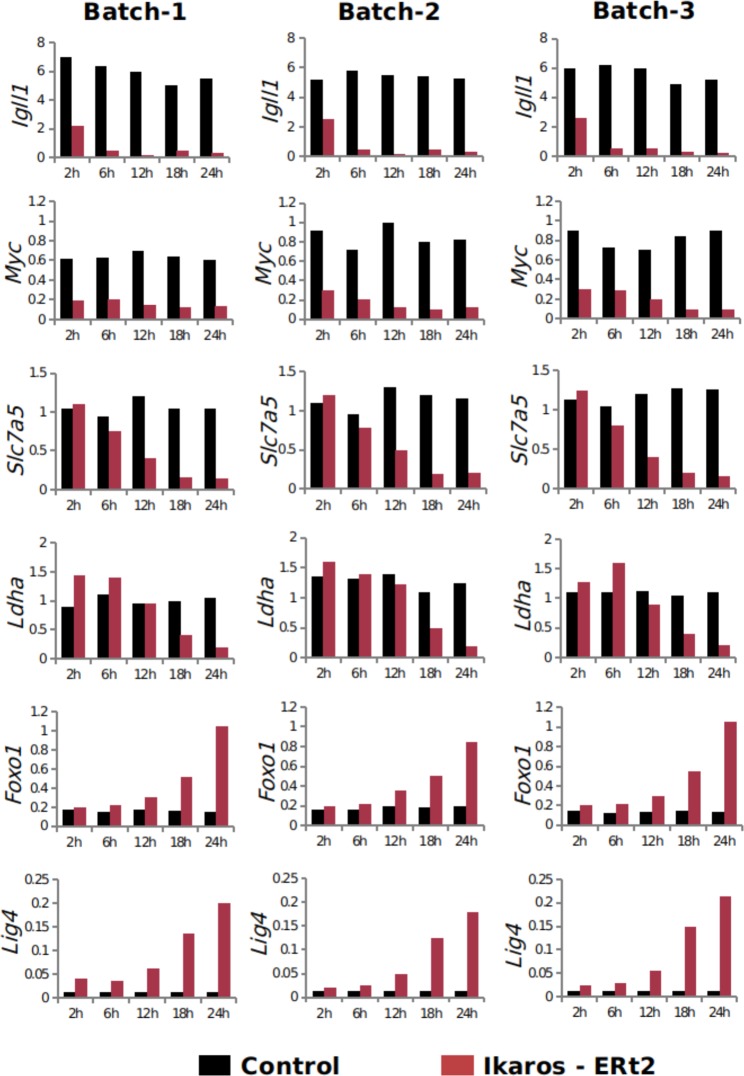
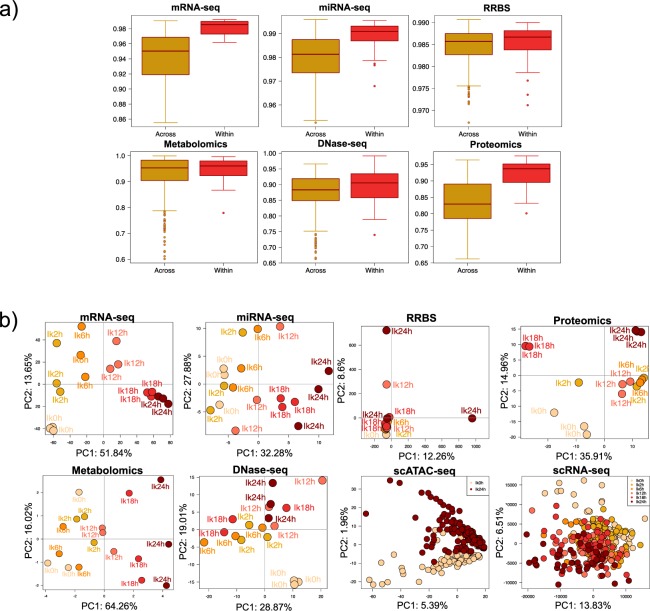
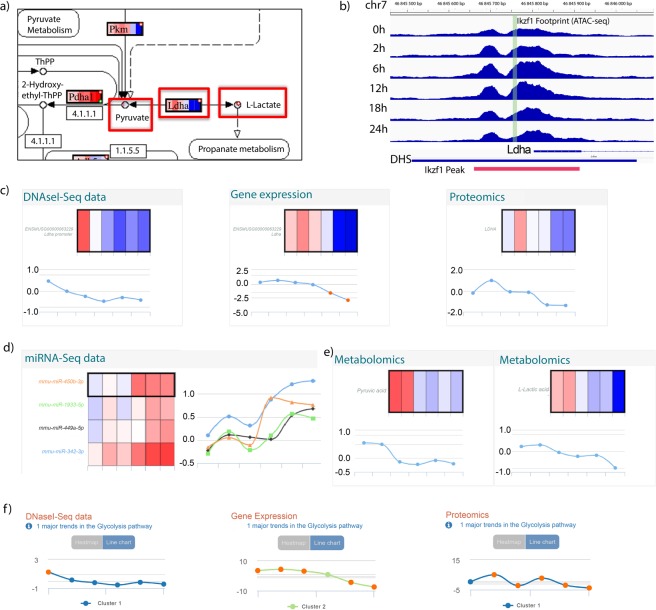
Multi-omics approaches use a diversity of high-throughput technologies to profile the different molecular layers of living cells. Ideally, the integration of this information should result in comprehensive systems models of cellular physiology and regulation. However, most multi-omics projects still include a limited number of molecular assays and there have been very few multi-omic studies that evaluate dynamic processes such as cellular growth, development and adaptation. Hence, we lack formal analysis methods and comprehensive multi-omics datasets that can be leveraged to develop true multi-layered models for dynamic cellular systems. Here we present the STATegra multi-omics dataset that combines measurements from up to 10 different omics technologies applied to the same biological system, namely the well-studied mouse pre-B-cell differentiation. STATegra includes high-throughput measurements of chromatin structure, gene expression, proteomics and metabolomics, and it is complemented with single-cell data. To our knowledge, the STATegra collection is the most diverse multi-omics dataset describing a dynamic biological system.


Conflict of interest statement

The authors declare no competing interests.

Figures

Fig. 1
Fig. 1
STATegra data generation. (a) Inducible Ikaros B3 cell system. Time course experiment collects samples at 6 time-points after Tamoxifen induction of Ikaros expression, Control cells carry empty vector. (b) Diversity of omics platforms, number of biological replicates, batch distribution and lab assignment for B3 cell culture and omic library preparation. Data on each row corresponds to the one omics type on the left. +Previous data from.
Fig. 2
Fig. 2
Experimental design for RNA-seq.
Fig. 3
Fig. 3
Experimental design for small RNA-seq. Two sequencing batches were run. Samples with red filling were repeated at both batches to allow for estimation of batch effects.
Fig. 4
Fig. 4
Preprocessing pipelines for 8 omics technologies. See methods for details.
Fig. 5
Fig. 5
Biomarkers of B3 cell differentiation across three experimental batches.
Fig. 6
Fig. 6
Quality control of STATegra multi-omics data. (a) Distribution of pair-wise correlation values for samples belonging to different (Across) or the same (Within) experimental conditions. (b) PCA analysis. Only the Ikaros series is shown. Data were preprocessed as described in Methods. Time progression is represented by an increasingly darker red color.
Fig. 7
Fig. 7
STATegra data for lactate dehydrogenase A. (a) LDHA reaction at glycolysis. (b) Promoter regions of the Ldha gene showing a DHS and IKZF1 footprint identified by DNase-seq. Only values for the Ikaros-induced time course are shown. In red, the IKZF1 ChIP-seq peak region. (ce) Paintomics representation for Ldha data as heatmaps and line plots of log2FC values between Ikaros and Control. Data points correspond, from left to right, to 0, 2, 6, 12, 18 and 24 hours after Ikaros induction. At heatmaps, red indicates up-regulation and blue indicates down-regulation. (c) Ldha data for DNase-seq, RNA-seq, Proteomics. (d) Data for miRNA-seq where miRNA-Ldha target data was predicted by at least 5 algorithms in the mirWalk database. (e) STATegra log2FC values for pyruvate (left) and lactate (right). (f) Major Gene Expression, Proteomics, and DNase-seq trends for glycolysis pathway computed by Paintomics.

References

    1. Gomez-Cabrero D, et al. Data integration in the era of omics: current and future challenges. BMC Systems Biology. 2014;8:I1. doi: 10.1186/1752-0509-8-S2-I1. - DOI - PMC - PubMed
    1. Belton J-M, et al. Hi-C: a comprehensive technique to capture the conformation of genomes. Methods (San Diego, Calif.) 2012;58:268–276. doi: 10.1016/j.ymeth.2012.05.001. - DOI - PMC - PubMed
    1. Buenrostro JD, Wu B, Chang HY, Greenleaf WJ. ATAC-seq: A Method for Assaying Chromatin Accessibility Genome-Wide. Current Protocols in Molecular Biology. 2015;109:21.29.21–21.29.29. - PMC - PubMed
    1. Song L, Crawford GE. DNase-seq: a high-resolution technique for mapping active gene regulatory elements across the genome from mammalian cells. Cold Spring Harb Protoc. 2010;2010:pdb prot5384. doi: 10.1101/pdb.prot5384. - DOI - PMC - PubMed
    1. Johnson DS, Mortazavi A, Myers RM, Wold B. Genome-wide mapping of in vivo protein-DNA interactions. Science. 2007;316:1497–1502. doi: 10.1126/science.1141319. - DOI - PubMed