

A comparative assessment of conventional and molecular methods, including MinION nanopore sequencing, for surveying water quality
- PMID: 31673047
- PMCID: PMC6823499
- DOI: 10.1038/s41598-019-51997-x
A comparative assessment of conventional and molecular methods, including MinION nanopore sequencing, for surveying water quality
Abstract
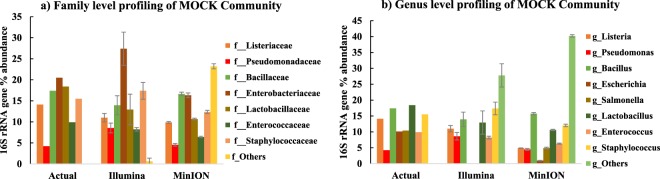
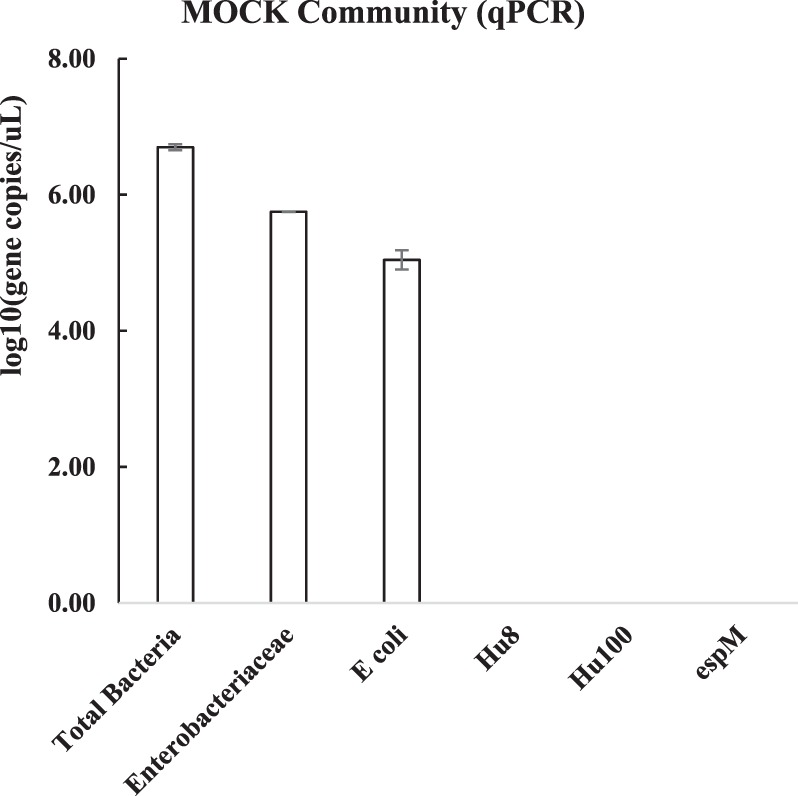
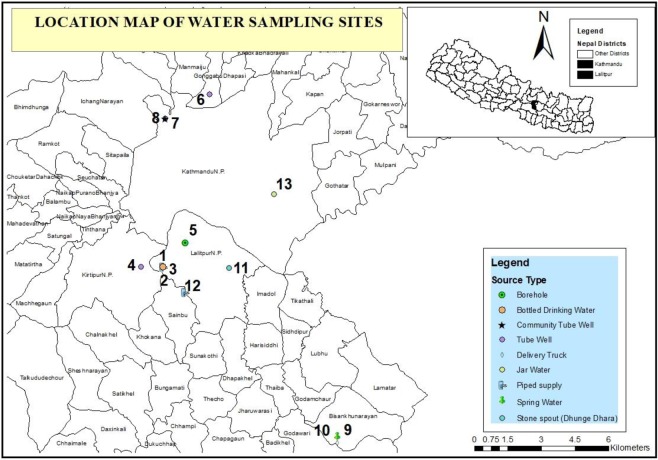
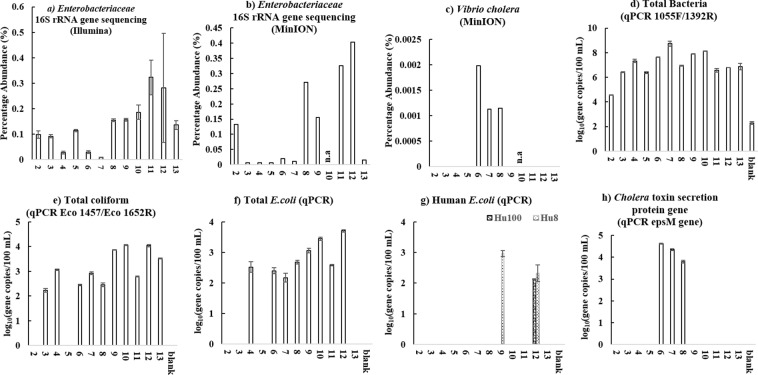
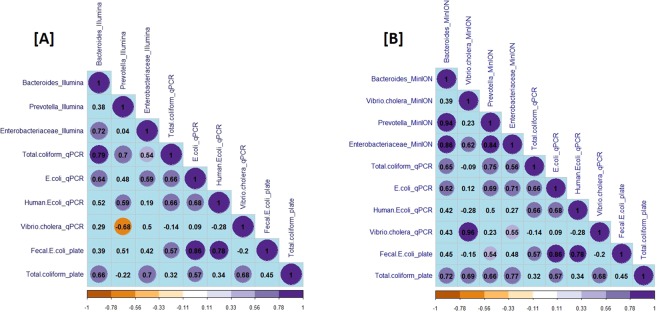
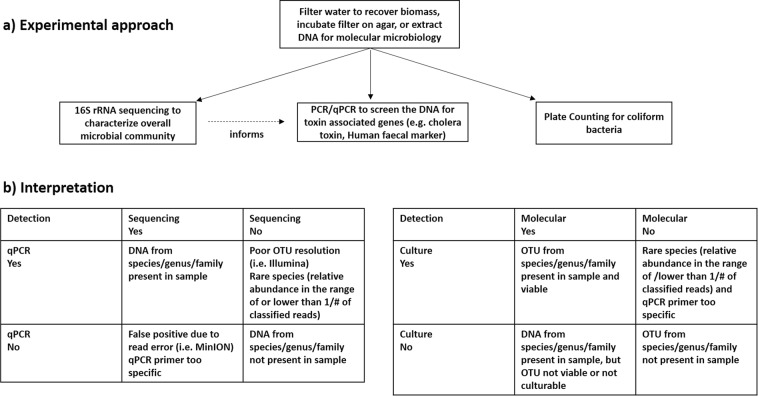
Nucleic acid based techniques, such as quantitative PCR (qPCR) and next generation sequencing (NGS), provide new insights into microbial water quality, but considerable uncertainty remains around their correct interpretation. We demonstrate, for different water sources in informal settlements in the Kathmandu Valley, Nepal, significant Spearman rank correlations between conventional and molecular microbiology methods that indicate faecal contamination. At family and genera level, 16S rRNA amplicon sequencing results obtained with the low-cost, portable next generation sequencer MinION from Oxford Nanopore Technologies had significant Spearman rank correlations with Illumina MiSeq sequencing results. However, method validation by amplicon sequencing of a MOCK microbial community revealed the need to ascertain MinION sequencing results for putative pathogens at species level with complementary qPCR assays. Vibrio cholerae hazards were poorly associated with plate count faecal coliforms, but flagged up by the MinION screening method, and confirmed by a qPCR assay. Plate counting methods remain important to assess viability of faecal coliforms in disinfected water sources. We outline a systematic approach for data collection and interpretation of such complementary results. In the Kathmandu Valley, there is high variability of water quality from different sources, including for treated water samples, illustrating the importance of disinfection at the point of use.
Conflict of interest statement
The authors declare no competing interests.
Figures
References
-
- UN. United Nations Sustainable Development Goals, https://sustainabledevelopment.un.org/ (2019).
-
- Warner NR, Levy J, Harpp K, Farruggia F. Drinking water quality in Nepal’s Kathmandu Valley: a survey and assessment of selected controlling site characteristics. Hydrogeology Journal. 2008;16:321–334. doi: 10.1007/s10040-007-0238-1. - DOI
-
- Subedi M, Aryal M. Public perception about drinking jar water and its bacteriological analysis. Nepal Med Coll J. 2010;12:110–114. - PubMed
-
- Silvanus V, Gupta RK, Shreshta SR. Assessment of Water Supply and Microbial Quality of Water Among Schools in The Rural Kathmandu Valley, Nepal. Nepal Med Coll J. 2016;18:44–47.
Publication types
MeSH terms
Substances
LinkOut - more resources
Full Text Sources
Other Literature Sources
