. 2019 Oct 31;9(1):15740.
doi: 10.1038/s41598-019-51942-y.

Ionic transport through a protein nanopore: a Coarse-Grained Molecular Dynamics Study

Affiliations

Ionic transport through a protein nanopore: a Coarse-Grained Molecular Dynamics Study

Nathalie Basdevant et al. Sci Rep. .

Abstract

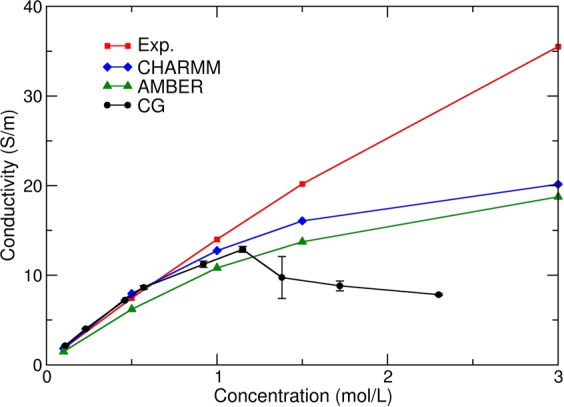
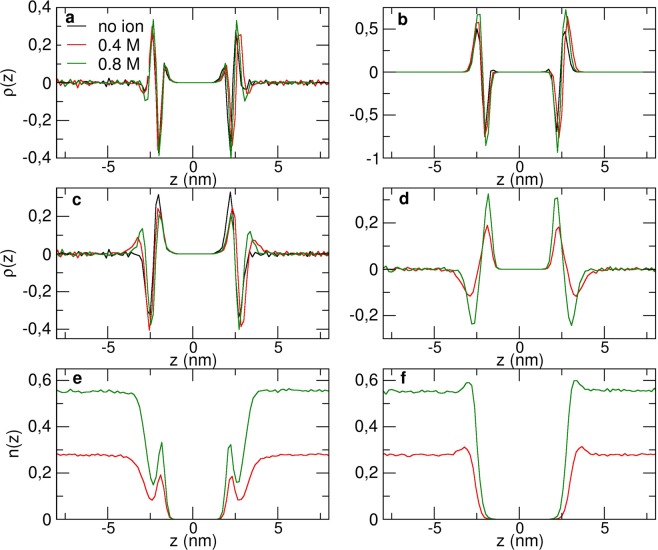
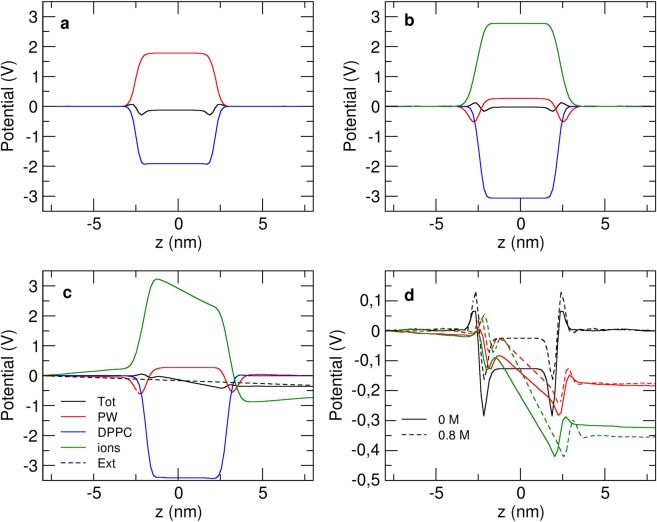
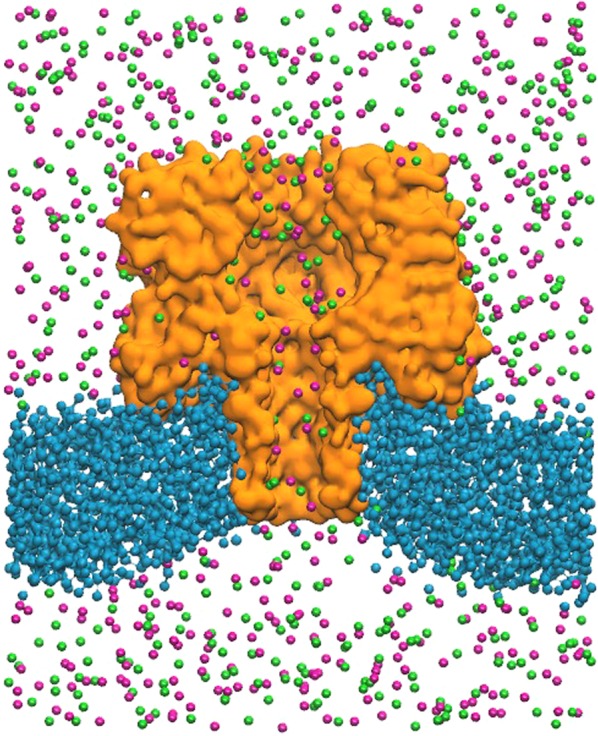
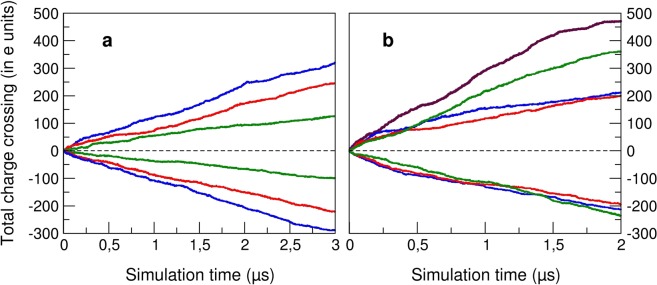
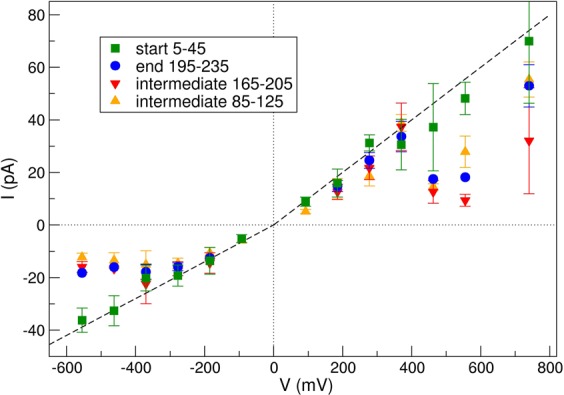
The MARTINI coarse-grained (CG) force field is used to test the ability of CG models to simulate ionic transport through protein nanopores. The ionic conductivity of CG ions in solution was computed and compared with experimental results. Next, we studied the electrostatic behavior of a solvated CG lipid bilayer in salt solution under an external electric field. We showed this approach correctly describes the experimental conditions under a potential bias. Finally, we performed CG molecular dynamics simulations of the ionic transport through a protein nanopore (α-hemolysin) inserted in a lipid bilayer, under different electric fields, for 2-3 microseconds. The resulting I - V curve is qualitatively consistent with experiments, although the computed current is one order of magnitude smaller. Current saturation was observed for potential biases over ±350 mV. We also discuss the time to reach a stationary regime and the role of the protein flexibility in our CG simulations.


Conflict of interest statement

The authors declare no competing interests.

Figures

Figure 1
Figure 1
Ionic conductivity of KCl as a function of molarity. Experimental results (in red) and all-atom simulations using the CHARMM (blue) and AMBER (green) force field performed by Pezeshki et al. for KCl at 320 K, and CG results (black) computed with our CG MARTINI MD simulations.
Figure 2
Figure 2
(a) Total linear charge density along the z axis around a CG DPPC bilayer with (0.4 M in red and 0.8 M in green) and without ions (in black), and its decomposition: (b) DPPC charge density, (c) solvent, (d) ions. (ef): Particle density for K+ (e) and Cl (f) ions. The z axis is centered at the middle of the lipid bilayer.
Figure 3
Figure 3
(ac) Total electric potential along the z axis of a CG DPPC membrane (black) and its decomposition, without ions (a), with 0.8 M ionic concentration (b), with no external electric field, and in the presence of an external electric field of 0.02 V/nm (c). (d) Total electrostatic potentials with no electric field (black), electric fields of 0.01 V/nm (red) and 0.02 V/nm (green) without ions (solid line) and with 0.4 M and 0.8 M concentrations (dashed lines).
Figure 4
Figure 4
Representation of simulation setup. Water has been removed for clearness purposes. Section of the pore (orange) along the z axis. The DPPC membrane (blue) is curved. K+ (green) and Cl (magenta) ions are going through the pore channel.
Figure 5
Figure 5
Cumulative current as a function of time, for potentials (a) under or (b) over 300 mV computed during 3 or 2 μs, respectively. (a): ±92 mV (green), ±185 mV (red) and ±277 mV (blue). (b): ±370 mV (green), ±462 mV (red), ±555 mV (blue) and ±740 mV (violet).
Figure 6
Figure 6
Average current during different passages windows as a function of potential bias. Note the difference between the beginning of the simulation (5–45 crossings) and the end of the simulation (195–235 crossings). The black solid line corresponds to Iref/10.

References

    1. Kasianowicz JJ, Brandin E, Branton D, Deamer DW. Characterization of individual polynucleotide molecules using a membrane channel. Proc. Natl. Acad. Sci. 1996;93:13770–13773. doi: 10.1073/pnas.93.24.13770. - DOI - PMC - PubMed
    1. Dudko OK, Mathé J, Meller A. Nanopore force spectroscopy tools for analyzing single biomolecular complexes. Methods Enzymol. 2010;475:565–589. doi: 10.1016/S0076-6879(10)75021-7. - DOI - PubMed
    1. Meller A, Nivon L, Brandin E, Golovchenko J, Branton D. Rapid nanopore discrimination between single polynucleotide molecules. Proc. Natl. Acad. Sci. 2000;97:1079–1084. doi: 10.1073/pnas.97.3.1079. - DOI - PMC - PubMed
    1. Oukhaled, G. et al. Unfolding of Proteins and Long Transient Conformations Detected by Single Nanopore Recording. Phys. Rev. Lett. 98, 158101, 10.1103/PhysRevLett.98.158101 (2007). - PubMed
    1. Oukhaled G, Bacri L, Mathé J, Pelta J, Auvray L. Effect of screening on the transport of polyelectrolytes through nanopores. EPL (Europhysics Lett. 2008;82:48003. doi: 10.1209/0295-5075/82/48003. - DOI

Publication types