Deep learning-based image quality improvement for low-dose computed tomography simulation in radiation therapy
- PMID: 31673567
- PMCID: PMC6811730
- DOI: 10.1117/1.JMI.6.4.043504
Deep learning-based image quality improvement for low-dose computed tomography simulation in radiation therapy
Abstract
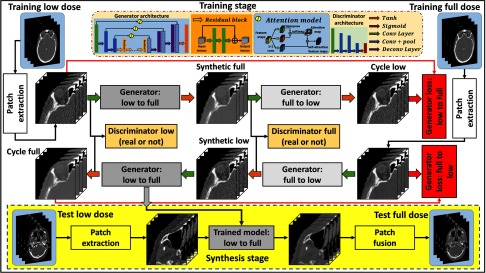
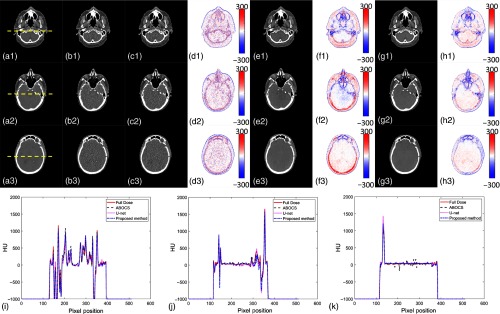
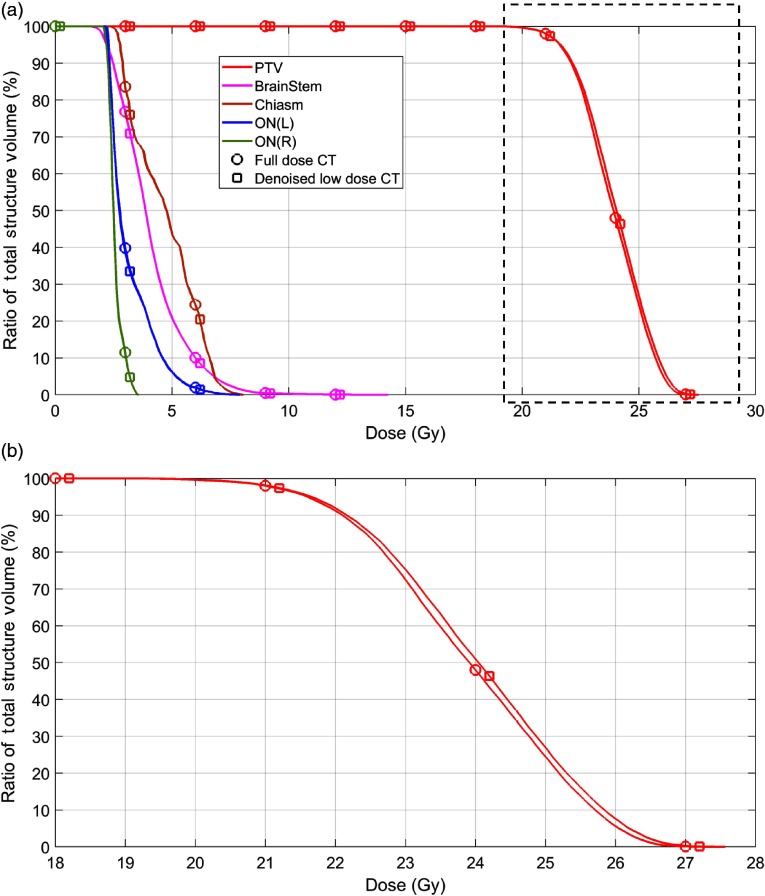
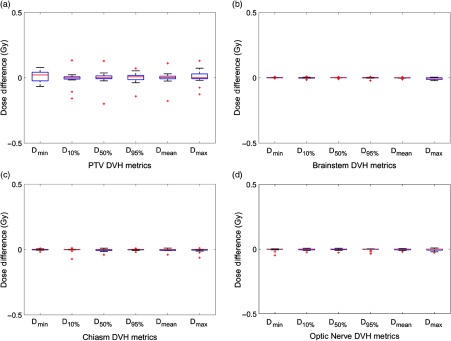
Low-dose computed tomography (CT) is desirable for treatment planning and simulation in radiation therapy. Multiple rescanning and replanning during the treatment course with a smaller amount of dose than a single conventional full-dose CT simulation is a crucial step in adaptive radiation therapy. We developed a machine learning-based method to improve image quality of low-dose CT for radiation therapy treatment simulation. We used a residual block concept and a self-attention strategy with a cycle-consistent adversarial network framework. A fully convolution neural network with residual blocks and attention gates (AGs) was used in the generator to enable end-to-end transformation. We have collected CT images from 30 patients treated with frameless brain stereotactic radiosurgery (SRS) for this study. These full-dose images were used to generate projection data, which were then added with noise to simulate the low-mAs scanning scenario. Low-dose CT images were reconstructed from this noise-contaminated projection data and were fed into our network along with the original full-dose CT images for training. The performance of our network was evaluated by quantitatively comparing the high-quality CT images generated by our method with the original full-dose images. When mAs is reduced to 0.5% of the original CT scan, the mean square error of the CT images obtained by our method is , with respect to the original full-dose images. The proposed method successfully improved the noise, contract-to-noise ratio, and nonuniformity level to be close to those of full-dose CT images and outperforms a state-of-the-art iterative reconstruction method. Dosimetric studies show that the average differences of dose-volume histogram metrics are ( ). These quantitative results strongly indicate that the denoised low-dose CT images using our method maintains image accuracy and quality and are accurate enough for dose calculation in current CT simulation of brain SRS treatment. We also demonstrate the great potential for low-dose CT in the process of simulation and treatment planning.
Keywords: computed tomography; low dose; machine learning; radiation therapy.
© 2019 Society of Photo-Optical Instrumentation Engineers (SPIE).
Figures