. 2019 Dec 17;14(24):2061-2074.
doi: 10.1002/cmdc.201900349. Epub 2019 Nov 19.

Quinoline-Conjugated Ruthenacarboranes: Toward Hybrid Drugs with a Dual Mode of Action

Affiliations

Quinoline-Conjugated Ruthenacarboranes: Toward Hybrid Drugs with a Dual Mode of Action

Marta Gozzi et al. ChemMedChem. .

Abstract

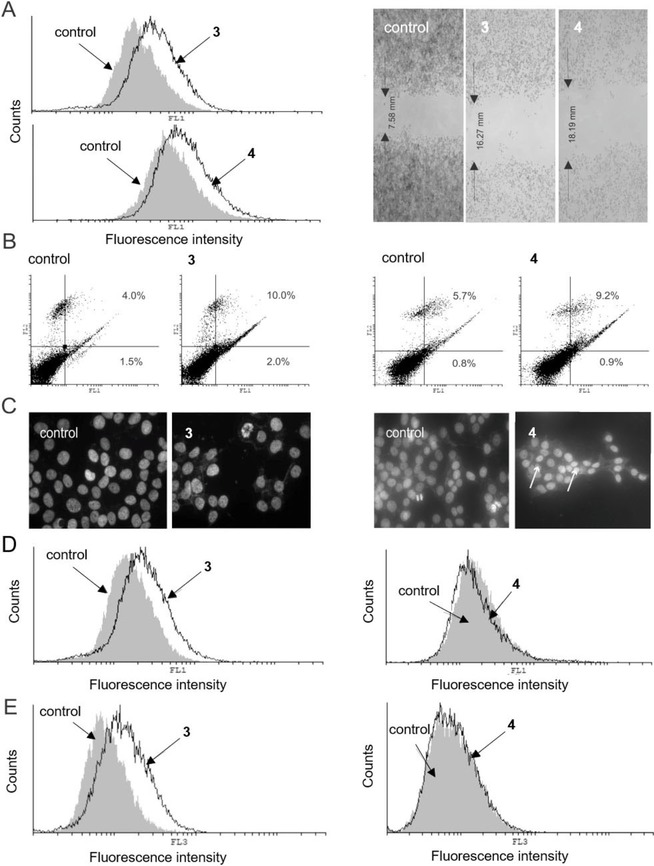
The role of autophagy in cancer is often complex, ranging from tumor-promoting to -suppressing effects. In this study, two novel hybrid molecules were designed, containing a ruthenacarborane fragment conjugated with a known modulator of autophagy, namely a quinoline derivative. The complex closo-[3-(η6 -p-cymene)-1-(quinolin-8-yl-acetate)-3,1,2-RuC2 B9 H10 ] (4) showed a dual mode of action against the LN229 (human glioblastoma) cell line, where it inhibited tumor-promoting autophagy, and strongly inhibited cell proliferation, de facto blocking cellular division. These results, together with the tendency to spontaneously form nanoparticles in aqueous solution, make complex 4 a very promising drug candidate for further studies in vivo, for the treatment of autophagy-prone glioblastomas.

Keywords: autophagy; glioblastoma; quinoline; ruthenacarborane; self-assembly.


Conflict of interest statement

The authors declare no conflict of interest.

Figures

Figure 1
Figure 1
Molecular structure of quinoline‐conjugated ruthenacarboranes 4 and 5, synthesized in this work (right). The lead organic structure (chloroquine, CQ) is shown on the left. The 1‐aza‐naphthalene heterocycle is highlighted in blue.
Scheme 1
Scheme 1
Synthetic approaches to target ruthenacarborane complexes 4 and 5, from closo‐carborane derivative 1. (a) i) KOH (3.5 eq.), EtOH, reflux, 21 h; ii) HClaq. (b) NaF (5.0 eq.), EtOH/H2O 3 : 2 (v/v), 90 °C, 18 h. (c) i) TlOEt (3.0 eq.), THF, −35 °C to rt, 2 h; ii) [{(η 6p‐cymene)RuCl(μ‐Cl)}2] (0.5 eq.), CH2Cl2(deg.), −65 °C to rt, 18 h; iii) HClaq. (d) Boc2O (1.5 eq.), 8‐hydroxyquinoline (for 4, 6) or [(7‐chloroquinolin‐4‐yl)oxy]butan‐1‐ol (for 5) (1.25 eq.), NaNH2 (1.25 eq.), CH2Cl2/pyridine 10 : 1 (v/v), −35 °C to rt, 19 h.
Figure 2
Figure 2
Molecular structures of 1 (left) and 3 (right). Thermal ellipsoids at 50 % probability level. Labelling of selected atoms is given.
Figure 3
Figure 3
Time‐resolved UV‐vis spectra of 4 (left) and 8‐HQ (right) in PBS solution, at 23 °C (top) and 37 °C (bottom). 3 in PBS solution is also shown, as reference. Vol% DMSO is 1 % for all samples. λmax 240 and 256 nm (characteristic of the quinoline group) are marked in all spectra. For 4 at 23 °C (top left), the black arrow indicates the time evolution of the band at λ240. Red indicates bands characteristic of 4 only, purple of 8‐HQ only. * highlights the two sharp transitions for 4. For 4, the red arrow indicates the time‐evolution (decrease) of the sharp band at λ314, the red‐to‐purple arrow indicates the red shift of the broad band, from 250–320 nm (characteristic of 4, red) to 290–340 nm (characteristic of 8‐HQ, purple).
Figure 4
Figure 4
Size distribution of 3 and BSA−3 (left), and 4 and BSA−4 (right) in PBS, from NTA measurements. Ratio BSA:metallacarborane was 10 : 1 or 1 : 1. [3]=[4]=20 μM. [BSA]=20 (BSA1) or 200 (BSA10) μM. Vol% DMSO is 1 % in all samples. Dilution factors are the same for all samples. Samples were measured 3.5–6 h after preparation. The respective blanks (BSA alone) are also shown. Standard deviation (SD) for particle concentration is ±2.3–3.1×10⁷ (samples with 3) and ±1.5–2.4×10⁷ (samples with 4) particles mL−1, for particle size ±5–16 nm.
Figure 5
Figure 5
Results from flow cytometric and fluorescence microscopy analysis, and wound healing assay of MCF‐7 cells incubated (72 h) with 3 and 4 at 20 μM. (A) CFSE staining (left panel) and wound healing assay (right panel); (B) AnnV/PI double staining; (C) DAPI‐stained cells observed under fluorescence microscope (magnification X200). Arrows indicate apoptotic cells; (D) ApoStat staining; (E) AO staining. Experiments were run in triplicate. One representative example per each experiment is shown. For each staining protocol, the respective control (untreated cells) is also shown. (FL1, green channel; FL2, orange channel; FL3, dark red channel).
Figure 6
Figure 6
Results from flow cytometric and fluorescence microscopy analysis, wound healing assay and western blot analysis of LN229 cells incubated (72 h) with 4, at 40 μM. (A) AO staining (left panel) and western blot (right panel). Cells incubated (72 h) with 3 are also shown, for comparison; (B) AnnV/PI double staining; (C) DAPI‐stained cells observed under fluorescence microscope (magnification X200). Arrows indicate apoptotic cells; (D) CFSE staining (left panel) and wound healing assay (right panel). Experiments were run in triplicate. One representative example per each experiment is shown. For each staining protocol, the respective control (untreated cells) is also shown. (FL1, green channel; FL2, orange channel; FL3, dark red channel).

References

    1. Hey-Hawkins E., Viñas Teixidor C. (Eds.) Boron-Based Compounds, John Wiley & Sons, Ltd, Chichester, UK, 2018.
    1. Barth R. F., Mi P., Yang W., Cancer Commun. 2018, 38, 35. - PMC - PubMed
    1. None
    1. Stockmann P., Gozzi M., Kuhnert R., Sárosi M. B., Hey-Hawkins E., Chem. Soc. Rev. 2019, 48, 3497–3512; - PubMed
    1. Zargham E. O., Mason C. A., M. W. Lee Jr , Int. J. Cancer Res. 2019, 6;

Publication types

MeSH terms

LinkOut - more resources