. 2019 Nov 1;15(11):e1008432.
doi: 10.1371/journal.pgen.1008432. eCollection 2019 Nov.

UMAP reveals cryptic population structure and phenotype heterogeneity in large genomic cohorts

Affiliations

UMAP reveals cryptic population structure and phenotype heterogeneity in large genomic cohorts

Alex Diaz-Papkovich et al. PLoS Genet. .

Abstract

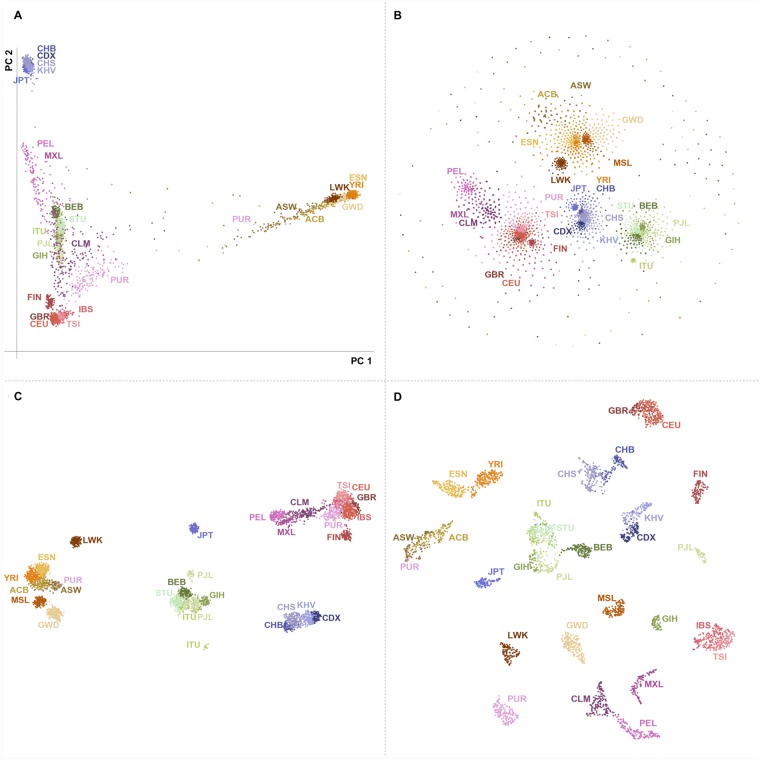
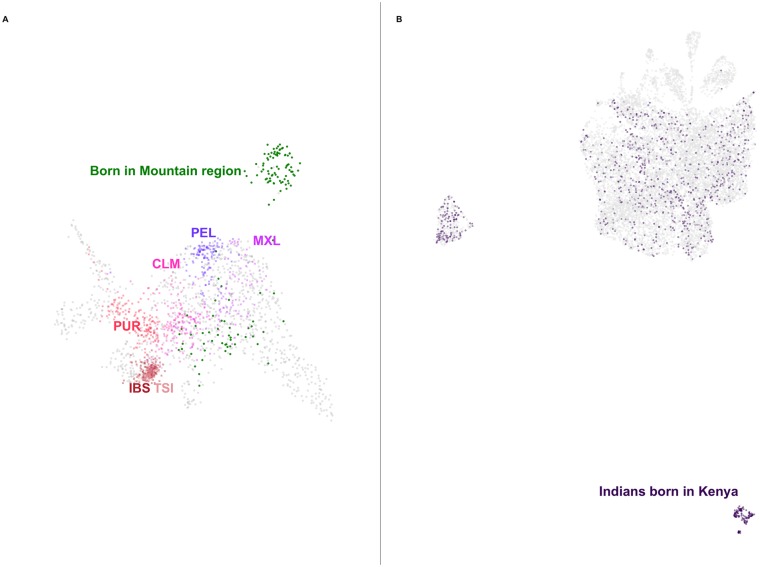
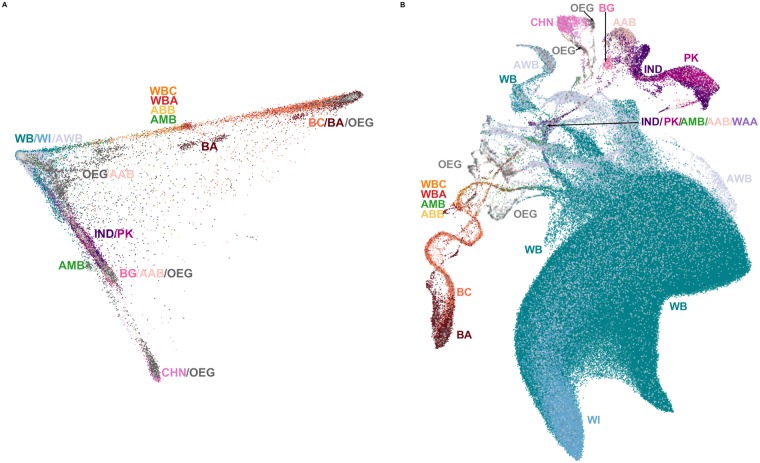
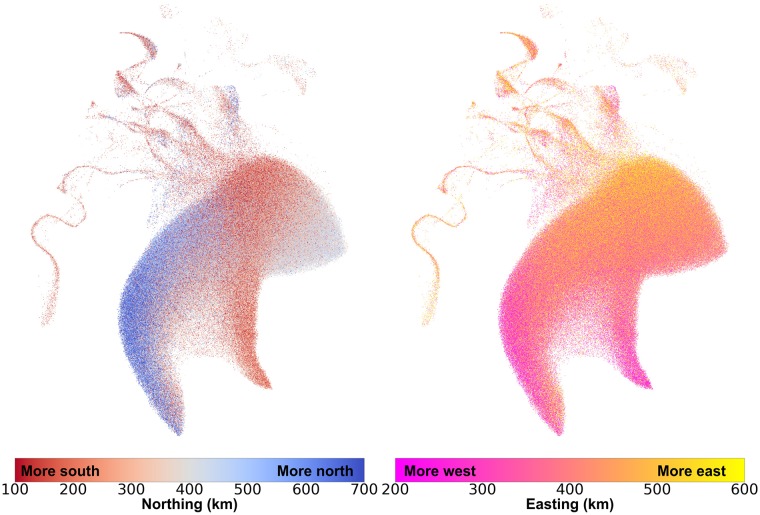
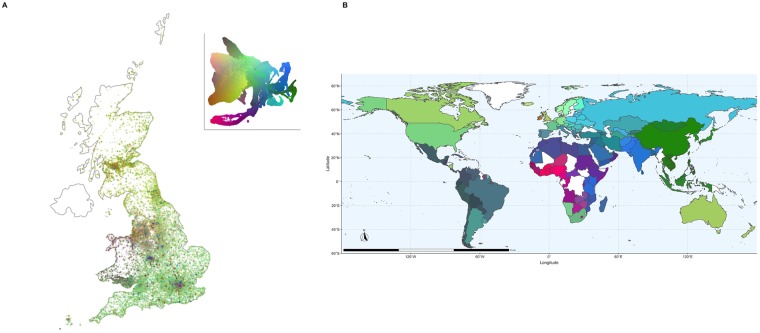
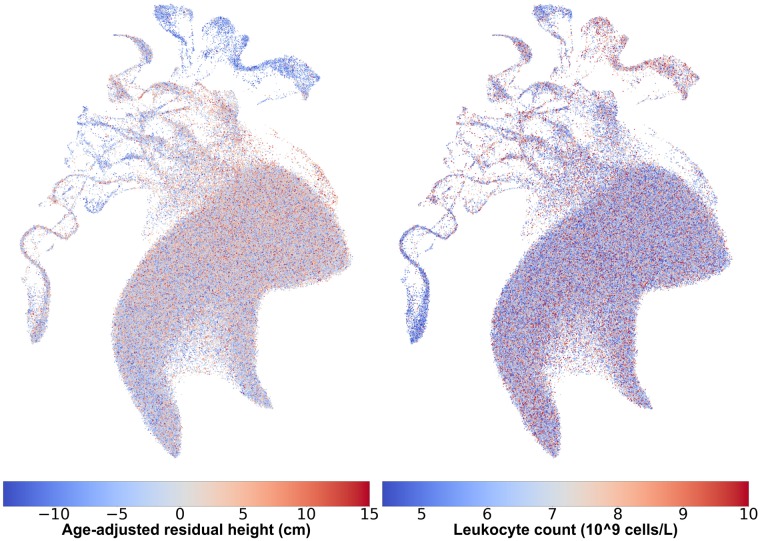
Human populations feature both discrete and continuous patterns of variation. Current analysis approaches struggle to jointly identify these patterns because of modelling assumptions, mathematical constraints, or numerical challenges. Here we apply uniform manifold approximation and projection (UMAP), a non-linear dimension reduction tool, to three well-studied genotype datasets and discover overlooked subpopulations within the American Hispanic population, fine-scale relationships between geography, genotypes, and phenotypes in the UK population, and cryptic structure in the Thousand Genomes Project data. This approach is well-suited to the influx of large and diverse data and opens new lines of inquiry in population-scale datasets.


Conflict of interest statement

The authors have declared that no competing interests exist.

Figures

Fig 1
Fig 1. Four methods of dimension reduction of 1KGP genotype data with population labels.
(A) PCA maps individuals in a triangle with vertices corresponding to African, Asian, and European continental ancestry. Discarding lower-variance PCs leads to overlap of populations with no close affinity, such as Central and South American populations with South Asians. (B) t-SNE forms groups corresponding to continents, with some overlap between European and Central and South American people. Smaller subgroups are visible within continental clusters. The cloud of peripheral points results from the method’s poor convergence. (C) UMAP forms distinct clusters related to continent with clearly defined subgroups. Japanese, Finnish, Luhya, and some Punjabi and Telugu populations form separate clusters consistent with their population history [12]. (D) UMAP on the first 15 principal components forms fine-scale clusters for individual populations. Groups closely related by ancestry or geography, such as African Caribbean/African American, Spanish/Italian, and Kinh/Dai populations cluster together. Results using t-SNE on principal components are presented in S1 Fig. Axes in UMAP and t-SNE are arbitrary. Since the algorithms prioritize local distances, long distances between clusters are not meaningful. ACB, African Caribbean in Barbados; ASW, African Ancestry in Southwest US; BEB, Bengali; CDX, Chinese Dai; CEU, Utah residents with Northern/Western European ancestry; CHB, Han Chinese; CHS, Southern Han Chinese; CLM, Colombian in Medellin, Colombia; ESN, Esan in Nigeria; FIN, Finnish; GBR, British in England and Scotland; GWD, Gambian; GTH, Gujarati; IBS, Iberian in Spain; ITU, Indian Telugu in the UK; JPT, Japanese; KHV, Kinh in Vietnam; LWK, Luhya in Kenya; MSL, Mende in Sierra Leone; MXL, Mexican in Los Angeles, California; PEL, Peruvian; PJL, Punjabi in Lahore, Pakistan; PUR, Puerto Rican; STU, Sri Lankan Tamil in the UK; TSI, Toscani in Italy; YRI, Yoruba in Nigeria.
Fig 2
Fig 2. Applying UMAP to subsets of data can reveal deep population structure.
(A) UMAP on the top 7 principal components of the self-identified Hispanic population of the HRS reveals a cluster. Colouring the points by birthplace shows they were born almost entirely in the Mountain region (in green) of the United States (New Mexico, Arizona, Colorado, Utah, Nevada, Wyoming, Idaho, and Montana). When populations from the 1KGP are projected onto the UMAP embedding they do not map to the cluster. Six 1KGP populations are presented: CLM, Colombian in Medellin, Colombia; IBS, Iberian in Spain; MXL, Mexican in Los Angeles, California; PEL, Peruvian; PUR, Puerto Rican; TSI, Toscani in Italy. S11 and S12 Figs present the same projection of individuals from the HRS coloured by estimated admixture proportions census region of birth, respectively. (B) UMAP on the top 8 principal components of the self-identified Asian populations of the UKBB creates clusters. Indian individuals born in Kenya (in purple) form one such cluster. A version coloured by self-identified ethnicity is presented in S13 Fig.
Fig 3
Fig 3. The UKBB coloured by self-reported ethnic background.
(A) The first two principal components, showing the usual triangle with vertices corresponding to African, Asian, and European ancestries, and intermediate values indicating admixture or lack of relationship to the vertex populations. (B) UMAP on the first 10 principal components. The cluster of White British and White Irish individuals is greatly expanded, with the Irish forming a distinct sub cluster mixed with the White British population. South Asian and East Asian individuals form their separate clusters, as do individuals of African or Caribbean backgrounds. Population clusters are connected by “trails” comprised of large proportions of individuals with mixed backgrounds. BA, Black African; BC, Black Caribbean; BG, Bangladeshi; CHN, Chinese; IND, Indian; PK, Pakistani; WB, White British; WI, White Irish; WBC, White and Black Caribbean; WBA, White and Black African; WAA, White and Asian; AAB, Any other Asian Background; ABB, Any other Black Background; AWB, Any other White Background; AMB, Any other Mixed Background; OEG, Other ethnic group.
Fig 4
Fig 4. UMAP captures relationships between population structure and geography.
Each individual is coloured by their geographical coordinates of residence. Coordinates follow the UKBB’s OSGB1936 geographic grid system and represent distance from the Isles of Scilly, which lie southwest of Great Britain. The left image colours individuals by their north-south (“northing”) coordinates, and the right image colours them by their east-west (“easting”) coordinates. Adding more components creates finer clusters (S17 and S18 Figs). Northing values were truncated between 100km and 700km, and easting values were truncated between 200km and 600km.
Fig 5
Fig 5. Maps coloured by 3D UMAP projections of the top 20 principal components of the UKBB.
Each individual is assigned a 3D RGB vector based on 3D UMAP coordinates (a flattened projection is in the top right of panel A). Individuals who are closer to each other in the projection will be closer in colour in the maps. More details on colouring, as well as randomization of points to protect participant privacy, are available in the materials and methods. (A) Each point is an individual placed based on where they live. Patterns in genetic similarity are visible in Scotland, South England, North and South Wales, the East and West Midlands, and major urban centres. (B) Geographic distribution of UMAP coordinates. Using the country of birth of individuals in the UKBB, we colour countries by the closeness in 3D UMAP space of those born there. Broad patterns of similarity appear in East Asia, South Asia, North African and the Middle East, West Africa, and South America. Differences between neighbouring countries can reflect both ancient population structure and recent differences in migration history. Evidence of migrations related to colonialism are visible with, e.g., European ancestry in South Africa and South Asian ancestry in Kenya and Tanzania. Because of the large number of White British individuals born abroad, to avoid skewing the colour scale they were not included unless they were born in the UK, Europe, Australia, Canada, or the United States, where UKBB participants already tended to have European ancestry. Zoomed maps of East Asia, the Caribbean, and Europe are available in S19, S20, and S21 Figs, respectively.
Fig 6
Fig 6. UMAP captures relationships between population structure and phenotype heterogeneity.
Females from the UMAP projection in Fig 3B, coloured by age-adjusted difference from mean population height (left) and leukocyte counts (right). Individuals with missing data were excluded. To protect participant privacy, data in these images has been randomized as explained in the materials and methods section.

References

    1. Lawson DJ, Hellenthal G, Myers S, Falush D (2012) Inference of population structure using dense haplotype data. PLOS Genetics 8(1):e1002453 10.1371/journal.pgen.1002453 - DOI - PMC - PubMed
    1. Novembre J, Peter BM (2016) Recent advances in the study of fine-scale population structure in humans. Current Opinion in Genetics & Development 41:98–105. 10.1016/j.gde.2016.08.007 - DOI - PMC - PubMed
    1. Spence JP, Steinrücken M, Terhorst J, Song YS (2018) Inference of population history using coalescent hmms: review and outlook. Current Opinion in Genetics & Development 53:70–76. 10.1016/j.gde.2018.07.002 - DOI - PMC - PubMed
    1. Patterson N, Price AL, Reich D (2006) Population structure and eigenanalysis. PLOS Genetics 2(12):1–20. 10.1371/journal.pgen.0020190 - DOI - PMC - PubMed
    1. Hellenthal G, et al. (2014) A genetic atlas of human admixture history. Science 343(6172):747–751. 10.1126/science.1243518 - DOI - PMC - PubMed

Publication types

Grants and funding