. 2019 Oct 31;179(4):964-983.e31.
doi: 10.1016/j.cell.2019.10.007.

Integrated Proteogenomic Characterization of Clear Cell Renal Cell Carcinoma

David J Clark  1 Saravana M Dhanasekaran  2 Francesca Petralia  3 Jianbo Pan  1 Xiaoyu Song  4 Yingwei Hu  1 Felipe da Veiga Leprevost  2 Boris Reva  3 Tung-Shing M Lih  1 Hui-Yin Chang  2 Weiping Ma  3 Chen Huang  5 Christopher J Ricketts  6 Lijun Chen  1 Azra Krek  3 Yize Li  7 Dmitry Rykunov  3 Qing Kay Li  1 Lin S Chen  8 Umut Ozbek  4 Suhas Vasaikar  9 Yige Wu  7 Seungyeul Yoo  3 Shrabanti Chowdhury  3 Matthew A Wyczalkowski  7 Jiayi Ji  4 Michael Schnaubelt  1 Andy Kong  2 Sunantha Sethuraman  7 Dmitry M Avtonomov  2 Minghui Ao  1 Antonio Colaprico  10 Song Cao  7 Kyung-Cho Cho  1 Selim Kalayci  3 Shiyong Ma  1 Wenke Liu  11 Kelly Ruggles  12 Anna Calinawan  3 Zeynep H Gümüş  3 Daniel Geiszler  13 Emily Kawaler  11 Guo Ci Teo  2 Bo Wen  5 Yuping Zhang  2 Sarah Keegan  11 Kai Li  5 Feng Chen  14 Nathan Edwards  15 Phillip M Pierorazio  16 Xi Steven Chen  17 Christian P Pavlovich  16 A Ari Hakimi  18 Gabriel Brominski  19 James J Hsieh  20 Andrzej Antczak  19 Tatiana Omelchenko  21 Jan Lubinski  22 Maciej Wiznerowicz  23 W Marston Linehan  6 Christopher R Kinsinger  24 Mathangi Thiagarajan  25 Emily S Boja  24 Mehdi Mesri  24 Tara Hiltke  24 Ana I Robles  24 Henry Rodriguez  24 Jiang Qian  26 David Fenyö  11 Bing Zhang  27 Li Ding  7 Eric Schadt  28 Arul M Chinnaiyan  2 Zhen Zhang  1 Gilbert S Omenn  29 Marcin Cieslik  30 Daniel W Chan  31 Alexey I Nesvizhskii  32 Pei Wang  33 Hui Zhang  34 Clinical Proteomic Tumor Analysis Consortium
Collaborators, Affiliations

Integrated Proteogenomic Characterization of Clear Cell Renal Cell Carcinoma

David J Clark et al. Cell. .

Erratum in

  • Integrated Proteogenomic Characterization of Clear Cell Renal Cell Carcinoma.
    Clark DJ, Dhanasekaran SM, Petralia F, Pan J, Song X, Hu Y, da Veiga Leprevost F, Reva B, Lih TM, Chang HY, Ma W, Huang C, Ricketts CJ, Chen L, Krek A, Li Y, Rykunov D, Li QK, Chen LS, Ozbek U, Vasaikar S, Wu Y, Yoo S, Chowdhury S, Wyczalkowski MA, Ji J, Schnaubelt M, Kong A, Sethuraman S, Avtonomov DM, Ao M, Colaprico A, Cao S, Cho KC, Kalayci S, Ma S, Liu W, Ruggles K, Calinawan A, Gümüş ZH, Geiszler D, Kawaler E, Teo GC, Wen B, Zhang Y, Keegan S, Li K, Chen F, Edwards N, Pierorazio PM, Chen XS, Pavlovich CP, Hakimi AA, Brominski G, Hsieh JJ, Antczak A, Omelchenko T, Lubinski J, Wiznerowicz M, Linehan WM, Kinsinger CR, Thiagarajan M, Boja ES, Mesri M, Hiltke T, Robles AI, Rodriguez H, Qian J, Fenyö D, Zhang B, Ding L, Schadt E, Chinnaiyan AM, Zhang Z, Omenn GS, Cieslik M, Chan DW, Nesvizhskii AI, Wang P, Zhang H; Clinical Proteomic Tumor Analysis Consortium. Clark DJ, et al. Cell. 2020 Jan 9;180(1):207. doi: 10.1016/j.cell.2019.12.026. Cell. 2020. PMID: 31923397 No abstract available.

Abstract

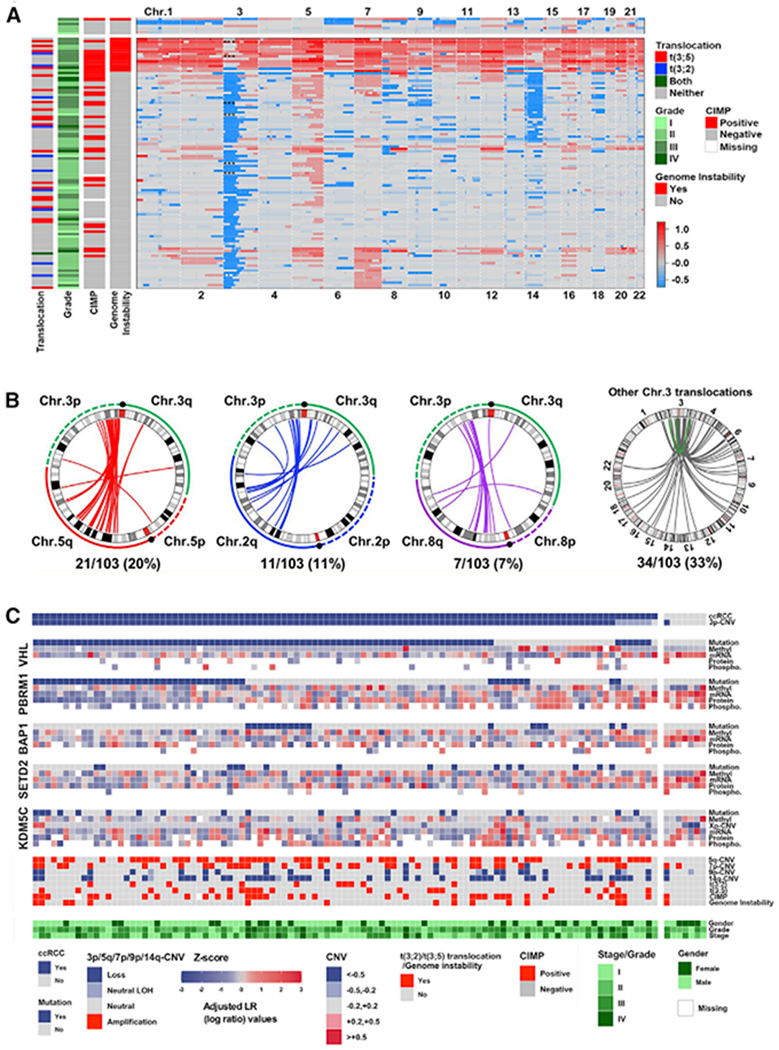
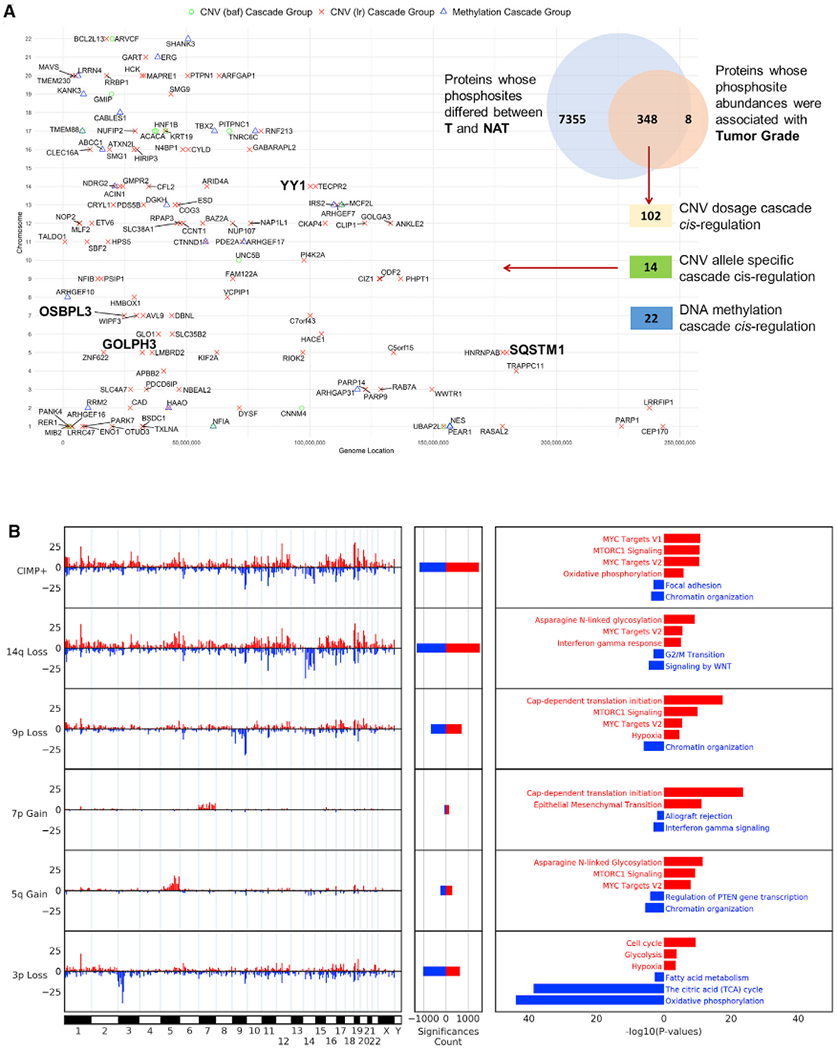
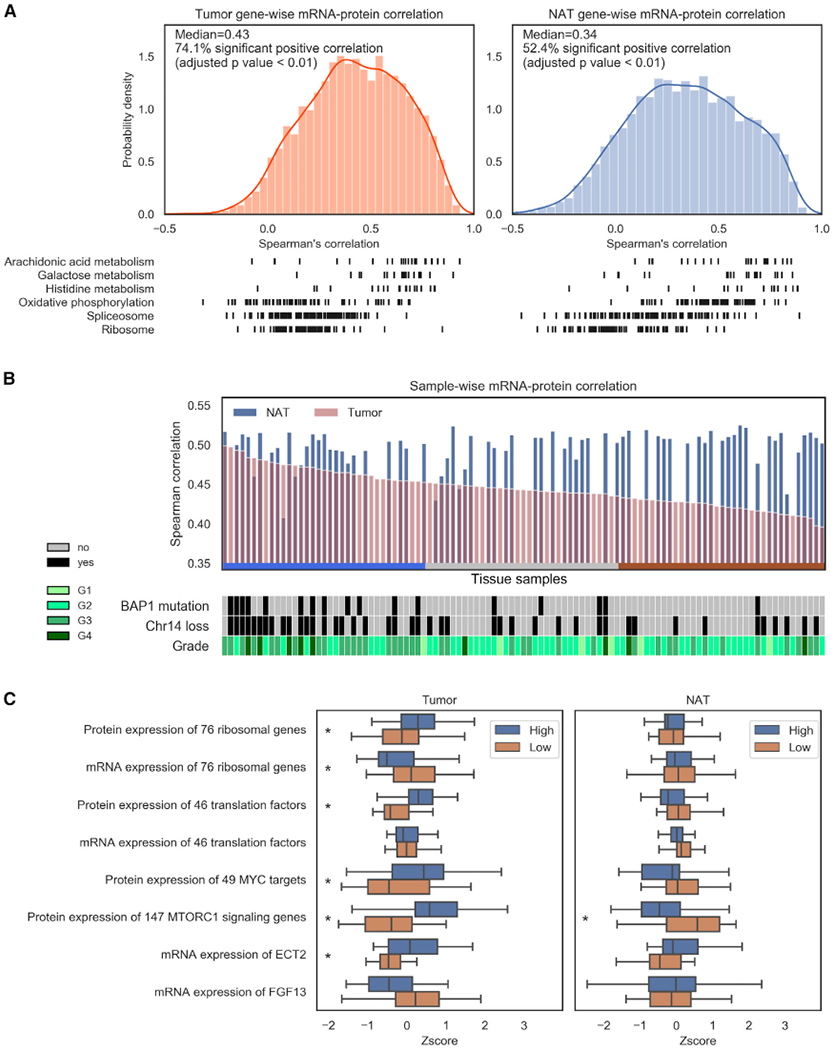
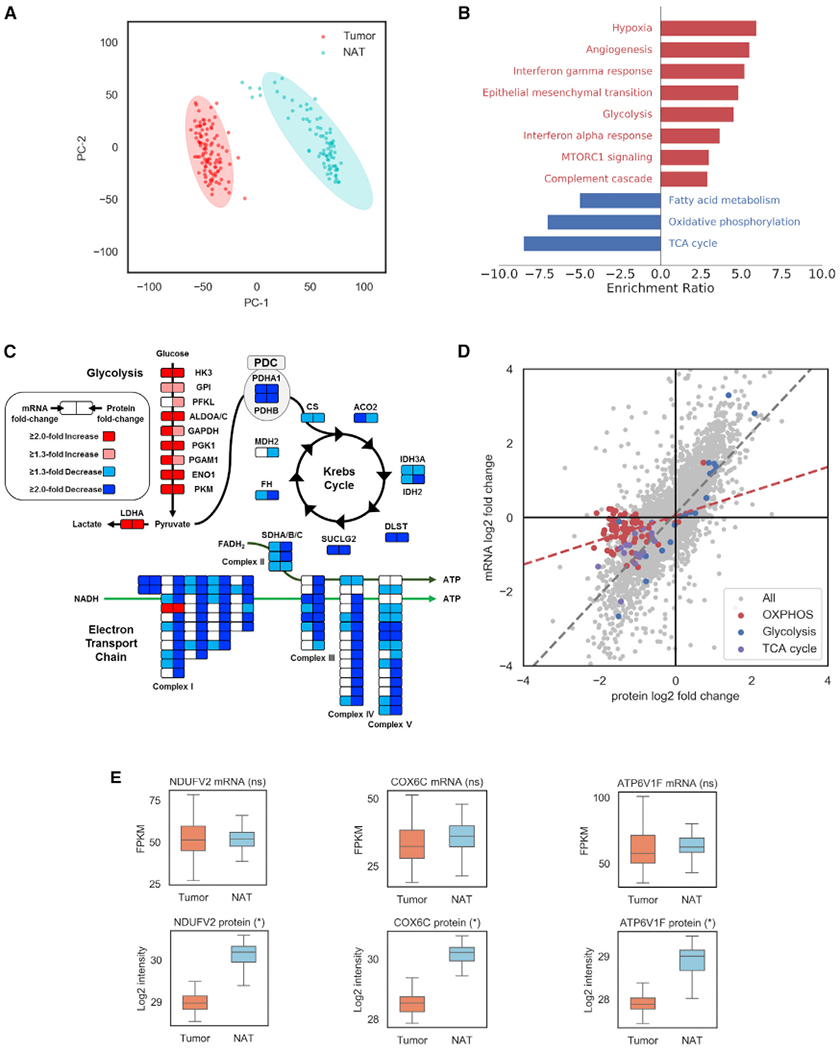
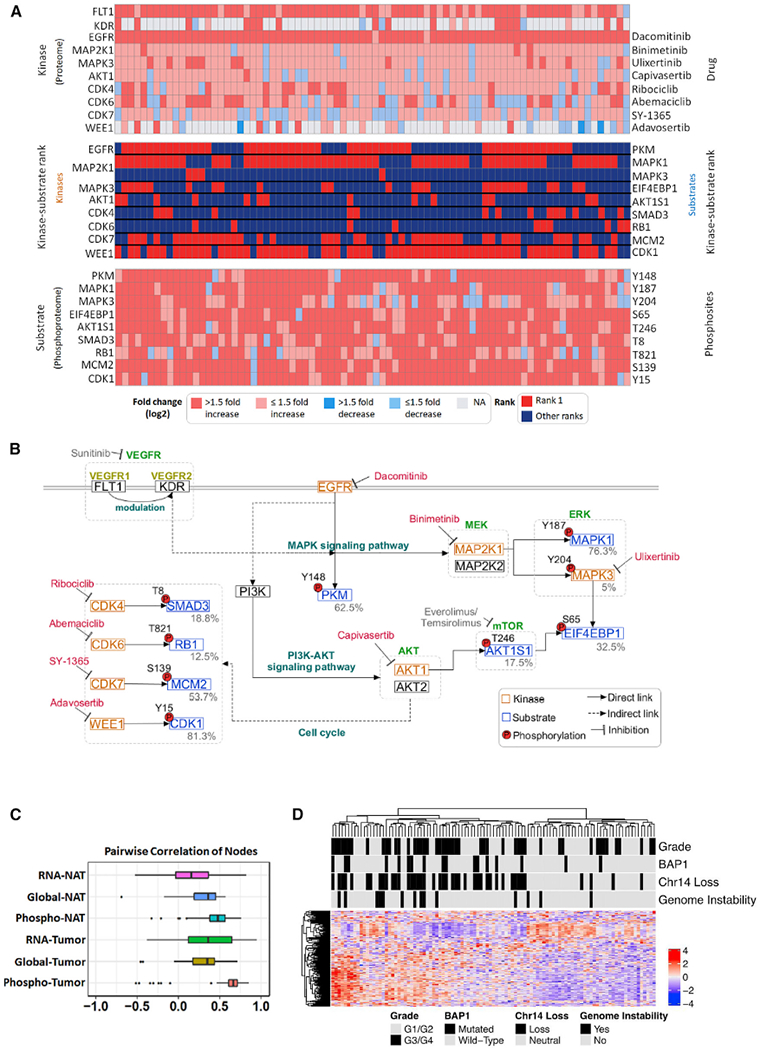
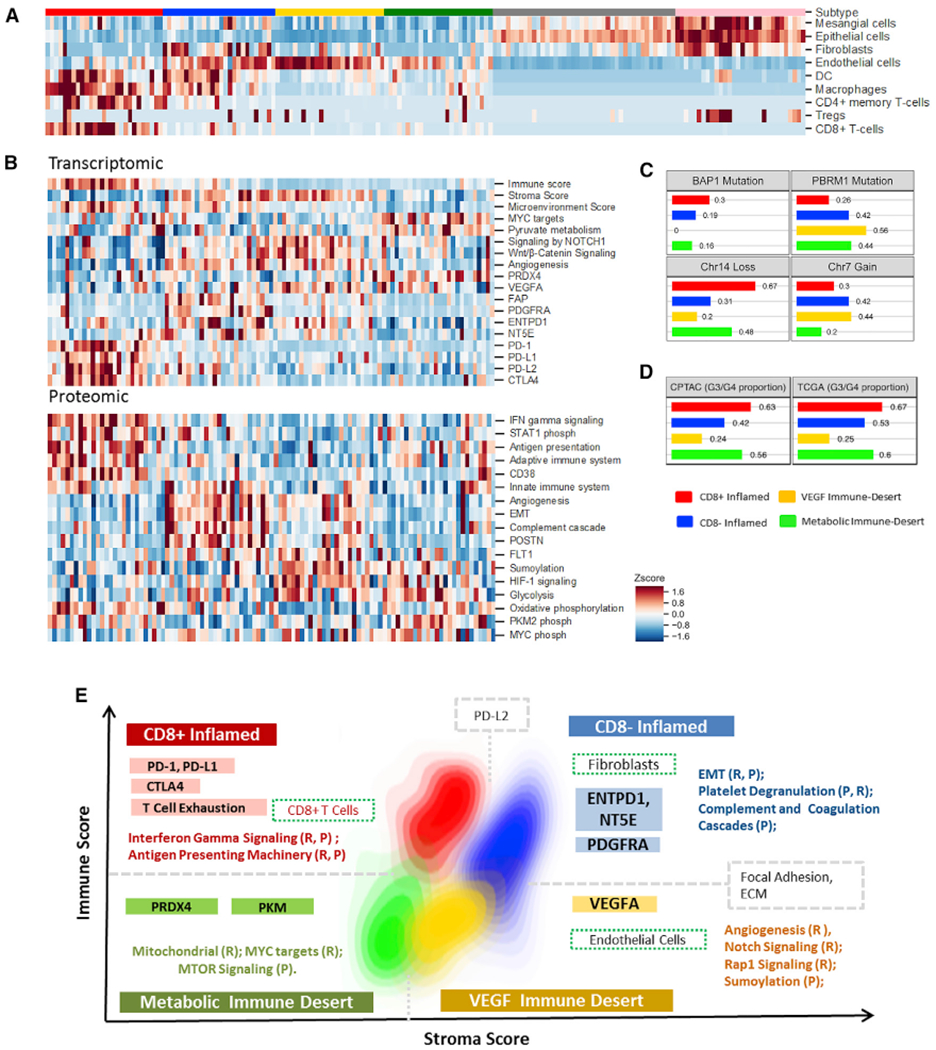
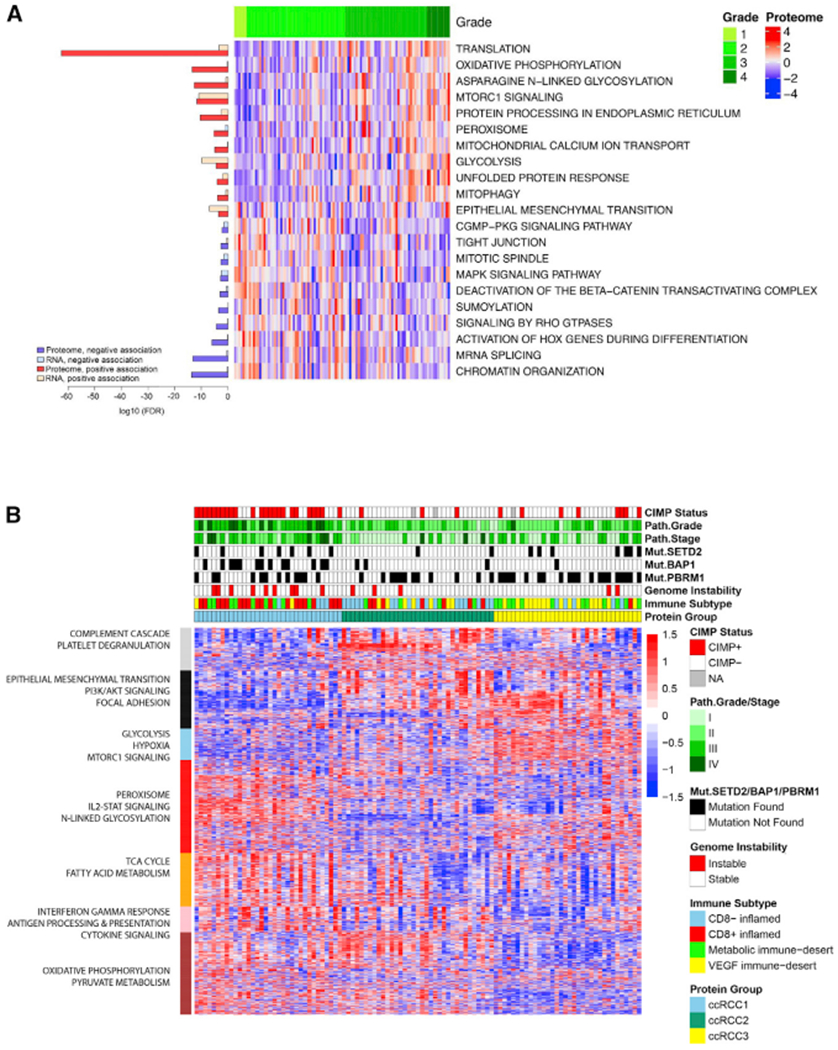
To elucidate the deregulated functional modules that drive clear cell renal cell carcinoma (ccRCC), we performed comprehensive genomic, epigenomic, transcriptomic, proteomic, and phosphoproteomic characterization of treatment-naive ccRCC and paired normal adjacent tissue samples. Genomic analyses identified a distinct molecular subgroup associated with genomic instability. Integration of proteogenomic measurements uniquely identified protein dysregulation of cellular mechanisms impacted by genomic alterations, including oxidative phosphorylation-related metabolism, protein translation processes, and phospho-signaling modules. To assess the degree of immune infiltration in individual tumors, we identified microenvironment cell signatures that delineated four immune-based ccRCC subtypes characterized by distinct cellular pathways. This study reports a large-scale proteogenomic analysis of ccRCC to discern the functional impact of genomic alterations and provides evidence for rational treatment selection stemming from ccRCC pathobiology.

Keywords: CPTAC; ccRCC; chromosomal translocation; drug targets; immune infiltration; phosphoproteomics; proteogenomics; proteomics; renal carcinoma; tumor microenvironment.


Conflict of interest statement

DECLARATION OF INTERESTS

Dr. Eric Schadt serves as Chief Executive Officer for Sema4 and has an equity interest in this company.

Figures

Figure 1.
Figure 1.. Genomic Alterations and their Associations with mRNA, Protein, and Phosphoprotein Abundances
(A) Profiling of absolute copy number estimates observed in the CPTAC cohort. Genomically defined non-ccRCC tumors are above ccRCC tumors; translocation event, grade, CpG island methylator phenotype (CIMP) status, genome instability, and CNV loss/gain are indicated by color coding. ccRCC tumors with evidence of 3p loss of heterozygosity (LOH) are indicated by three asterisks (***). (B) Circos plots of translocation events involving chromosomes 3 and either chromosomes 5 (red), 2 (blue), 8 (purple) or all other chromosomes (gray), including chromosomal inversion within chromosome 3 (green). Percentage of involved tumors with re-arrangement for each chromosome is annotated below each plot. (C) Heatmap of multi-omic data for the five key tumor suppressor genes (VHL, PBRM1, BAP1, SETD2, and KDM5C) (n = 103). Tumor samples were ordered by 3p CNV alteration (loss to neutral). Non-ccRCC tumors are separated (right). CNV event, Z score, CNV loss/gain, translocation status, CpG island methylator phenotype (CIMP) status, genome instability, grade, and gender are indicated by color coding (bottom). See also Figure S1 and Tables S1 and S2.
Figure 2.
Figure 2.. Impact of Copy Number Variation (CNV) on Protein Abundance
(A) DNA variations (CNV baf, B-allele frequencies; CNV Ir, adjusted log coverage ratios; DNA methylation) with cascading cis-association (associations with all types of mRNA, global protein, and phosphopeptide abundances), overlapped with phosphopeptides significantly differentiated by clinical features (tumor versus NAT and tumor grade). Genes in bold are associated with CNV events involving chromosome 5 or 7 gain and 14 loss. (B) The cis and trans associations of chromosome arms (3p, 5q, 7p, 9p, and 14q) and CpG island methylator phenotype (CIMP). Significant (adjusted p < 0.1) positive (red) and negative (blue) associations for individual chromosomes (left), summed associations (middle), and corresponding enriched upregulated (red) and downregulated (blue) pathways (adjusted p < 0.05) are annotated (right). See also Figure S2 and Table S3.
Figure 3.
Figure 3.. Correlations between Transcriptomic and Proteomic Abundance
(A) Gene-wise correlations of mRNA and protein expression in tumors (left) and NATs (right). Annotated cellular pathways and corresponding Spearman gene-wise correlation (bottom). (B) Sample-wise correlation of tumors ranked from high to low with corresponding NAT sample-wise correlation (top). Tumors were evenly distributed into three groups: high (blue), middle (gray), and low (gold). BAP1 mutation, chromosome 14 loss status, and tumor grade are annotated (bottom). (C) Boxplots of ribosome and translation factor gene expression and Pol I-associated regulation in tumor samples (left) and corresponding NATs (right) (*p < 0.05). Figure S3 and Tables S1 and S4.
Figure 4.
Figure 4.. Differential Expression of Transcriptomic and Proteomic Profiles between ccRCC Tumors and NAT Protein Expression
(A) PCA visualization of protein expression in ccRCC tumors and NATs. (B) Analysis of significantly differentially regulated pathways (adjusted p < 0.05) between ccRCC tumors and NATs. (C) Schema of metabolic pathways (glycolysis and electron transport chain [OXPHOS]) with select differential gene expression of mRNA and protein levels between ccRCC tumors and NATs. (D) Scatterplots depicting expression of mRNA (x axis) and protein (y axis). Linear regression of all mRNA-protein pairs (gray dotted line) and OXPHOS mRNA-gene pairs (red dotted line) are shown. Metabolism-related genes are indicated. (E) Boxplot of representative OXPHOS genes from complex I (NDUFV2), IV (COX6C), and V (ATP6V1F) displaying discordant mRNA-protein expression (n.s., not significant, *adjusted p < 0.05). See also Figure S4 and Tables S1, S4, and S5.
Figure 5.
Figure 5.. Phospho-Substrates with Associated Kinases and a Network Module Specific to Phospho-Tumor Data
(A) Ranked phospho-substrate events of kinases with inhibitors and fold-change at global- and phospho-levels for kinases and substrates, respectively. (B) Pathways based on the selected phospho-substrates and kinases, with relevant drugs shown by targets (red). Current FDA-approved drugs for ccRCC (gray). (C) Pairwise correlation of nodes at multi-omics levels of “cell cycle” co-expression network module. (D) Heatmap of “cell cycle” module expression with grade, BAP1 and chromosome 14 loss, and genome instability distribution annotated. See also Figure S5 and Tables S1 and S6.
Figure 6.
Figure 6.. Immune-Based Subtyping of ccRCC Tumors
(A) Transcriptome-based deconvolution of mRNA transcript cell signatures in 103 ccRCC tumors and 72 NATs using xCell. (B) Molecular characteristics (transcriptomic, proteomic) stratified tumors into four immune subtypes: CD8+ inflamed (red), CD8 inflamed (blue), VEGF immune desert (yellow), metabolic immune desert (green), and NATs into two subtypes (pink and gray). (C) Proportion of BAP1 mutation, PBRM1 mutation, chromosome 14 loss, and chromosome 7 gains within each of the immune groups. (D) Proportion of high tumor grade tumors (i.e., grade 3 and grade 4) in each of the immune groups for CPTAC and TCGA datasets. High-grade tumors were significantly enriched in CD8+ inflamed group compared to VEGF immune desert group. (E) Density contours of immune and stroma scores of each immune subtype. Pathways upregulated based on RNA-seq and global proteomics data are labeled with “R” or “P,” respectively. See also Figure S6 and Tables S1 and S7.
Figure 7.
Figure 7.. Proteomic Inter-Tumor Heterogeneity of ccRCC and Associated Functional Pathways
(A) Cellular pathways (right) with positive (red) or negative (blue) associations with grade (adjusted p < 0.05) at protein or mRNA level (left). Heatmap of protein expression associated with high- and low-grade tumors (center) (Benjamini-Hochberg adjusted p < 0.05). (B) Heatmap of global proteomic abundances. For subtype identification, protein features (n = 3,567) were selected based on highest variance. Color indicates Z score of protein in each sample: red is increased, blue is decreased. Clinical and molecular features are indicated above the heatmap. Cluster-derived modules are annotated according to pathway enrichment using Hallmark Gene signature, REACTOME, and KEGG ontologies (adjusted p < 0.05). See also Figure S7 and Tables S1 and S5.

Comment in

References

    1. Alyass A, Turcotte M, and Meyre D (2015). From big data analysis to personalized medicine for all: challenges and opportunities. BMC Med. Genomics 8, 33. - PMC - PubMed
    1. Anderson KG, Stromnes IM, and Greenberg PD (2017). Obstacles Posed by the Tumor Microenvironment to T cell Activity: A Case for Synergistic Therapies. Cancer Cell 31, 311–325. - PMC - PubMed
    1. Antonioli L, Pacher P, Vizi ES, and Haskó G (2013). CD39 and CD73 in immunity and inflammation. Trends Mol. Med 19, 355–367. - PMC - PubMed
    1. Arai E, Chiku S, Mori T, Gotoh M, Nakagawa T, Fujimoto H, and Kanai Y (2012). Single-CpG-resolution methylome analysis identifies clinicopathologically aggressive CpG island methylator phenotype clear cell renal cell carcinomas. Carcinogenesis 33, 1487–1493. - PMC - PubMed
    1. Aran D, Hu Z, and Butte AJ (2017). xCell: digitally portraying the tissue cellular heterogeneity landscape. Genome Biol. 18, 220. - PMC - PubMed

Publication types

MeSH terms