. 2019 Oct 31;179(4):984-1002.e36.
doi: 10.1016/j.cell.2019.10.004.

Uganda Genome Resource Enables Insights into Population History and Genomic Discovery in Africa

Affiliations

Uganda Genome Resource Enables Insights into Population History and Genomic Discovery in Africa

Deepti Gurdasani et al. Cell. .

Abstract

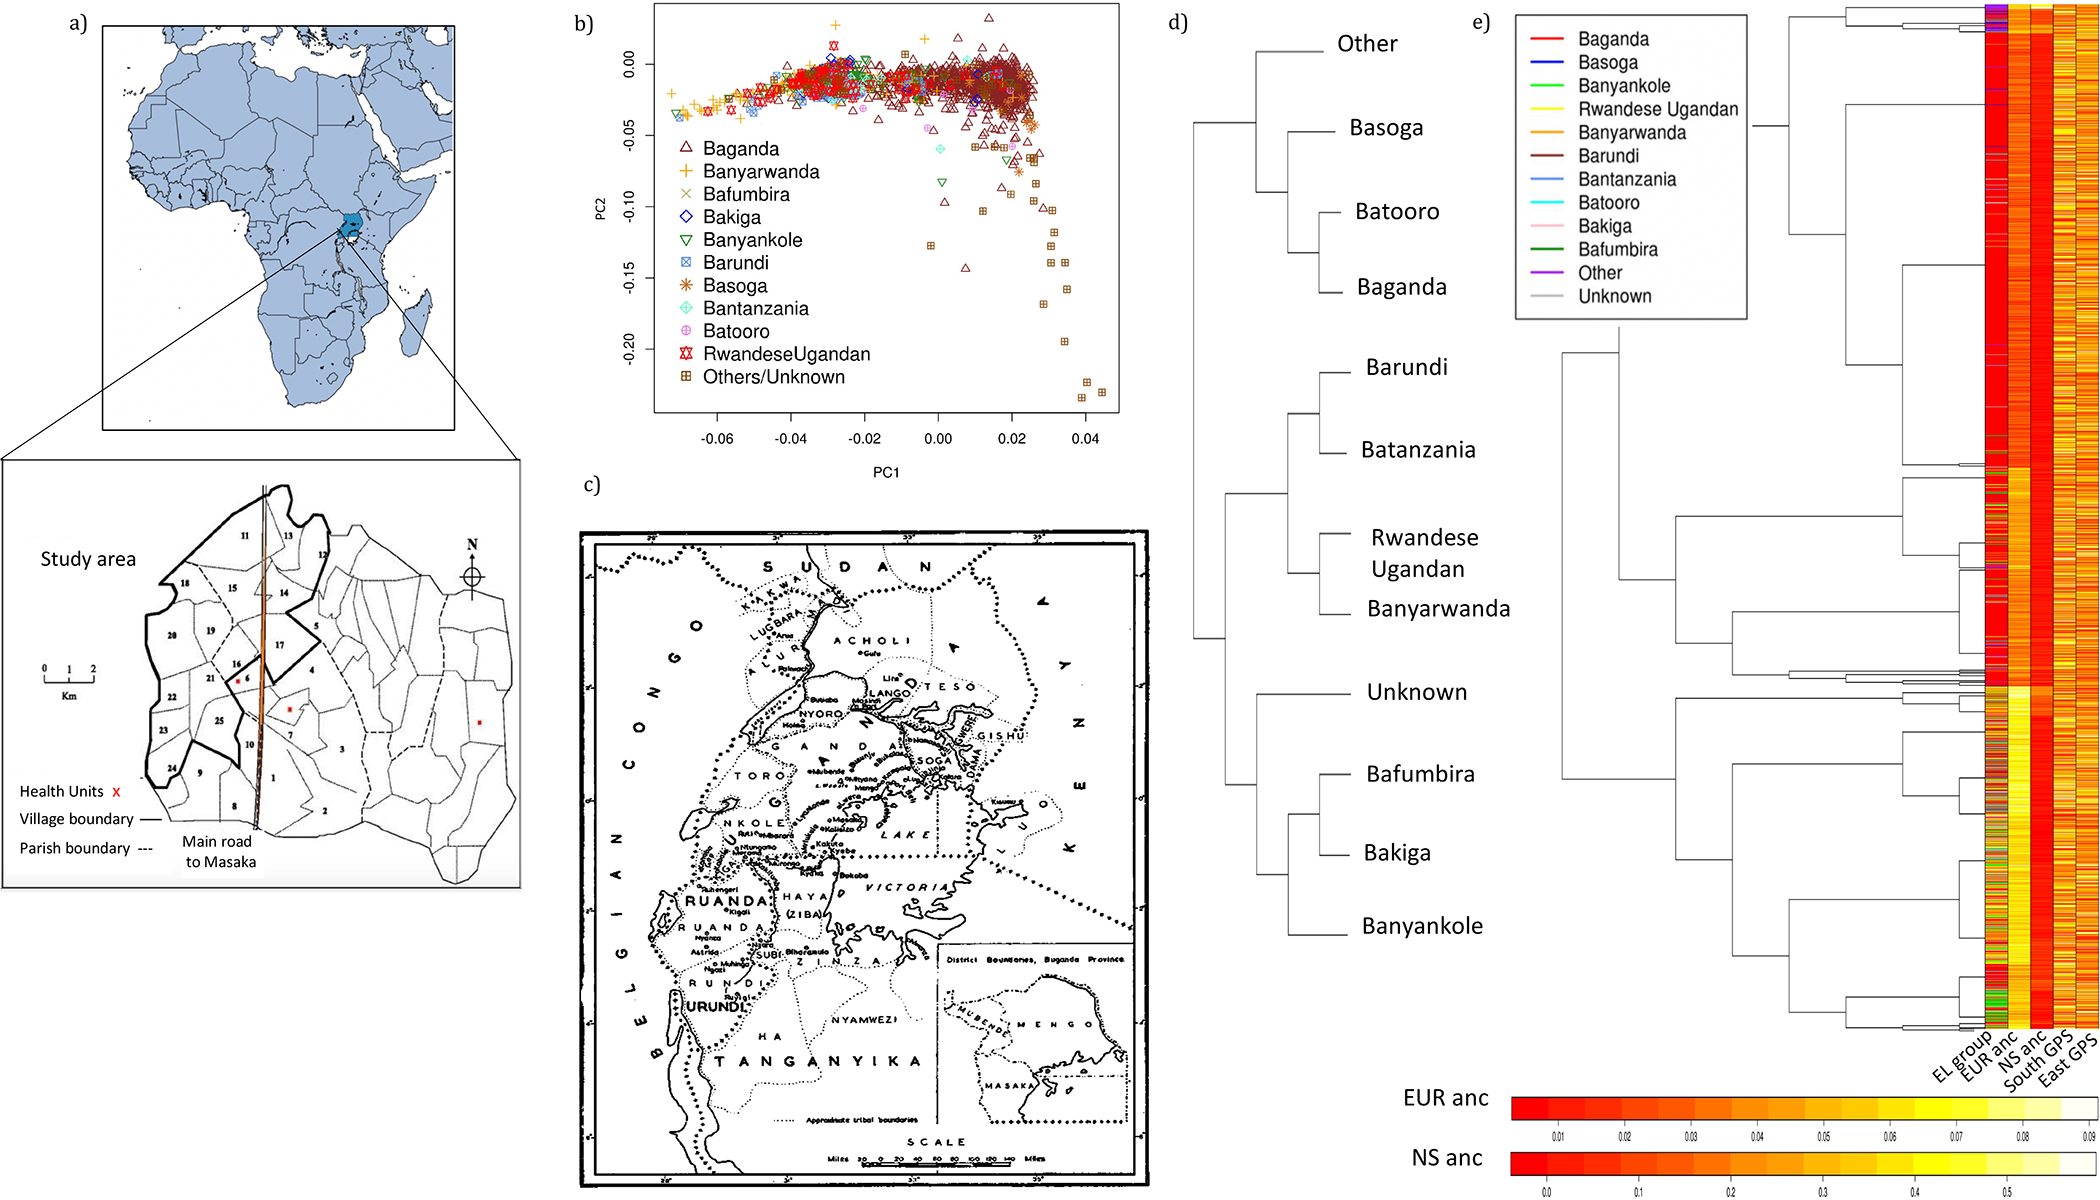
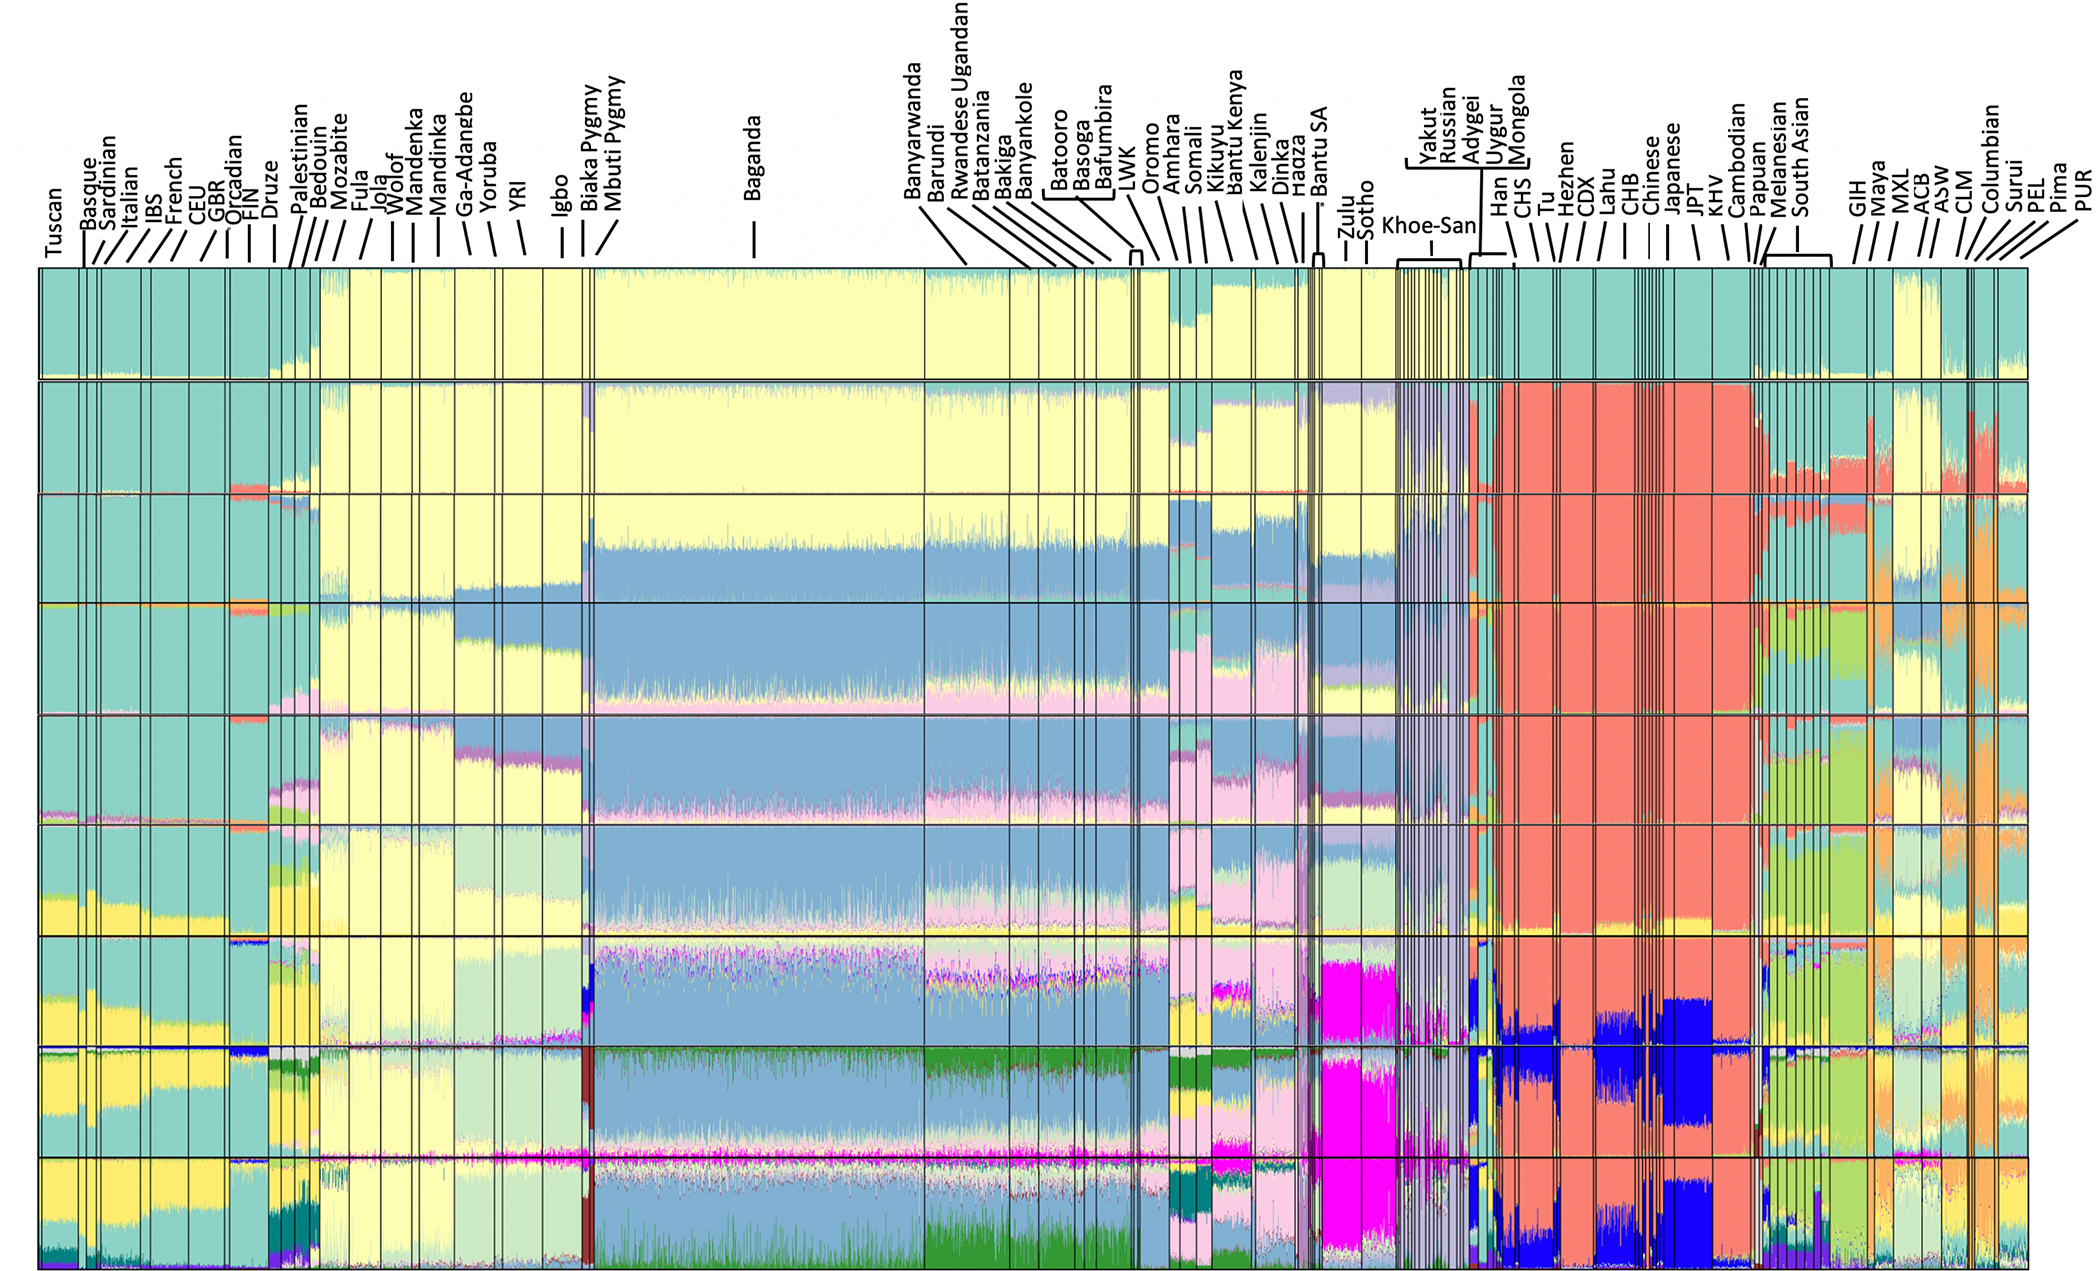
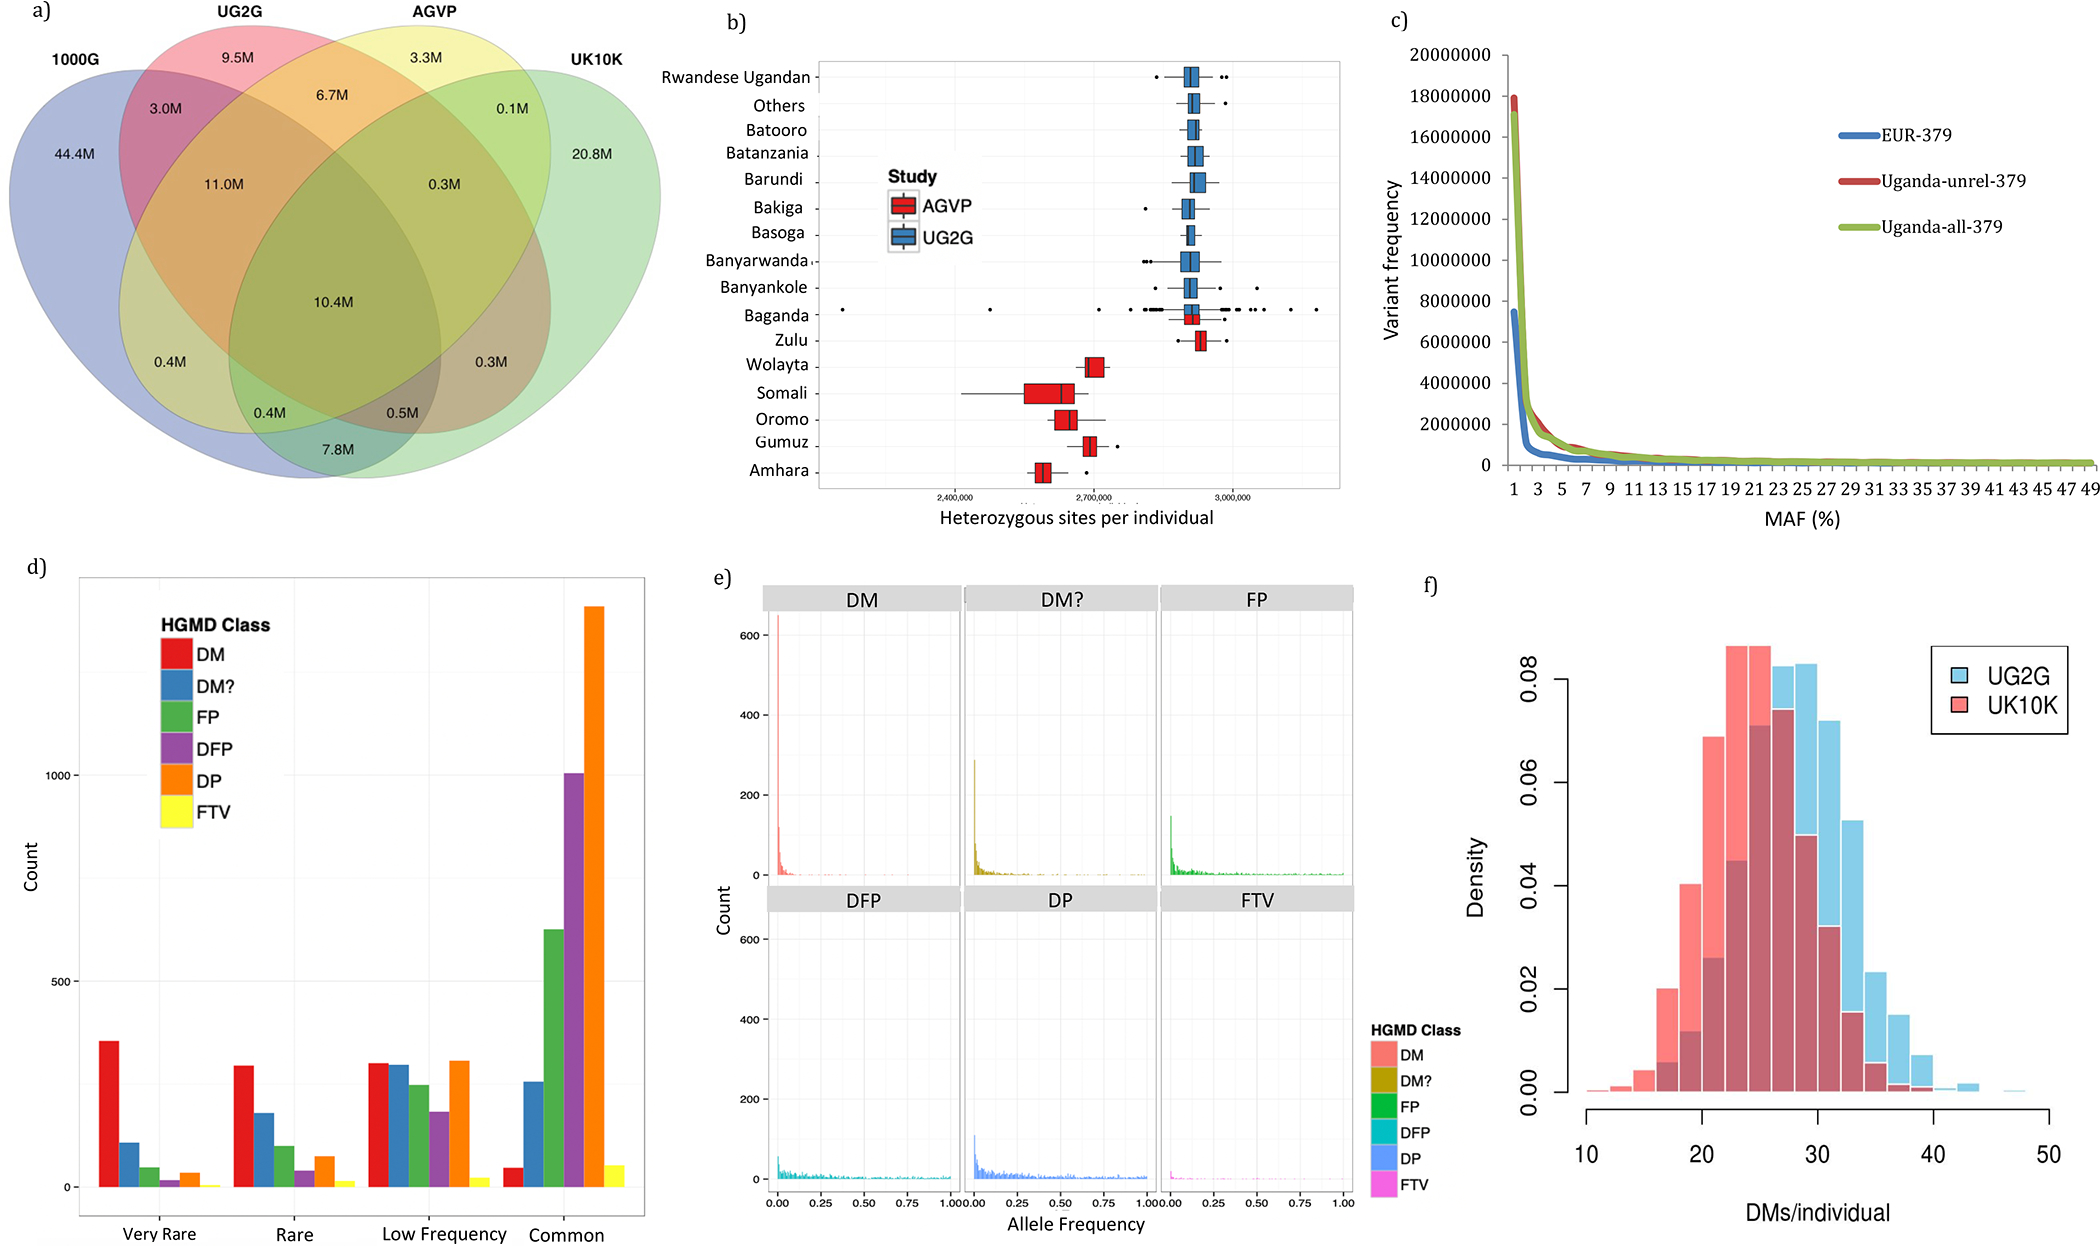
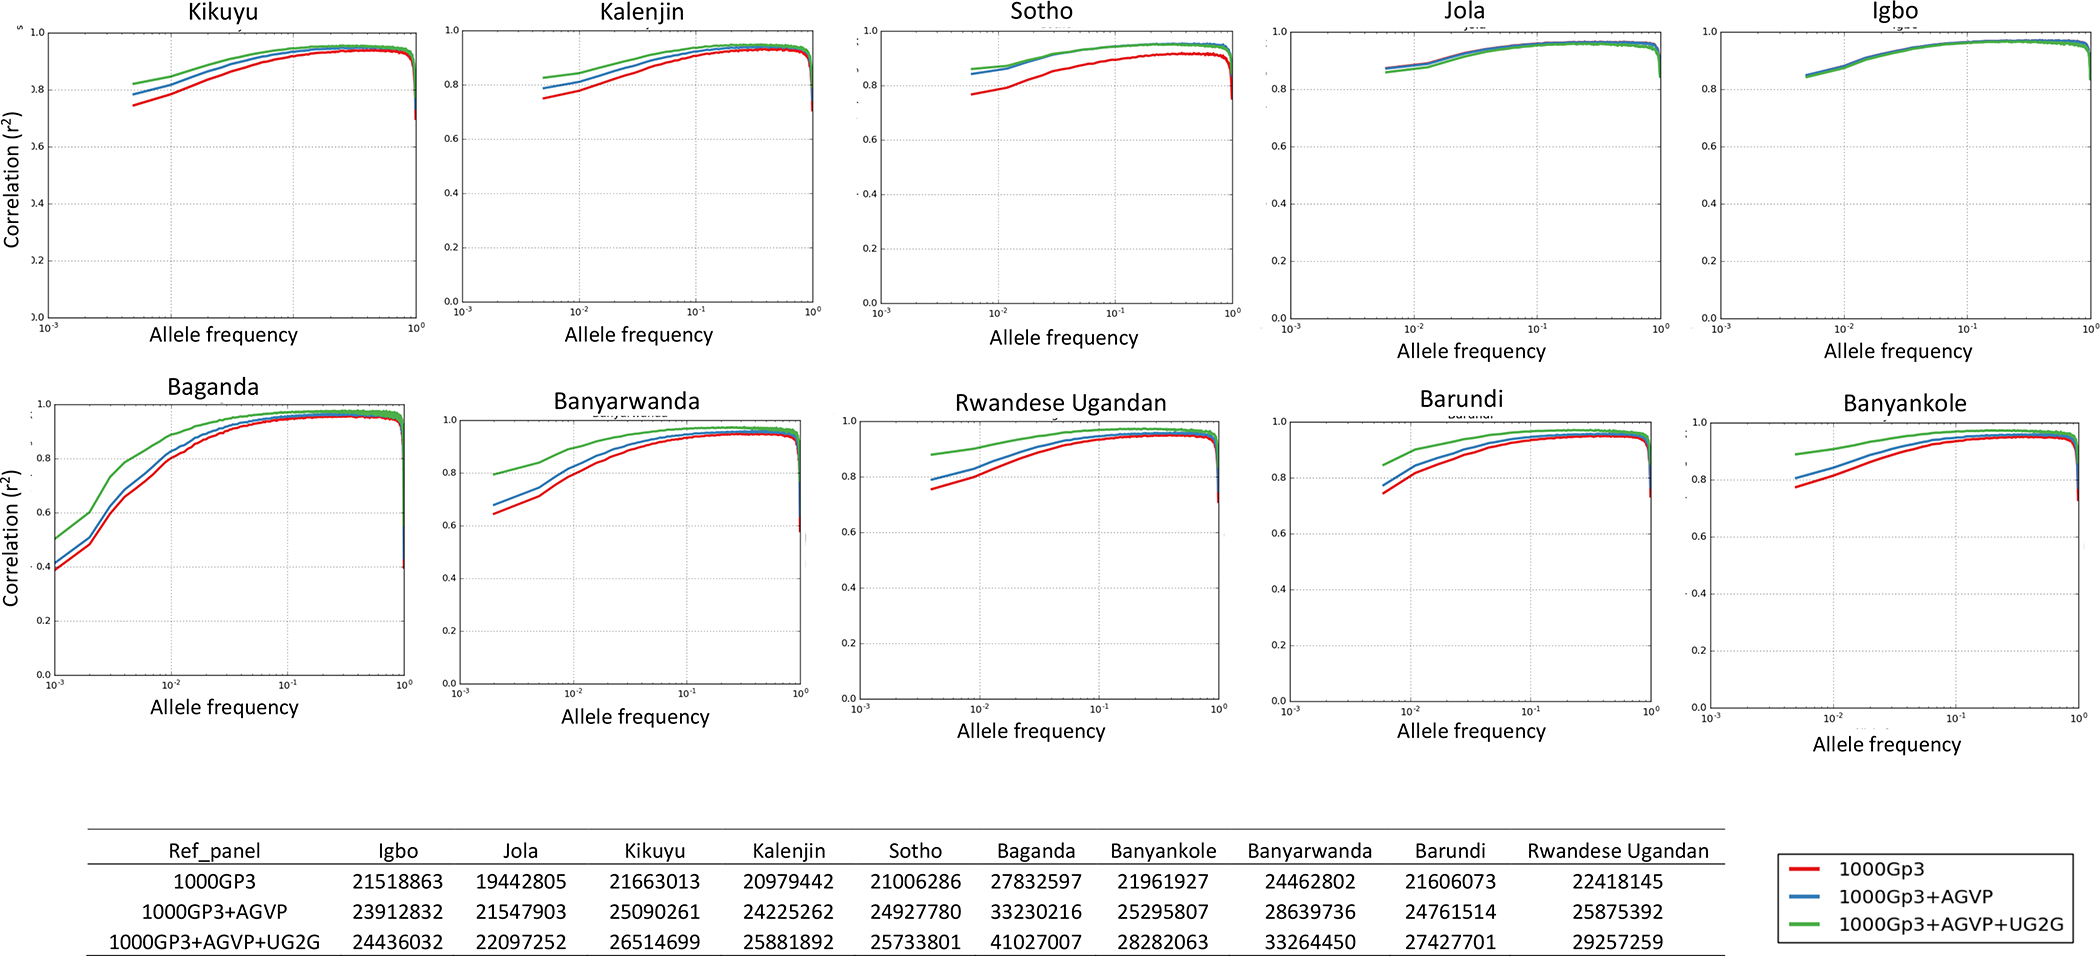
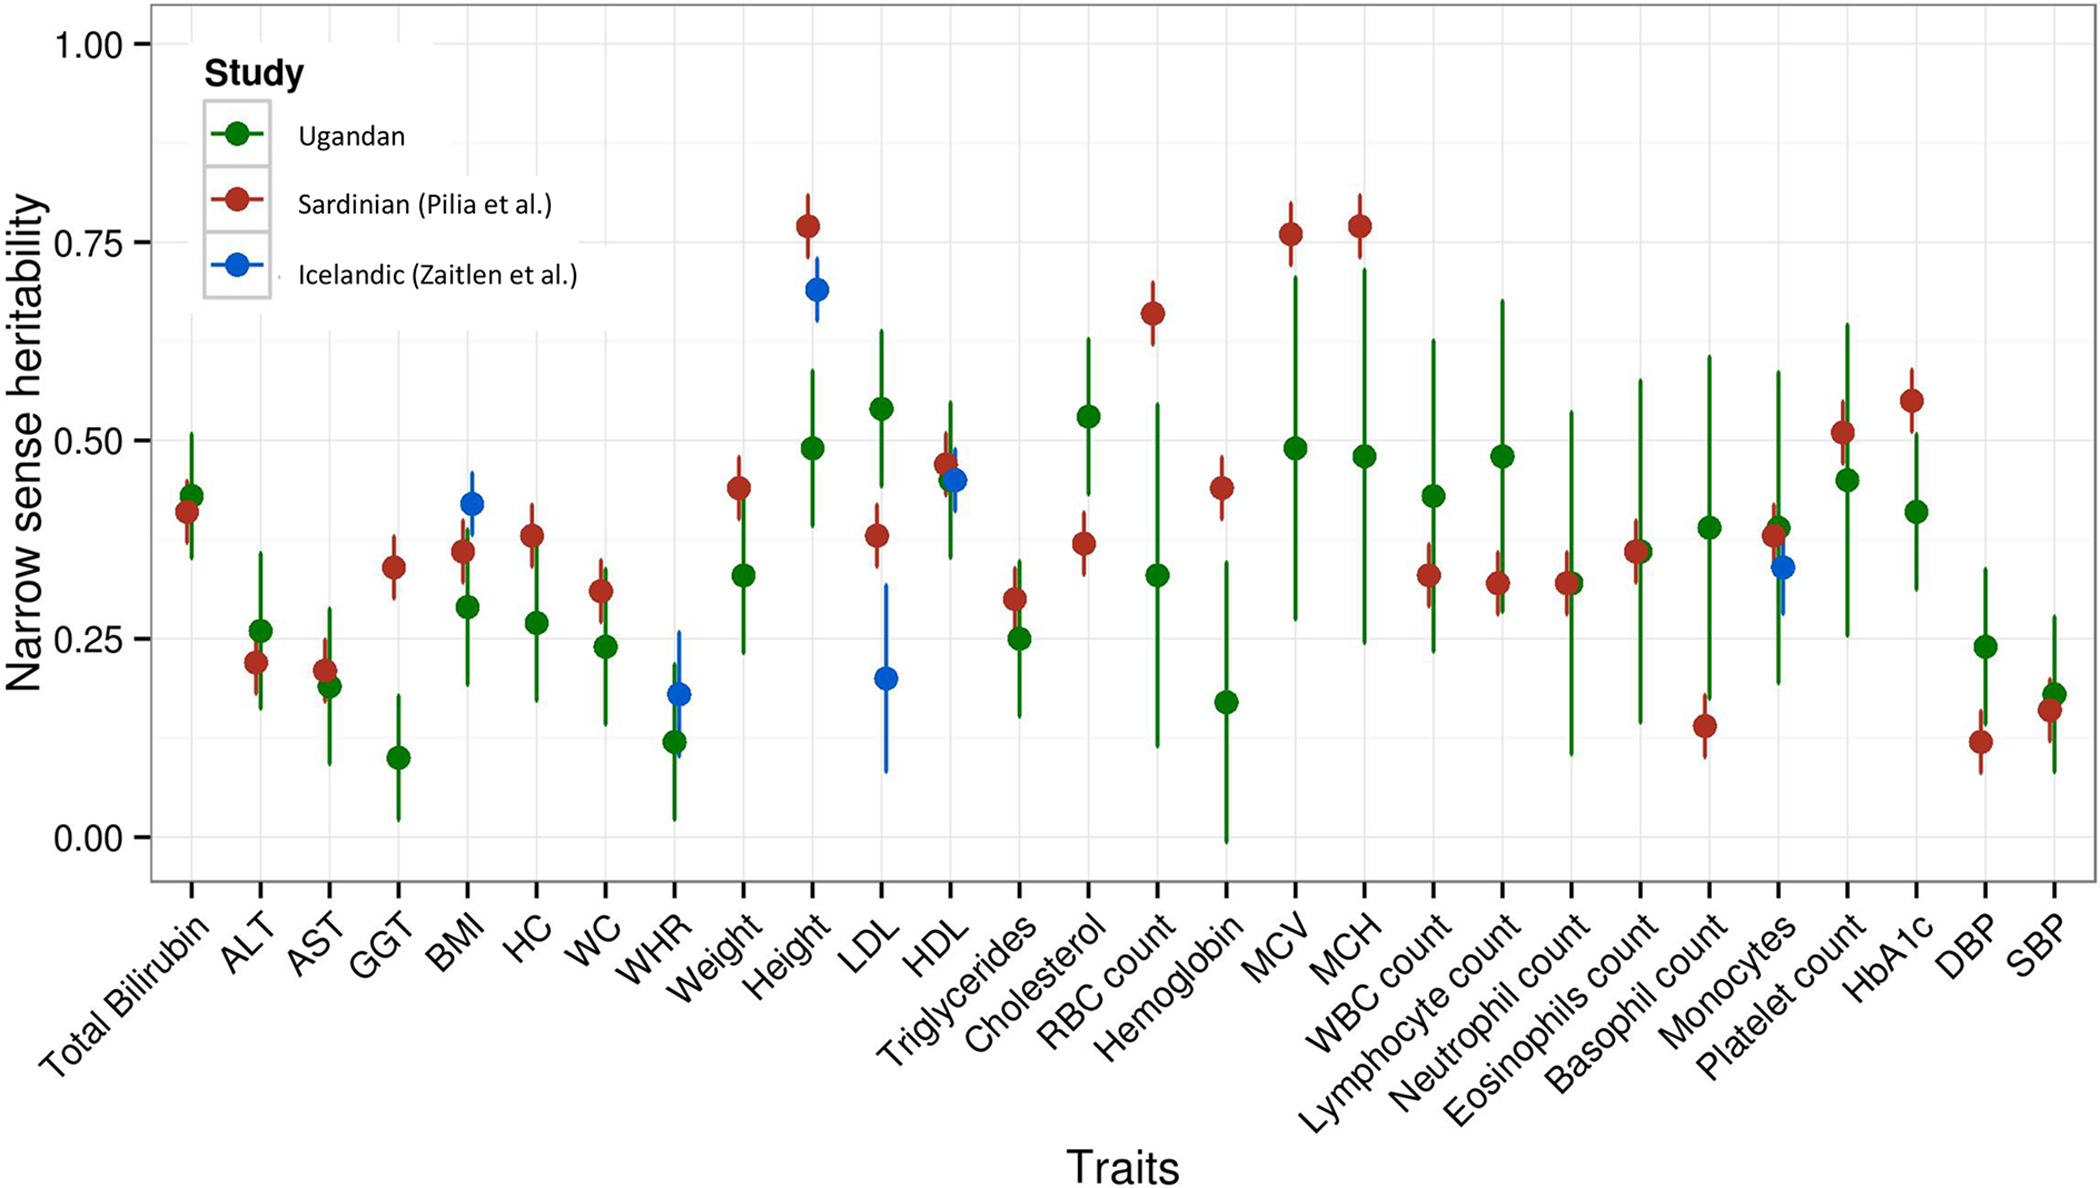
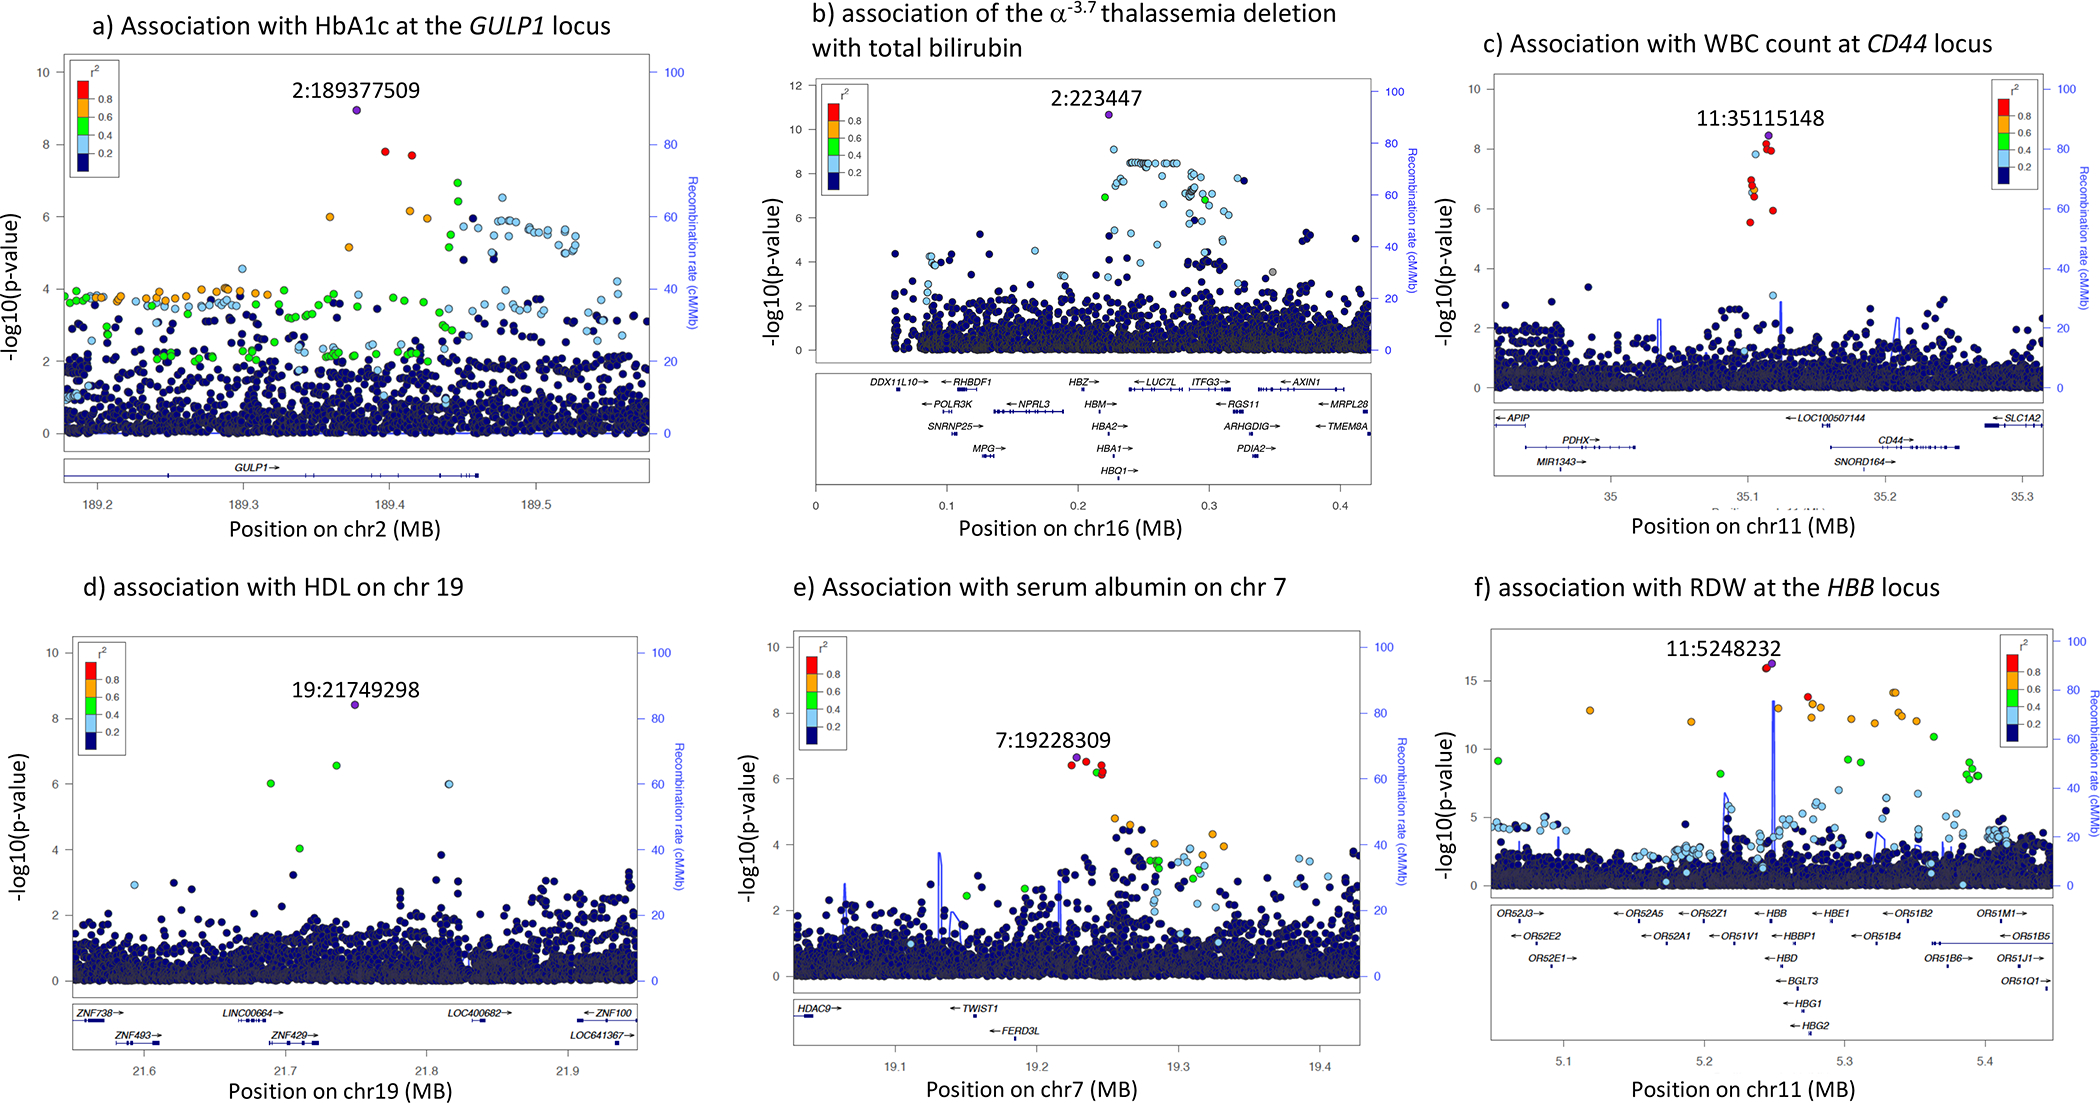
Genomic studies in African populations provide unique opportunities to understand disease etiology, human diversity, and population history. In the largest study of its kind, comprising genome-wide data from 6,400 individuals and whole-genome sequences from 1,978 individuals from rural Uganda, we find evidence of geographically correlated fine-scale population substructure. Historically, the ancestry of modern Ugandans was best represented by a mixture of ancient East African pastoralists. We demonstrate the value of the largest sequence panel from Africa to date as an imputation resource. Examining 34 cardiometabolic traits, we show systematic differences in trait heritability between European and African populations, probably reflecting the differential impact of genes and environment. In a multi-trait pan-African GWAS of up to 14,126 individuals, we identify novel loci associated with anthropometric, hematological, lipid, and glycemic traits. We find that several functionally important signals are driven by Africa-specific variants, highlighting the value of studying diverse populations across the region.


Conflict of interest statement

DECLARATION OF INTERESTS

The authors declare no competing interests.

Figures

Figure 1.
Figure 1.. Genetic Substructure and Population Admixture within the General Population Cohort, Uganda
(A) Study area that encompasses 25 villages in the southwestern region of Uganda. (B) fineSTRUCTURE inferred principal components (PCs) among unrelated individuals with the clines along PC1 and PC2 representative of Eurasian and East African gene flow respectively (n = 1,893). See also Figure S2 for PCA of Ugandans in a regional and global context. Modest structure is observed by ethno-linguistic group. (C) Map of the district structure of Uganda during the colonial era, representing different districts different ethno-linguistic groups are likely to have migrated from (map reproduced with permission from (Richards, 1954). (D) Dendrogram tree of population relationships among ethno-linguistic groups inferred by fineSTRUCTURE based on a summary co-ancestry matrix in analysis of unrelated Ugandans. The tree represents the summary of population relationships for ethno-linguistic groups and shows substructure among populations based on their geographical source (see also Tables S2.2–S2.4 for Procrustes analyses). Two major clades are represented, one from central Uganda and the second from populations migrating from western and southwestern Uganda. (E) Unsupervised tree structuring with fineSTRUCTURE analysis of unrelated Ugandans. The dendrogram shows the inferred tree structure with various panels annotated for additional information below, including ethno-linguistic group (EL group), proportion of Eurasian ancestry as inferred by ADMIXTURE, K = 4 (EUR anc), proportion of Nilo-Saharan ancestry as inferred by ADMIXTURE (NS anc), and transformed latitude (south gps) and longitude (east gps) coordinates for each individual. Prominent clustering of clades is observed by ethno-linguistic group and Eurasian ancestral proportions. See also Figures S3, S4, and S5.
Figure 2.
Figure 2.. Unsupervised ADMIXTURE Analysis of Ugandan Populations in a Global Context (n = 3,904) for clusters K = 2 to K = 18
K = 2 represents separation of African, and non-African ancestry. Subsequent clusters show further delineation of Eurasian, East Asian, African hunter-gatherer (light purple ancestry seen in the Khoe-San), and Nilo-Saharan ancestry (light pink component observed predominantly in the Dinka). The Ugandans appear to be represented by multiple ancestral components, including ancestry predominant in East African Bantu populations, Nilo-Saharan populations, as well as different proportions of Eurasian-like components. We confirm these results with formal tests of admixture: QpWave (Tables S3.1, S3.8, and S3.9), f3 tests (Table S3.2), MALDER (Table S3.3), GLOBETROTTER (Figure S3), MT and Y chromosome analysis (Figure S4; Table S3.4), and the double-conditioned site frequency spectrum (Figure S5; Table S3.6).
Figure 3.
Figure 3.. Genomic Diversity and Mutational Spectrum within the Uganda Genome Resource
(A) Discovery of autosomal SNP variation among 1,978 individuals from UGR relative to the 1000 Genomes Project phase 3 project (n = 2,504), the AGVP (n = 320), and UK10K cohorts (n = 3,781). (B) Number of heterozygous sites per individual for each population in AGVP and the UGR (see Table S1.8 for number of individuals in each population group and Table S4.1 for the mean total number of variants per individual). (C) Comparative allele frequency spectrum between 379 Europeans from the 1000 Genomes Project phase 1, a random sample of 379 individuals from all Ugandans (Uganda-all-379), and a random sample from only unrelated Ugandans (Uganda-unrel-379). (D–F) Distribution of different functional classes of HGMD mutations within the UGR and also in comparison with UK10K ALSPAC; disease-causing mutations (DM), mutation reported to be pathogenic but with some degree of uncertainty (DM?), funcional polymorphisms (FP), disease-associated polymorphisms (DP), DPs with supportive functional evidence (DFP), frameshift or truncating variants (FTV). See Table S4.2 for the distribution of Clinvar clinically significant variants across populations. (D) We stratified the variation in four categories depending on allele frequency: common (>5% AF), low frequency (0.5%–5% AF), rare (0.1%–0.5% AF), and very rare (<0.1% AF). We find that while categories (FP, DFP, and DP) are preferentially observed as common variants in the UG2G data, the DM and DM? categories (disease-causing) are mainly observed as low-frequency or rare variants, as expected with deleterious mutations that are prone to purifying selection. In order to better understand the relevance of these mutations, we specifically examine DMs common in Uganda but rare among Europeans (see Figure S9 and Table S4.3). (E) Allele frequency spectrum for different functional classes of HGMD mutations within UGR. Expectedly, DMs are highly enriched for rare variation. (F) Distribution of DM among individuals in UG2G compared to UK10K ALSPAC.
Figure 4.
Figure 4.. Improvement in Imputation Accuracy with Addition of the African Genome Variation Project (AGVP) and Ugandan Sequence (UG2G) Panel to the 1000 Genomes Project Phase 3 (1000Gp3) Imputation Panel (n = 3,895 for the Combined Reference Panel) when Imputation Is Carried Out into the Omni 2.5M Genotype Data for AGVP Population Sets Not Included in the Reference Panel
Marked improvements are observed for East African populations such as Kalenjin and Kikuyu across the allele frequency spectrum. We also observe substantial improvements when imputing into the unrelated individuals from different ethno-linguistic groups in UGWAS. The tables below the figure show the number of variants successfully imputed (info score ≥ 0.3) into the Omni 2.5M array data for each population using different reference panels. We see a substantial increase in informatively imputed variants with addition of the UG2G sequence reference panel across all populations.
Figure 5.
Figure 5.. Heritabilities for 34 Complex Traits within the Ugandan GWAS Cohort (UGWAS, n = 4,778) (Green Markers) Measured Using FAST-LMM (Blue Markers), Compared with Those Estimated in a Sardinian (Red Markers) and Icelandic Population (Blue Markers)
The estimated heritabilities in UGWAS are adjusted for environmental correlation among individuals using GPS coordinates. The heritabilities in Pilia et al. (2006) are also adjusted for shared environment in pedigrees. We observe statistically different heritability for LDL-cholesterol, total cholesterol, height, and serum GGT. See Tables S5.1–S5.4 for raw data.
Figure 6.
Figure 6.. Locusview Plots for Selected Novel Association Signals Associated with Specific Traits in a GWAS of up to 14,126 Individuals
(A) Novel association of the GULP1 locus with HbA1c. (B) We highlight functionally important and novel associations of the α−3.7 thalassemia deletion with total bilirubin. (C) We identified a novel association with WBC count at the CD44 locus; CD44 encodes a cell-surface protein that regulates neutrophil adhesion, migration, and apoptosis, among other functions (D and E) Associations of Africa-specific variants with HDL levels (D) and total albumin (E). (F) Association of the sickle cell variant with RDW, recapitulating the known pathophysiology of sickle cell disease.

Comment in

  • Insights from Ugandan genomes.
    Kelsey R. Kelsey R. Nat Rev Genet. 2020 Jan;21(1):4. doi: 10.1038/s41576-019-0194-3. Nat Rev Genet. 2020. PMID: 31695142 No abstract available.

References

    1. Abadie JM, and Koelsch AA (2008). Performance of the Roche second generation hemoglobin A1c immunoassay in the presence of HB-S or HB-C traits. Ann. Clin. Lab. Sci 38, 31–36. - PubMed
    1. Abecasis GR, Cherny SS, Cookson WO, and Cardon LR (2002). Merlin–rapid analysis of dense genetic maps using sparse gene flow trees. Nat. Genet 30, 97–101. - PubMed
    1. Abecasis GR, Auton A, Brooks LD, DePristo MA, Durbin RM, Hand-saker RE, Kang HM, Marth GT, and McVean GA; 1000 Genomes Project Consortium (2012). An integrated map of genetic variation from 1,092 human genomes. Nature 491, 56–65. - PMC - PubMed
    1. Abul-Husn NS, Cheng X, Li AH, Xin Y, Schurmann C, Stevis P, Liu Y, Kozlitina J, Stender S, Wood GC, et al. (2018). A Protein-Truncating HSD17B13 Variant and Protection from Chronic Liver Disease. N. Engl. J. Med 378, 1096–1106. - PMC - PubMed
    1. Adeyemo AA, Tekola-Ayele F, Doumatey AP, Bentley AR, Chen G, Huang H, Zhou J, Shriner D, Fasanmade O, Okafor G, et al. (2015). Evaluation of Genome Wide Association Study Associated Type 2 Diabetes Susceptibility Loci in Sub Saharan Africans. Front. Genet 6, 335. - PMC - PubMed

Publication types

LinkOut - more resources