

Development of a prioritization method for chemical-mediated effects on steroidogenesis using an integrated statistical analysis of high-throughput H295R data
- PMID: 31676319
- PMCID: PMC8667012
- DOI: 10.1016/j.yrtph.2019.104510
Development of a prioritization method for chemical-mediated effects on steroidogenesis using an integrated statistical analysis of high-throughput H295R data
Abstract
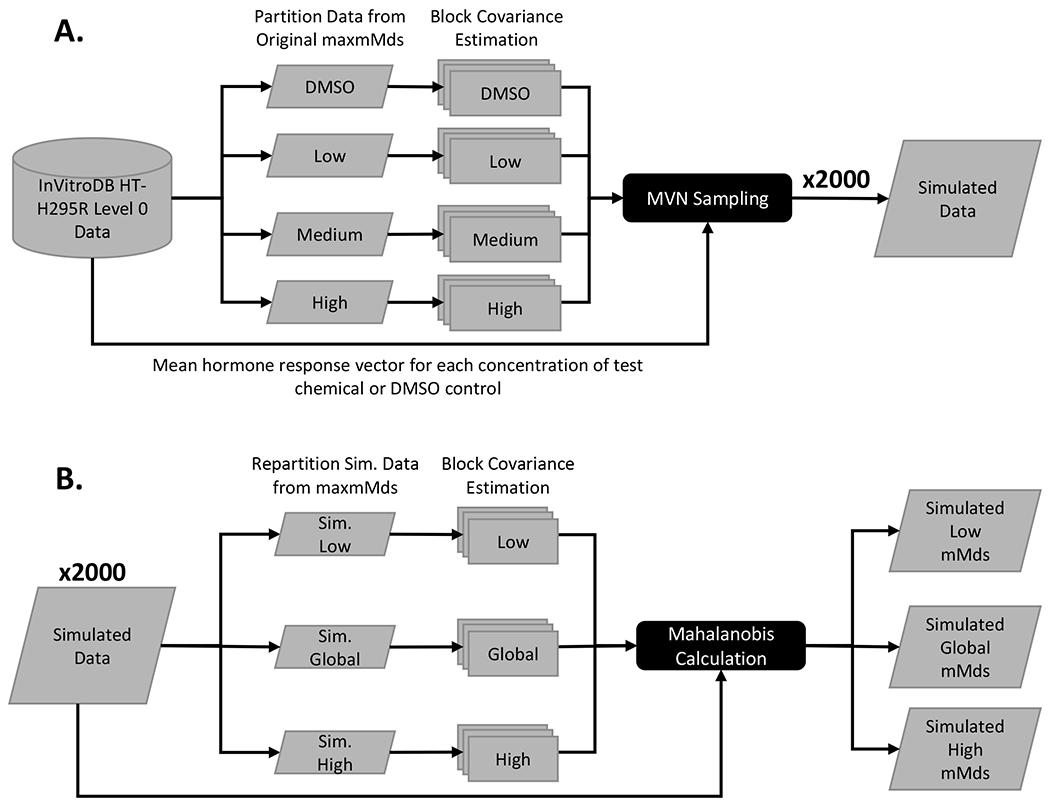
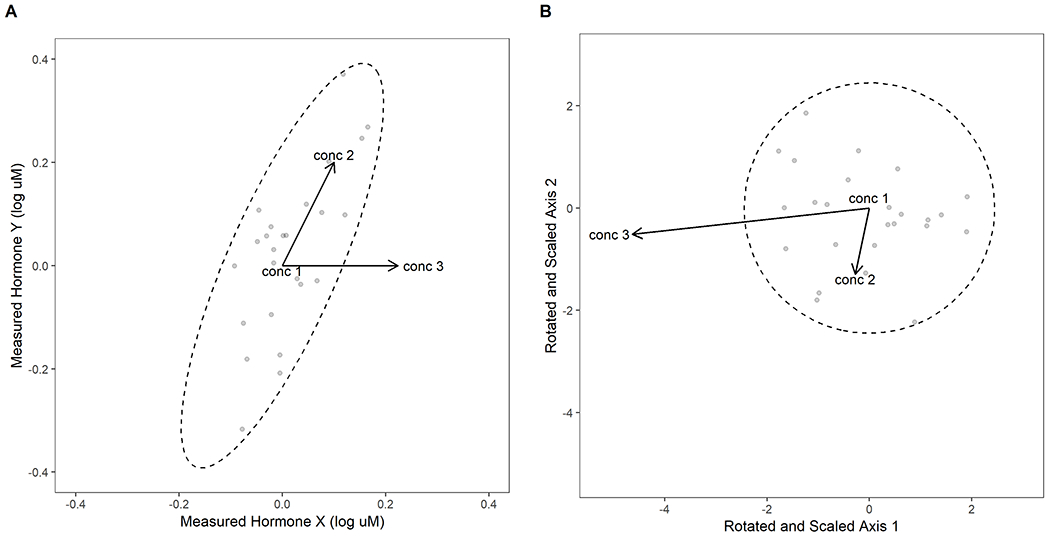
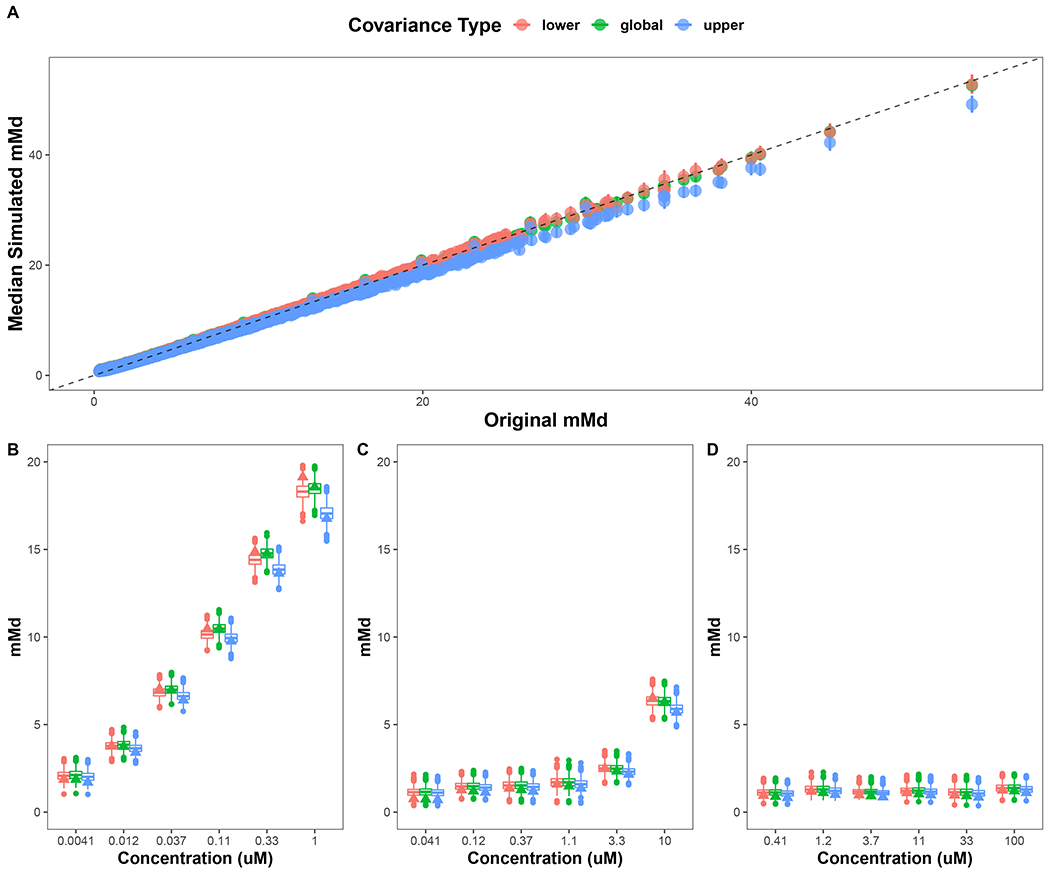
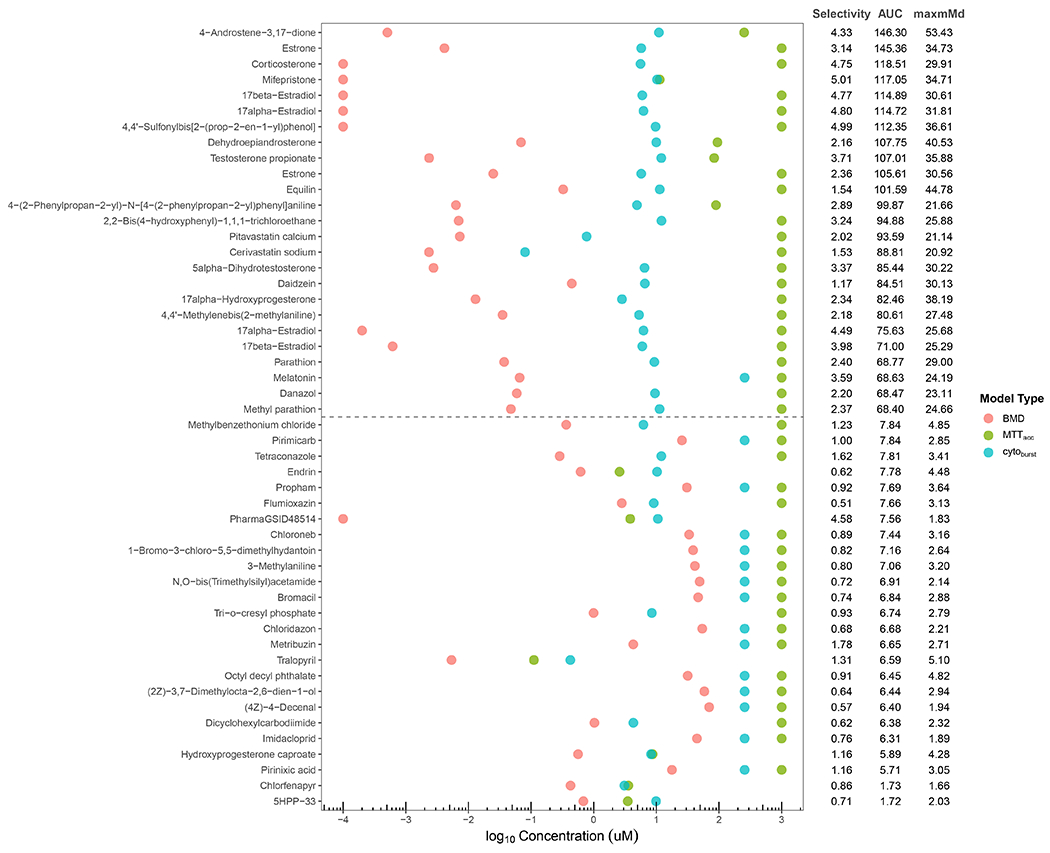
Synthesis of 11 steroid hormones in human adrenocortical carcinoma cells (H295R) was measured in a high-throughput steroidogenesis assay (HT-H295R) for 656 chemicals in concentration-response as part of the US Environmental Protection Agency's ToxCast program. This work extends previous analysis of the HT-H295R dataset and model by examining the utility of a novel prioritization metric based on the Mahalanobis distance that reduced these 11-dimensional data to 1-dimension via calculation of a mean Mahalanobis distance (mMd) at each chemical concentration screened for all hormone measures available. Herein, we evaluated the robustness of mMd values, and demonstrate that covariance and variance of the hormones measured appear independent of the chemicals screened and are inherent to the assay; the Type I error rate of the mMd method is less than 1%; and, absolute fold changes (up or down) of 1.5 to 2-fold have sufficient power for statistical significance. As a case study, we examined hormone responses for aromatase inhibitors in the HT-H295R assay and found high concordance with other ToxCast assays for known aromatase inhibitors. Finally, we used mMd and other ToxCast cytotoxicity data to demonstrate prioritization of the most selective and active chemicals as candidates for further in vitro or in silico screening.
Keywords: Endocrine disruption; Prioritization; Steroidogenesis; ToxCast.
Published by Elsevier Inc.
Figures


Similar articles
-
High-Throughput H295R Steroidogenesis Assay: Utility as an Alternative and a Statistical Approach to Characterize Effects on Steroidogenesis.Toxicol Sci. 2018 Apr 1;162(2):509-534. doi: 10.1093/toxsci/kfx274. Toxicol Sci. 2018. PMID: 29216406 Free PMC article.
-
High-Throughput Screening of Chemical Effects on Steroidogenesis Using H295R Human Adrenocortical Carcinoma Cells.Toxicol Sci. 2016 Apr;150(2):323-32. doi: 10.1093/toxsci/kfw002. Epub 2016 Jan 18. Toxicol Sci. 2016. PMID: 26781511 Free PMC article.
-
Assessment of chemical effects on aromatase activity using the H295R cell line.Environ Sci Pollut Res Int. 2010 Jun;17(5):1137-48. doi: 10.1007/s11356-009-0285-3. Epub 2010 Jan 20. Environ Sci Pollut Res Int. 2010. PMID: 20087668
-
Test driving ToxCast: endocrine profiling for 1858 chemicals included in phase II.Curr Opin Pharmacol. 2014 Dec;19:145-52. doi: 10.1016/j.coph.2014.09.021. Curr Opin Pharmacol. 2014. PMID: 25460227 Free PMC article. Review.
-
Identification of candidate reference chemicals for in vitro steroidogenesis assays.Toxicol In Vitro. 2018 Mar;47:103-119. doi: 10.1016/j.tiv.2017.11.003. Epub 2017 Nov 13. Toxicol In Vitro. 2018. PMID: 29146384 Free PMC article. Review.
Cited by
-
Application of an in Vitro Assay to Identify Chemicals That Increase Estradiol and Progesterone Synthesis and Are Potential Breast Cancer Risk Factors.Environ Health Perspect. 2021 Jul;129(7):77003. doi: 10.1289/EHP8608. Epub 2021 Jul 21. Environ Health Perspect. 2021. PMID: 34287026 Free PMC article.
-
Comparison of Approaches for Determining Bioactivity Hits from High-Dimensional Profiling Data.SLAS Discov. 2021 Feb;26(2):292-308. doi: 10.1177/2472555220950245. Epub 2020 Aug 29. SLAS Discov. 2021. PMID: 32862757 Free PMC article.
-
The Alginate Immobilization of Metabolic Enzymes Platform Retrofits an Estrogen Receptor Transactivation Assay With Metabolic Competence.Toxicol Sci. 2020 Dec 1;178(2):281-301. doi: 10.1093/toxsci/kfaa147. Toxicol Sci. 2020. PMID: 32991717 Free PMC article.
-
Advances in computational methods along the exposure to toxicological response paradigm.Toxicol Appl Pharmacol. 2022 Sep 1;450:116141. doi: 10.1016/j.taap.2022.116141. Epub 2022 Jun 29. Toxicol Appl Pharmacol. 2022. PMID: 35777528 Free PMC article.
-
Comment on "Application of an in Vitro Assay to Identify Chemicals That Increase Estradiol and Progesterone Synthesis and Are Potential Breast Cancer Risk Factors".Environ Health Perspect. 2022 May;130(5):58002. doi: 10.1289/EHP11083. Epub 2022 May 4. Environ Health Perspect. 2022. PMID: 35507340 Free PMC article. No abstract available.
References
-
- Ahmed KEM, et al., 2018. LC-MS/MS based profiling and dynamic modelling of the steroidogenesis pathway in adrenocarcinoma H295R cells. Toxicol In Vitro. 52, 332–341. - PubMed
-
- Ayub M, Levell MJ, 1987. Inhibition of testicular 17 alpha-hydroxylase and 17,20-lyase but not 3 beta-hydroxysteroid dehydrogenase-isomerase or 17 beta-hydroxysteroid oxidoreductase by ketoconazole and other imidazole drugs. J Steroid Biochem. 28, 521–31. - PubMed
-
- Breen M, et al., 2011. Mechanistic computational model of steroidogenesis in H295R cells: role of oxysterols and cell proliferation to improve predictability of biochemical response to endocrine active chemical--metyrapone. Toxicol Sci. 123, 80–93. - PubMed
Publication types
MeSH terms
Substances
Grants and funding
LinkOut - more resources
Full Text Sources
Research Materials
