. 2019 Dec 11;39(50):9900-9913.
doi: 10.1523/JNEUROSCI.1460-19.2019. Epub 2019 Nov 1.

Hydrogen Peroxide Gates a Voltage-Dependent Cation Current in Aplysia Neuroendocrine Cells

Affiliations

Hydrogen Peroxide Gates a Voltage-Dependent Cation Current in Aplysia Neuroendocrine Cells

Alamjeet K Chauhan et al. J Neurosci. .

Abstract

Nonselective cation channels promote persistent spiking in many neurons from a diversity of animals. In the hermaphroditic marine-snail, Aplysia californica, synaptic input to the neuroendocrine bag cell neurons triggers various cation channels, causing an ∼30 min afterdischarge of action potentials and the secretion of egg-laying hormone. During the afterdischarge, protein kinase C is also activated, which in turn elevates hydrogen peroxide (H2O2), likely by stimulating nicotinamide adenine dinucleotide phosphate oxidase. The present study investigated whether H2O2 regulates cation channels to drive the afterdischarge. In single, cultured bag cell neurons, H2O2 elicited a prolonged, concentration- and voltage-dependent inward current, associated with an increase in membrane conductance and a reversal potential of ∼+30 mV. Compared with normal saline, the presence of Ca2+-free, Na+-free, or Na+/Ca2+-free extracellular saline, lowered the current amplitude and left-shifted the reversal potential, consistent with a nonselective cationic conductance. Preventing H2O2 reduction with the glutathione peroxidase inhibitor, mercaptosuccinate, enhanced the H2O2-induced current, while boosting glutathione production with its precursor, N-acetylcysteine, or adding the reducing agent, dithiothreitol, lessened the response. Moreover, the current generated by the alkylating agent, N-ethylmaleimide, occluded the effect of H2O2 The H2O2-induced current was inhibited by tetrodotoxin as well as the cation channel blockers, 9-phenanthrol and clotrimazole. In current-clamp, H2O2 stimulated burst firing, but this was attenuated or prevented altogether by the channel blockers. Finally, H2O2 evoked an afterdischarge from whole bag cell neuron clusters recorded ex vivo by sharp-electrode. H2O2 may regulate a cation channel to influence long-term changes in activity and ultimately reproduction.SIGNIFICANCE STATEMENT Hydrogen peroxide (H2O2) is often studied in a pathological context, such as ischemia or inflammation. However, H2O2 also physiologically modulates synaptic transmission and gates certain transient receptor potential channels. That stated, the effect of H2O2 on neuronal excitability remains less well defined. Here, we examine how H2O2 influences Aplysia bag cell neurons, which elicit ovulation by releasing hormones during an afterdischarge. These neuroendocrine cells are uniquely identifiable and amenable to recording as individual cultured neurons or a cluster from the nervous system. In both culture and the cluster, H2O2 evokes prolonged, afterdischarge-like bursting by gating a nonselective voltage-dependent cationic current. Thus, H2O2, which is generated in response to afterdischarge-associated second messengers, may prompt the firing necessary for hormone secretion and procreation.

Keywords: H2O2; bursting; mollusk; peptidergic neuron; redox; reproduction.


Figures

Figure 1.
Figure 1.
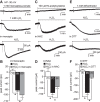
H2O2 activates a prolonged, inward, voltage-dependent current in cultured bag cell neurons. A, Left, Phase-contrast photomicrograph showing a superfusion barrel positioned near a bag cell neuron soma with neurites and the recording pipette. Neurons are whole-cell voltage-clamped at −60 mV using our standard K+-Asp-based intracellular saline in the pipette and nASW in the bath. Middle, Superfusion of 1 mm ACh (at bar) elicits an inward current. Arrows highlight the start of superfusion and travel time, i.e., the time required for ACh to reach the soma. Right, ACh superfusion produced a peak current (IACh) of −2.9 ± 1.6 nA with a latency of 38.0 ± 5.3 s following the switch from control to ACh-containing saline. B, Superfusion of 1 mm H2O2 (at bar) over the soma of different neurons, held at −60, −30, or 0 mV, causes increasingly larger inward current. Ordinate applies to all traces. C, Summary current/voltage relationship for the H2O2-induced current at −60 mV (91.0 ± 43 pA), −40 mV (51.0 ± 31.0 pA), −30 mV (230.0 ± 74.0 pA), −20 mV (288.0 ± 84.0 pA), or 0 mV (765.0 ± 138.0 pA), shows a threshold between −40 and −30 mV and an apparent maximum at 0 mV. D, Group data illustrating a 59.9 ± 12.4 s latency of the H2O2-induced current at −30 mV.
Figure 2.
Figure 2.
A concentration-dependent H2O2-induced inward current. A, Current responses to bath-applied 30 μm, 100 μm, 300 μm, or 1 mm H2O2 (at bar) for different cultured bag cell neurons whole-cell voltage-clamped at −30 mV in nASW with Cs+-Asp-based intracellular saline. Scale bars apply to all traces. B, Concentration–response curve reveals increasingly higher amounts of H2O2 induces progressively larger currents (30 μm = 4.0 ± 7.0 pA, 100 μm = 66.0 ± 13.0 pA, 300 μm = 94.0 ± 27.0 pA, 1 mm H2O2 = 218.0 ± 66.0 pA). The line represents the fit of the data with a four-parameter dose–response equation, and provides an EC50 of 14.2 mm with a Hill slope of 0.64. C, Upon washout of 1 mm H2O2 with nASW, at the height of the response, the current recovered largely back to the baseline. Inset, Summary graph shows 73.0 ± 10.6% recovery, calculated by comparing the baseline (before H2O2 superfusion) and the stable current at end of the trace.
Figure 3.
Figure 3.
H2O2 increases membrane conductance. A, Top, Typical example of 1 mm H2O2 superfusion (at bar) evoking a current in a bag cell neuron whole-cell voltage-clamped at −30 mV in nASW using Cs+-based intracellular saline. Middle, To determine membrane conductance, a 200 ms step to −40 mV is given ∼90 s before H2O2 (arrow, circled 1). A second step is taken right before H2O2 delivery (circled 2), whereas a third step is taken at the peak of the response (circled 3). Bottom, The current evoked by the step is markedly elevated at the peak of the H2O2 current (3; black trace) compared with that taken immediately (2; dark gray) or ∼90 s before H2O2 (1; light gray). B, Summary graph shows a significant increase in fold-change conductance, calculated by obtaining the ratios of the step-current taken just before H2O2 superfusion versus ∼90 s earlier (control 2/1 = 1.0 ± 0.079) and during H2O2 versus just before superfusion (H2O2 3/2 = 1.7 ± 0.33; r = 0.02381; *p = 0.0078, Wilcoxon matched-pairs signed ranks test).
Figure 4.
Figure 4.
The H2O2-induced current is sensitive to change in extracellular cations. A, Different individual cultured bag cell neurons under whole-cell voltage-clamp at −30 mV using Cs+-based intracellular saline. Compared with the current elicited by 1 mm H2O2 (at bar) in Na+-containing nASW, the response is smaller in Ca2+-free or Na+-free saline, and mostly eliminated in Na+/Ca2+-free saline. Scale bars apply to all traces. B, Group data show that, in contrast to nASW (1.2 ± 0.2 nA), Ca2+-free (151.6 ± 26.4 pA), Na+-free (65.3 ± 15.3 pA), or Na+/Ca2+-free saline (14.1 ± 7.6 pA) all significantly reduce the current (H = 29.991; df = 2; p < 0.0001, KW-ANOVA; *p < 0.05 nASW vs Ca+-free; *p < 0.01 nASW vs Na+-free; *p < 0.001, nASW vs Na+/Ca2+-free, Dunn's multiple-comparisons test). C, Difference currents obtained by subtracting the response to a 5 s, −60 to +60 mV voltage ramp (bottom inset), taken immediately before 1 mm H2O2 application, from that taken at the peak of the response. For nASW (black trace), the current is voltage-dependent and reverses between +30 and +40 mV. Upper insets show magnified Ca2+-free (dark gray), Na+-free (medium gray), and Na+/Ca2+-free (light gray) difference currents from −45 to −15 mV (left) and −15 to +15 mV (right). D, Average data illustrates a significant left-shift in reversal potential from nASW (30.6 ± 4.1 mV) with Ca2+-free (−8.4 ± 3.4 mV), Na+-free (−11.3 ± 3.4 mV), or Na+/Ca2+-free (−10.3 ± 3.7 mV) saline (F(3,37) = 27.329; p < 0.0001, ordinary ANOVA; *p < 0.01, nASW vs Ca2+-free, nASW vs Na+-free, and nASW vs Na+/Ca2+-free saline, Dunnett multiple-comparisons test). Bars as per panel B.
Figure 5.
Figure 5.
The pharmacology of the H2O2-induced current is consistent with a cation channel. A, Whole-cell voltage-clamp recording from a cultured bag cell neuron in nASW at −30 mV using Cs+-Asp-based intracellular saline shows an inward current in response to 1 mm H2O2 (at bar). Bath-application of 0.1% (v/v) DMSO (vehicle, at second bar) at the peak of the response fails to alter the normal recovery of the current. B, Delivery of 100 μm 9-Pt (top) or 10 μm clotrimazole (bottom) at the peak of the response markedly inhibits the ongoing 1 mm H2O2-induced current. C, D, Summary graphs show both 9-Pt and clotrimazole significantly increase the percent recovery of the H2O2-induced current to 76.0 ± 11.4% and 56.5 ± 14.1%, respectively, calculated by comparing the baseline (before H2O2 bath-application) and the steady-state current at the end of the trace (t(8) = 2.743; *p = 0.0253, 9-Pt, t(6) = 3.183; *p = 0.0190, clotrimazole, both unpaired Student's t test). E, Group data of the H2O2-induced current in control vs neurons pretreated with 10 μm SKF-96365. In contrast to 1 mm H2O2 alone (93.4 ± 11.4 pA), the presence of 10 μm SKF-96365 (73.3 ± 11.2 pA) does not significantly reduce the response (U(5,12) = 21.0; p = 0.3827 H2O2 vs H2O2 in SKF-96365; Mann–Whitney U test).
Figure 6.
Figure 6.
The H2O2-induced current is reduced by tetrodotoxin. A, Current responses to 1 mm H2O2 (at bar) of separate cultured bag cell neurons whole-cell voltage-clamped at −30 mV in nASW with Cs+-based intracellular saline. Compared with control (top), a 30 min pretreatment with 100 μm TTX (middle) noticeably reduces the H2O2-induced current, while 300 μm, TTX (bottom) almost eliminates the response. Ordinate applies to all traces. B, Group data of the H2O2-induced current in 100 or 300 μm TTX vs control. Compared with 1 mm H2O2 alone (79.9 ± 7.7 pA), the presence of 100 μm (47.1 ± 9.4 pA) or 300 μm TTX (15.4 ± 3.6 pA) significantly reduces the response (F(2,18) = 12.570; p = 0.0004 ordinary ANOVA, *p < 0.05 H2O2 vs H2O2 post 100 μm TTX; *p < 0.01 H2O2 vs H2O2 post 300 μm TTX, Dunnett multiple-comparisons test).
Figure 7.
Figure 7.
The H2O2-induced current is enhanced by mercaptosuccinate and reduced by N-acetylcysteine or dithiothreitol. Cultured bag cell neurons are bathed in nASW and whole-cell voltage-clamped at −30 mV using Cs+-based intracellular saline. A, Bath-application (at bar) of 1 mm mercaptosuccinate alone has little effect (top), whereas delivery of 1 mm H2O2 to a second cell elicits a noticeable inward current (middle). Moreover, in a third neuron initially given mercaptosuccinate (mercapto), the H2O2-induced current is enhanced by ∼50% (bottom). Ordinate applies to all traces. B, Summary graph of peak mercaptosuccinate- and H2O2-induced current ± mercaptosuccinate. There is a significant difference between both the H2O2-induced current with (98.1 ± 9.6 pA) and without (66.4 ± 5.8 pA) mercaptosuccinate as well as mercaptosuccinate alone (7.3 ± 7.2 pA; F(2,21) = 50.879; p < 0.0001, ordinary ANOVA; *p < 0.001 mercapto vs H2O2; *p < 0.05 H2O2 vs H2O2 in mercapto, Tukey–Kramer multiple-comparisons test). C, Introducing 100 μm NAC has only a nominal impact (top), whereas 1 mm H2O2 generates an inward current (middle). In the presence of N-acetylcysteine, the H2O2-induced current is reduced by ∼40% (bottom). D, Summary data showing that compared with N-acetylcysteine alone (43.3 ± 25.7 pA), the H2O2-induced current differs significantly with (90.3 ± 21.4 pA) and without N-acetylcysteine (148.0 ± 16.0 pA; U(6,7) = 0; *p = 0.0034 NAC vs H2O2; U(6,7) = 5; *p = 0.0221 H2O2 vs H2O2 in NAC, both Mann–Whitney U test). E, Minimal response to 1 mm DTT alone (top), whereas 1 mm H2O2 again elicits a clear inward current (middle); in addition, when DTT is already present, the H2O2-induced current is reduced by ∼70% (bottom). F, Group data showing that compared with DTT alone (11.3 ± 4.5 pA), the H2O2-induced current differs significantly with (43.2 ± 9.6 pA) and without DTT (155.0 ± 13.2 pA; F(2,15) = 73.831; p < 0.0001, ordinary ANOVA; *p < 0.001 DTT vs H2O2; *p < 0.001 H2O2 vs H2O2 in DTT, Tukey–Kramer multiple-comparisons test).
Figure 8.
Figure 8.
NEM- and H2O2-induced currents are occlusive. Representative response to 300 μm NEM or 1 mm H2O2 of different cultured bag cell neurons whole-cell voltage-clamped at −30 mV in nASW with Cs+-based intracellular saline. A, Bath-application (at bar) of NEM evokes a prominent inward current. Yet, H2O2 (at second bar) in the presence of NEM, yields little further change. B, Delivery of H2O2 elicits a typical inward current in a separate neuron, but there is no obvious current when NEM is applied in the presence of H2O2. C, D, Summary data demonstrates a significant difference between the NEM-elicited current (201.0 ± 65.5 pA) and the H2O2-induced current post-NEM (11.7 ± 13.1 pA; U(9,9) = 7.0; *p = 0.0019, Mann–Whitney U test). Similarly, there is a significant difference between the H2O2-induced current (129.6 ± 24.5 pA) and the NEM-elicited current post-H2O2 (6.3 ± 5.9 pA; (t(4) = 4.90; *p = 0.008, unpaired Student's t test, Welch corrected). Note, there is no statistical difference between the initial current produced by NEM and H2O2 (white bars; t(9) = 1.022; p = 0.3337, unpaired Student's t test, Welch corrected); as well, the NEM- and the H2O2-induced currents in the presence of H2O2 and NEM, respectively, are not statistically different (black bars; U(5,9) = 14.0; p = 0.2977, Mann–Whitney U test).
Figure 9.
Figure 9.
H2O2 depolarizes and induces robust action potential firing. A, Separate cultured bag cell neurons are whole-cell current-clamped in nASW with K+-based intracellular saline and initially set to either −40 or −60 mV with bias current. Bath-application (at bar) of H2O (0.5% v/v) at −40 (top) or −60 mV (bottom) does not affect membrane voltage. Ordinate applies to both traces. B, Exposure to 100 μm H2O2 depolarizes two different neurons from both −40 (top) and −60 (bottom) mV, but neither reaches threshold. Ordinate applies to both traces. C, Delivery of 1 mm H2O2 depolarizes the membrane and induces robust action potential firing from both −40 (top) and −60 (bottom) mV in separate cells. Ordinate applies to both traces. D, Summary graph indicating the average depolarizations from −40 (open circles) or −60 (closed circles) mV. Compared with the response produced by applying H2O (−40 mV: 2.8 ± 0.8 mV; −60 mV: 1.1 ± 0.6 mV), the depolarization elicited by 100 μm H2O2 (−40 mV: 7.5 ± 0.6 mV; −60 mV: 14.0 ± 2.6 mV) or 1 mm H2O2 (−40 mV: 11.4 ± 2.9; −60 mV: 21.8 ± 2.1) is significantly different (−40 mV: H = 8.545; df = 1; p = 0.0070, KW-ANOVA; p > 0.05 H2O vs 100 μm H2O2; *p < 0.05 H2O vs 1 mm H2O2, Dunn's multiple-comparison's test; −60 mV: F(2,12) = 29.275; p < 0.0001, ordinary ANOVA; *p < 0.01 H2O vs 100 μm H2O2, *p < 0.001 H2O vs 1 mm H2O2, Tukey–Kramer multiple-comparisons test). E, Group data show no significant difference in the frequency (t(8) = 0.2841; p = 0.7835, unpaired Student's t test) or duration (t(8) = 0.3884; p = 0.7079, unpaired Student's t test) of action potential firing from −40 versus −60 mV caused by 1 mm H2O2. In addition, there is no significant difference in the latency, i.e., the time it takes for the neuron to start firing action potentials post-H2O2 delivery, between responses at −40 mV (2.8 ± 0.6 mV) and −60 mV (3.0 ± 0.6 mV; t(8) = 0.3001; p = 0.7718, unpaired Student's t test).
Figure 10.
Figure 10.
H2O2-evoked spiking is reduced by tetrodotoxin and prevented by 9-Pt or clotrimazole. Voltage responses to 1 mm H2O2 of different cultured bag cell neurons whole-cell current-clamped to −40 mV in nASW with K+-based intracellular saline after 20 min pretreatment with clotrimazole, 9-Pt, or TTX. A, Bath-application of 1 mm H2O2 (at bar) induces robust action potential firing (top). However, a 20 min pretreatment with 10 μm clotrimazole (upper middle) or 100 μm 9-phenanthrol (lower middle) virtually eliminates the depolarization and prevents firing all together. Finally, after 20 min of 300 μm TTX (bottom), introducing H2O2 still leads to membrane depolarization, but the duration and frequency of action potential firing is lessened. The ordinate applies to all traces. B, Summary graph indicating the average H2O2-evoked depolarization (top) in the presence of 300 μm TTX does not differ significantly from 1 mm H2O2 alone (U(4,18) = 32.0; p = 0.7743, Mann–Whitney U test). However, spike frequency (middle) and duration (bottom) are significantly reduced when TTX is in the bath (frequency: U(4,18) = 6.0; *p = 0.0120; duration: U(4,18) = 5.0; *p = 0.0049, both Mann–Whitney U test).
Figure 11.
Figure 11.
H2O2 depolarizes bag cell neurons and initiates an afterdischarge in desheathed clusters. A, Under sharp-electrode current-clamp, a 2 s 1 mm ACh pressure ejection (arrow) to one side of the cluster depolarizes a bag cell neuron recorded on the opposite side. B, Bath-application of 10 mm H2O2 (bar) post-ACh delivery initiates a prolonged burst in a bag cell neuron within a cluster. Inset, Phase-contrast photomicrograph of a desheathed bag cell neuron cluster in tcASW indicating the placement of the ACh-containing pressure ejection electrode and the intracellular current-clamp (cc) sharp electrode. C, Following 1 mm ACh pressure ejection, 10 mm H2O2 is introduced 8.3 min later and induces a depolarization (23.2 ± 2.5 mV; t(12) = 3.375; *p = 0.0055, unpaired Student's t test) that evokes a burst, whereas 10 mm H2O2 alone solely depolarizes the neuron, but to a significantly lesser extent (9.8 ± 3.6 mV; left). During the H2O2-evoked burst, the frequency of action potential firing is 0.8 ± 0.2 Hz (left), mean discharge duration is 6.4 ± 1.4 min (middle), and the latency is 3.4 ± 0.7 min (right).

References

    1. Antunes LM, Darin JD, Bianchi MD (2000) Protective effects of vitamin C against cisplatin-induced nephtotoxicity and lipid peroxidation in adult rats. Pharmacol Res 41:405–411. 10.1006/phrs.1999.0600 - DOI - PubMed
    1. Arch S. (1972) Polypeptide secretion from the isolated parietovisceral ganglion of Aplysia californica. J Gen Physiol 59:47–59. 10.1085/jgp.59.1.47 - DOI - PMC - PubMed
    1. Arch S, Smock T (1977) Egg-laying behavior in Aplysia californica. Behav Biol 19:45–54. 10.1016/S0091-6773(77)91331-1 - DOI
    1. Avshalumov MV, Chen BT, Koós T, Tepper JM, Rice ME (2005) Endogenous hydrogen peroxide regulates the excitability of midbrain dopamine neurons via ATP-sensitive potassium channels. J Neurosci 25:4222–4231. 10.1523/JNEUROSCI.4701-04.2005 - DOI - PMC - PubMed
    1. Avshalumov MV, Bao L, Patel JC, Rice ME (2007) H2O2 signaling in the nigrostriatal dopamine pathway via ATP-sensitive potassium channels: issues and answers. Antioxid Redox Signal 9:219–231. 10.1089/ars.2007.9.219 - DOI - PubMed

Publication types

MeSH terms