. 2019 Dec 4;39(49):9689-9701.
doi: 10.1523/JNEUROSCI.1142-19.2019. Epub 2019 Nov 1.

Disrupted Blood-Retina Lysophosphatidylcholine Transport Impairs Photoreceptor Health But Not Visual Signal Transduction

Affiliations

Disrupted Blood-Retina Lysophosphatidylcholine Transport Impairs Photoreceptor Health But Not Visual Signal Transduction

Ekaterina S Lobanova et al. J Neurosci. .

Abstract

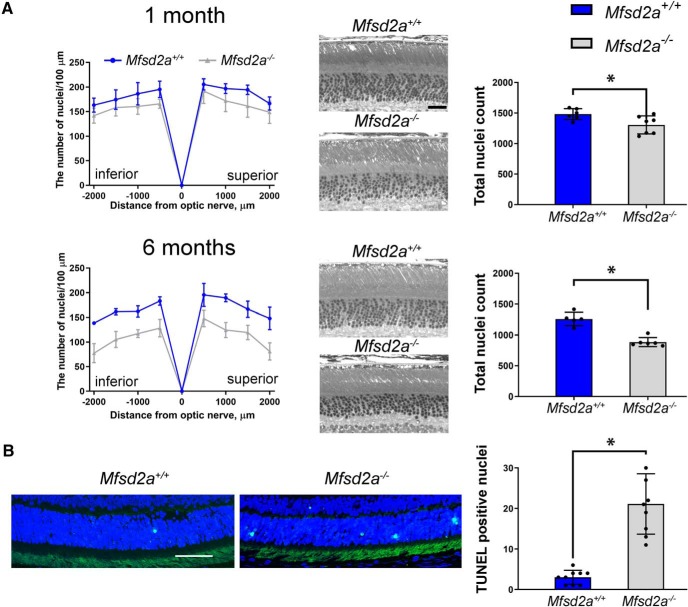
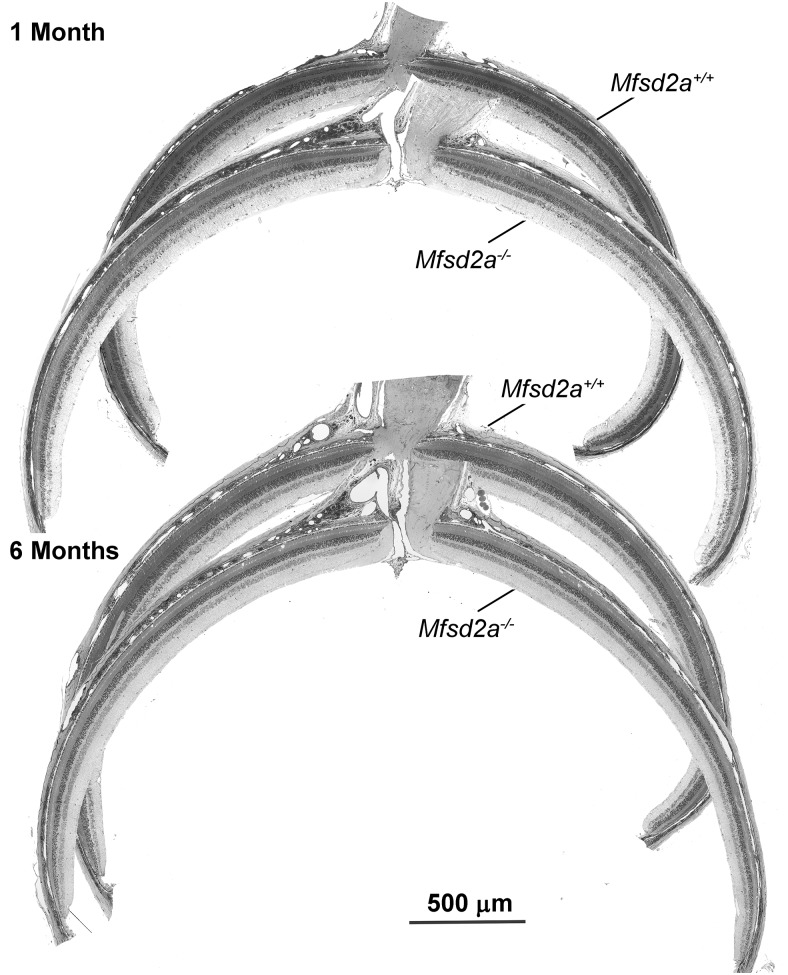
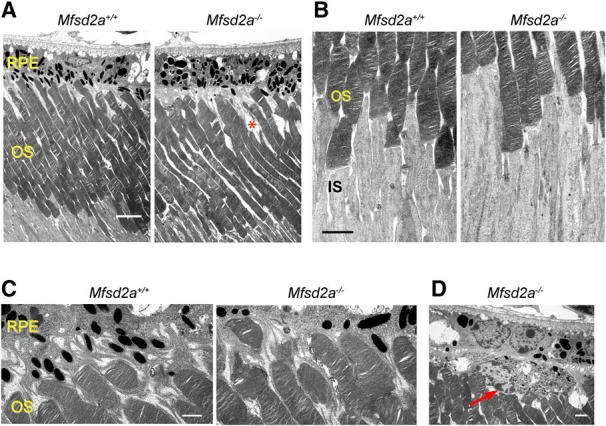
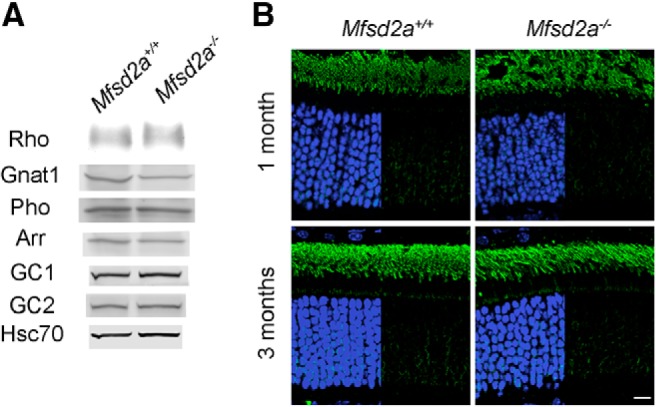
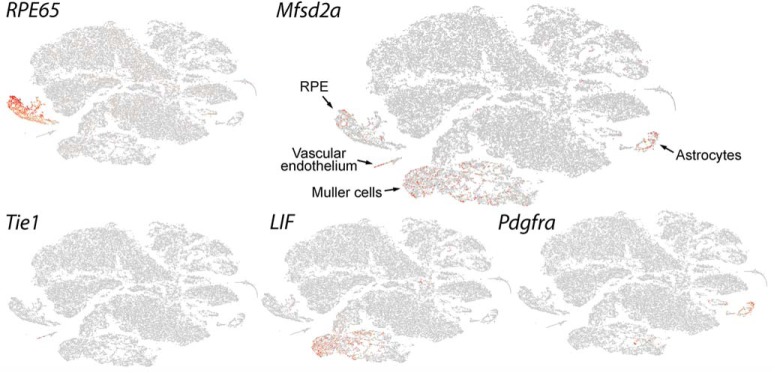
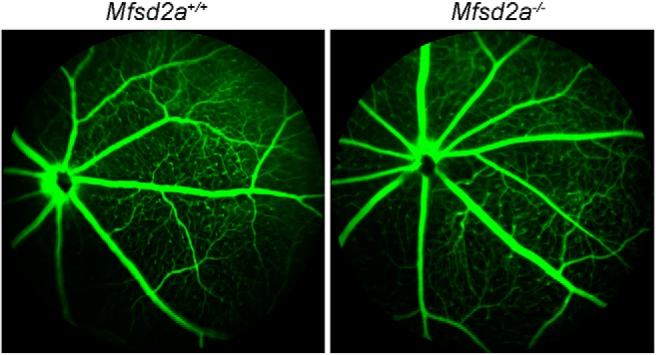
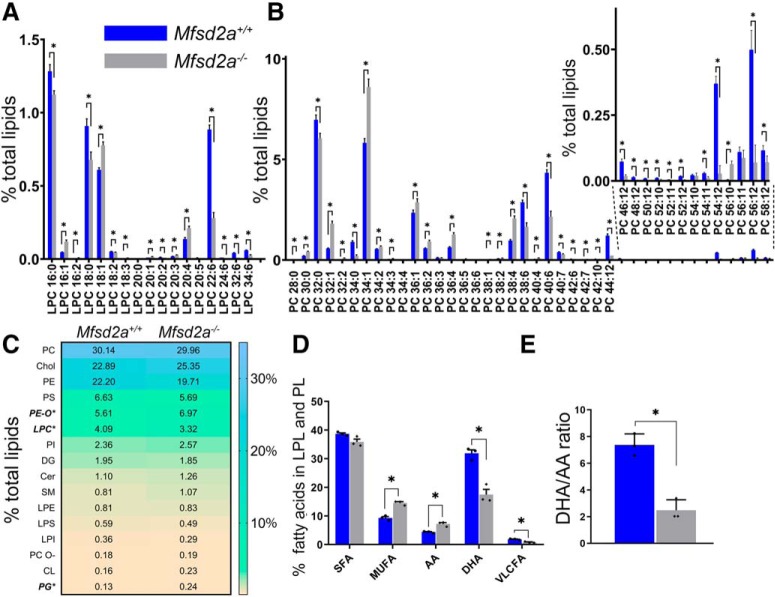
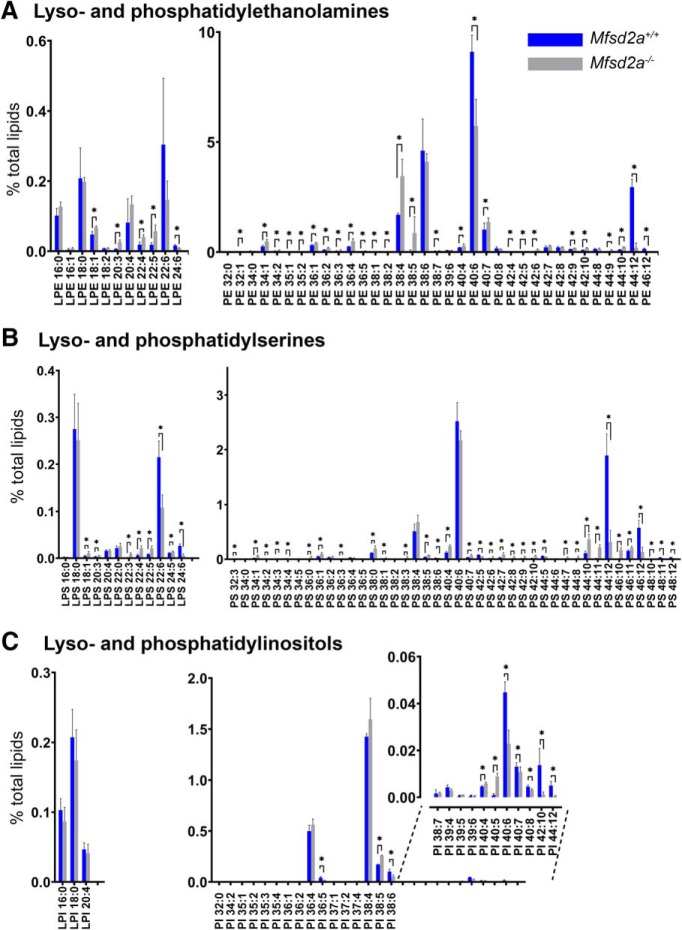
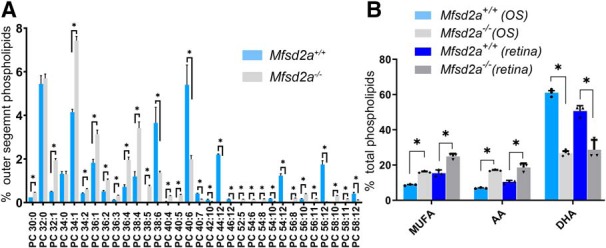
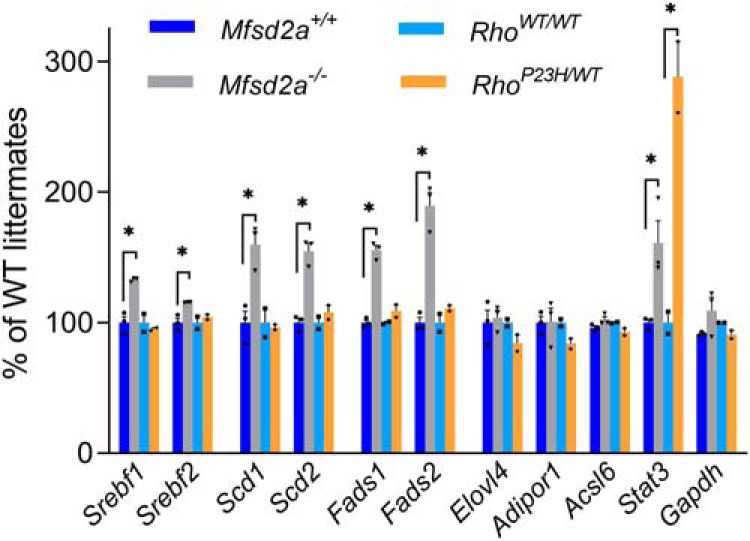
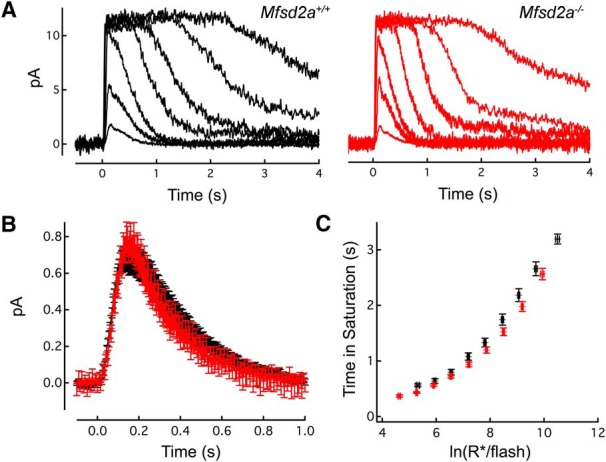
Retinal photoreceptor cells contain the highest concentration of docosahexaenoic acid (DHA) in our bodies, and it has been long assumed that this is critical for supporting normal vision. Indeed, early studies using DHA dietary restriction documented reduced light sensitivity by DHA-deprived retinas. Recently, it has been demonstrated that a major route of DHA entry in the retina is the delivery across the blood-retina barrier by the sodium-dependent lipid transporter, Mfsd2a. This discovery opened a unique opportunity to analyze photoreceptor health and function in DHA-deprived retinas using the Mfsd2a knock-out mouse as animal model. Our lipidome analyses of Mfsd2a-/- retinas and outer segment membranes corroborated the previously reported decrease in the fraction of DHA-containing phospholipids and a compensatory increase in phospholipids containing arachidonic acid. We also revealed an increase in the retinal content of monounsaturated fatty acids and a reduction in very long chain fatty acids. These changes could be explained by a combination of reduced DHA supply to the retina and a concomitant upregulation of several fatty acid desaturases controlled by sterol regulatory element-binding transcription factors, which are upregulated in Mfsd2a-/- retinas. Mfsd2a-/- retinas undergo slow progressive degeneration, with ∼30% of photoreceptor cells lost by the age of 6 months. Despite this pathology, the ultrastructure Mfsd2a-/- photoreceptors and their ability to produce light responses were essentially normal. These data demonstrate that, whereas maintaining the lysophosphatidylcholine route of DHA supply to the retina is essential for long-term photoreceptor survival, it is not important for supporting normal phototransduction.SIGNIFICANCE STATEMENT Phospholipids containing docosahexaenoic acid (DHA) are greatly enriched in the nervous system, with the highest concentration found in the light-sensitive membranes of photoreceptor cells. In this study, we analyzed the consequences of impaired DHA transport across the blood-retina barrier. We have found that, in addition to a predictable reduction in the DHA level, the affected retinas undergo a complex, transcriptionally-driven rebuilding of their membrane lipidome in a pattern preserving the overall saturation/desaturation balance of retinal phospholipids. Remarkably, these changes do not affect the ability of photoreceptors to produce responses to light but are detrimental for the long-term survival of these cells.

Keywords: DHA; Mfsd2a; phospholipids; photoreceptor; retina; retinal degeneration.


Figures

Figure 1.
Figure 1.
Morphometric analysis of photoreceptors in Mfsd2a−/− mice. A, Left, Spider diagrams representing the number of photoreceptor nuclei in 100 μm segments of the inferior and superior retina counted at various distances from the optic nerve head. Data collected from 1- and 6-month-old Mfsd2a−/− mice and their WT littermates are shown as mean ± SD; *p ≤ 0.05. The number of eyes analyzed at 1 month was 7 Mfsd2a−/− and 6 WT; at 6 months 6 Mfsd2a−/− and 5 WT. Mouse genotypes are indicated above the panels. Middle, Representative images of superior retinal cross-sections at ∼1 mm distance from the optic nerve head. Scale bar, 25 μm. For images of representative cross-sections through the entire retinas see Figure 2. Right, The total number of nuclei in all 100 μm retinal segments presented in the spider diagrams. p = 0.028 for 1-month-old mice; p = 7.7 × 10⁻⁵ for 6-month-old mice. B, Left, Representative images of TUNEL-processed retinas from Mfsd2a−/− and WT littermate mice analyzed at 1 month of age. The green fluorescent signal represents nuclei of apoptotic cells. Right, An average number of TUNEL-positive cells per whole cross-section of Mfsd2a−/− and WT mice. At least four independently processed sections from both eyes of two mice (1 male and 1 female) for each genotype were analyzed. Data are shown as mean ± SD; p = 2 × 10⁻⁶.
Figure 2.
Figure 2.
Plastic sections cut through the entire retinas of Mfsd2a−/− mice and their WT littermates at indicated ages. Sections are stained by toluidine blue and shown in grayscale.
Figure 3.
Figure 3.
Ultrastructural analysis of Mfsd2a−/− mice. A, Electron micrographs of retinal cross-sections from 1-month-old mice of each genotype. A malformed outer segment (OS) in the Mfsd2a−/− retina is marked by an asterisk. Scale bar, 5 μm. B, A higher-magnification view of the inner segment (IS)–outer segment interface. Scale bar, 2 μm. C, A higher-magnification view of the outer segment–RPE interface. Scale bar, 1 μm. D, A microglial cell in the subretinal space of the Mfsd2a−/− mouse (red arrow). Note a nucleus on the left side and a dense cluster of phagosomes on the right side of this cell. Scale bar, 1 μm.
Figure 4.
Figure 4.
Loss of Mfsd2a does not affect expression levels and localization of phototransduction proteins. A, The expression of rhodopsin and several other major photoreceptor proteins in the retinas of 5-week-old Mfsd2a−/− mice. Western blots were performed with aliquots of retinal lysates containing 0.5 μg total protein for rhodopsin and 20 μg total protein for other proteins. Each determination was repeated for at least four pairs of WT and Mfsd2a−/− animals. Rho, Rhodopsin; Gnat1, transducin α-subunit; Pho- phosducin; Arr, arrestin-1; GC1 and GC2, two retinal guanylate cyclase isoforms. Hsc70 is used as a loading control. B, Subcellular localization of rhodopsin (green) in 1- and 3-month-old Mfsd2a−/− and their WT littermate mice. Scale bar, 10 μm. Nuclei are stained by Hoechst (blue).
Figure 5.
Figure 5.
T-distributed stochastic neighbor embedding (t-SNE)-dimension reduction of gene expression profiles of single cells prepared from WT mouse eyes. The populations of cells expressing Mfsd2a overlap with cells expressing markers of RPE (Rpe65, retinal pigment epithelium-specific 65 kDa protein), vascular endothelium cells (Tie1, tyrosine kinase with Ig-like and EGF-like domains 1), Müller cells (LIF, leukemia inhibitory factor), and astrocytes (Pdgfra, platelet derived growth factor receptor α).
Figure 6.
Figure 6.
Fluorescein angiograms of Mfsd2a−/− and WT littermate mice. The data are taken from one of four similar experiments (see Materials and Methods).
Figure 7.
Figure 7.
Lipidomic analysis of isolated retinas from Mfsd2a−/− mice and their WT littermates. Lipid profiles for (A) lysophosphatidylcholine and (B) phosphatidylcholine shown as percentage of total amount from measured lipid classes (for complete dataset, see Figure 7-1). Statistically significant changes (p ≤ 0.05) are marked by asterisks. C, Relative representation of all measured lipid classes shown as percentage total. Three lipid classes for which the change was statistically significant between the two mouse types are marked with asterisks. The abundance of each lipid class in each dataset is color-coded with the scale shown on the right. D, Changes in the fractions of SFA, MUFA, AA, DHA, and VLCFA in Mfsd2a−/− and WT mice. Values are calculated based on the total amounts of each fatty acid type in all identified lysophospholipids (LPL) and phospholipids (PL; for complete dataset, see Figure 7-1). E, The DHA/AA molar ratios in Mfsd2a−/− and WT mice. Data are shown as mean ± SD.
Figure 8.
Figure 8.
Lipidomic analysis of LPE, PE, LPS, PS, LPI and PI phospholipids in isolated retinas from Mfsd2a−/− mice and their WT littermates. Lipid profiles of (A) lyso- and phosphatidylethanolamines, (B) lyso- and phosphatidylserines, and (C) lyso- and phosphatidylinositols shown as percentage of total phospholipids from all measured classes (for complete dataset, see Figure 7-1). Statistically significant changes (p ≤ 0.05) are marked by asterisks.
Figure 9.
Figure 9.
Lipidomic analysis of rod outer segment preparations isolated from Mfsd2a−/− mice and their WT littermates. A, Lipid profiles for PC species shown as percentage of total outer segment phospholipid content. Only phospholipids present at the levels exceeding 0.15% of the total phospholipids content in either genotype are shown. For a complete dataset, see Figure 7-1 (tab “Major OS PL %”). B, Changes in the fractions of phospholipids containing MUFA, AA, and DHA shown as percentage of total phospholipids. The values are calculated from molar fractions of major PC, PE, PS, and PI species containing fatty acids of each type and shown as percentage of total phospholipids (Figure 7-1, tab Major OS PL %). For comparison, a similar calculation for PC, PE, PS, and PI only is performed for the whole retina and plotted side-by-side with outer segment data (Figure 7-1, tab “Major retinal PL %”). Data are shown as mean ± SD (n = 3). Statistically significant changes (p ≤ 0.05) are marked by asterisks.
Figure 10.
Figure 10.
Comparative analysis of selected gene expression changes in Mfsd2a−/− and RhoP23H/WT mice. Relative gene expression levels were calculated from the corresponding RPKM values. Data are shown as percentage of WT littermates for each genotype and expressed as mean ± SD (n = 3 for Mfsd2a−/−; n = 2 for RhoP23H/WT mice). Gapdh (glyceraldehyde 3-phosphate dehydrogenase) was used as a sample normalization control. Statistically significant changes (p ≤ 0.05) are marked with asterisks. For a complete dataset, see Figure 10-1, and for the enriched pathway analysis, see Figure 10-2.
Figure 11.
Figure 11.
Loss of Mfsd2a does not impede phototransduction. A, Representative families of flash responses from a WT (black) and Mfsd2a−/− (red) rod. Flash strengths ranged from 8.8 to 39,000 photons μm−2 by factors of 4. B, Population average single-photon responses from KO (n = 9) and WT (n = 24) of littermates aged 69 and 70 d, respectively. Average maximal response amplitudes for these populations were 13.2 ± 0.7 and 14.2 ± 0.7 pA, respectively (p = 0.4). C, Plot comparing the time that bright flash response remained in saturation as a function of the natural log of the number of photoexcited rhodopsins (R*), showing the similarity of the behavior of bright flash responses.

References

    1. Alakbarzade V, Hameed A, Quek DQ, Chioza BA, Baple EL, Cazenave-Gassiot A, Nguyen LN, Wenk MR, Ahmad AQ, Sreekantan-Nair A, Weedon MN, Rich P, Patton MA, Warner TT, Silver DL, Crosby AH (2015) A partially inactivating mutation in the sodium-dependent lysophosphatidylcholine transporter MFSD2A causes a non-lethal microcephaly syndrome. Nat Genet 47:814–817. 10.1038/ng.3313 - DOI - PubMed
    1. Anderson RE, Benolken RM, Dudley PA, Landis DJ, Wheeler TG (1974) Proceedings: polyunsaturated fatty acids of photoreceptor membranes. Exp Eye Res 18:205–213. 10.1016/0014-4835(74)90149-3 - DOI - PubMed
    1. Angela M, Endo Y, Asou HK, Yamamoto T, Tumes DJ, Tokuyama H, Yokote K, Nakayama T (2016) Fatty acid metabolic reprogramming via mTOR-mediated inductions of PPARγ directs early activation of T cells. Nat Commun 7:13683. 10.1038/ncomms13683 - DOI - PMC - PubMed
    1. Bazan NG. (2018) Docosanoids and elovanoids from omega-3 fatty acids are pro-homeostatic modulators of inflammatory responses, cell damage and neuroprotection. Mol Aspects Med 64:18–33. 10.1016/j.mam.2018.09.003 - DOI - PMC - PubMed
    1. Bazan NG, Molina MF, Gordon WC (2011) Docosahexaenoic acid signalolipidomics in nutrition: significance in aging, neuroinflammation, macular degeneration, Alzheimer's, and other neurodegenerative diseases. Annu Rev Nutr 31:321–351. 10.1146/annurev.nutr.012809.104635 - DOI - PMC - PubMed

Publication types

MeSH terms