. 2019 Dec 6;294(49):18807-18819.
doi: 10.1074/jbc.RA119.010648. Epub 2019 Nov 1.

Hyperglycemia-induced inflamm-aging accelerates gingival senescence via NLRC4 phosphorylation

Affiliations

Hyperglycemia-induced inflamm-aging accelerates gingival senescence via NLRC4 phosphorylation

Peng Zhang et al. J Biol Chem. .

Abstract

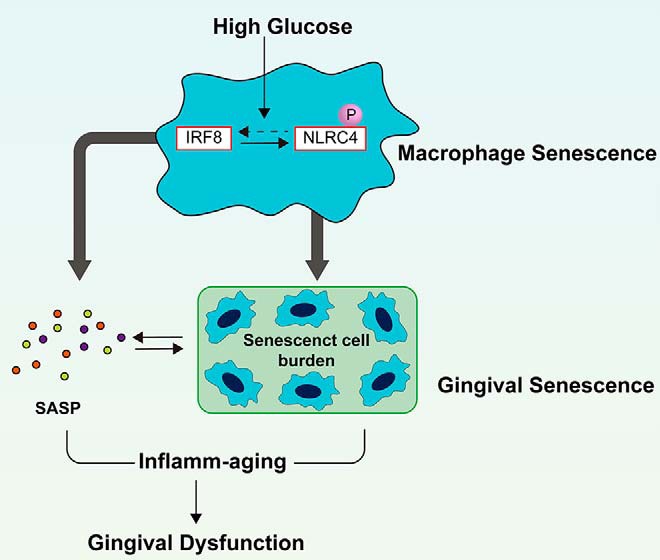
Inflamm-aging was recently affiliated with the progression of diabetic complications. Local cellular senescence together with senescence-associated secretory phenotype (SASP) are the main contributors to inflamm-aging. However, little is known about their involvement in diabetic periodontitis. Gingiva is the first line of host defense in the periodontium, and macrophages are key SASP-carrying cells. Here, we explored the molecular mechanism by which hyperglycemia drives the inflamm-aging in the gingival tissue of diabetic mice and macrophages. We demonstrated that hyperglycemia increased the infiltrated macrophage senescence in gingival tissue of diabetic mice. Simultaneously, hyperglycemia elevated the local burden of senescent cells in gingival tissue and induced the serum secretion of SASP factors in vivo Moreover, in vitro, high glucose induced macrophage senescence and SASP factors secretion through phosphorylation of NLRC4, which further stimulated the NF-κB/Caspase-1 cascade via an IRF8-dependent pathway. Deletion of NLRC4 or IRF8 abolished hyperglycemia-induced cellular senescence and SASP in macrophages. In addition, we found that treatment with metformin inhibited NLRC4 phosphorylation and remarkably decreased cellular senescence and SASP in the context of hyperglycemia. Our data demonstrated that hyperglycemia induces the development of inflamm-aging in gingival tissue and suggested that NLRC4 is a potential target for treatment of diabetes-associated complications.

Keywords: NLRC4; SASP; aging; cellular senescence; diabetes; gingiva; hyperglycemia; inflamm-aging; inflammasome; inflammation.


Conflict of interest statement

The authors declare that they have no conflicts of interest with the contents of this article

Figures

Figure 1.
Figure 1.
Hyperglycemia increased the gingival senescent burden and induced serum SASP in diabetic mice. A, all protocols were performed strictly according to the procedure. C57 mice were rendered diabetic by STZ injections and sacrificed every 2 weeks. B, fasting glucose levels were determined every 2 weeks from weeks 5 to 17. The p value between control mice (N group) and diabetic mice (D group) is shown. **, p < 0.01. C, Western blotting analysis showing p16 and p21 specific immunoreactivity in the gingival tissue of the N group and the D group. The optical density (O.D.) values of p16 and p21 levels relative to β-actin are represented in bar histograms. The data are means ± S.D. (n = 3). *, p < 0.05; **, p < 0.01 versus N group. Panel C here and panels A and E in Fig. 3 use the same band of β-actin because of the identical protein sample in same Western blotting experiment. D, immunohistochemistry using antibody against p16 and p21 was analyzed in the gingival tissue of N group and D group. Scale bar, 50 μm. The percentage of positive cells is represented in bar histograms. The data are means ± S.D. (n = 3). *, p < 0.05; **, p < 0.01 versus N group. E, the SASP factors in the serum of N group and D group were determined every 2 weeks by a Luminex assay customization tool and shown in the heat map. F, gingival tissues of N group and D group were stained for immunofluorescence using an F4/80 antibody targeting macrophages (red) and a p16 antibody (green). The nuclei were stained with DAPI (blue). Scale bar, 50 μm.
Figure 2.
Figure 2.
High glucose induced cellular senescence and SASP in macrophage derived from RAW 264.7 cell. A, the activity of SA–β-gal was determined in macrophage exposed to 5–30 mm glucose for 6 or 24 h. Scale bar, 100 μm. The rate of SA–β-gal–positive (blue-stained) cells is represented in bar histograms. The data are means ± S.D. (n = 3). **, p < 0.01 versus 30 mm glucose for 6 h. ##, p < 0.01 versus 30 mm glucose for 24 h. B, the expression levels of p16 and p21 in macrophage were analyzed by Western blotting. The O.D. values of p16 and p21 levels relative to β-actin are represented in bar histograms. The data are means ± S.D. (n = 3). *, p < 0.05; **, p < 0.01 versus 30 mm glucose for 6 h. #, p < 0.05; ##, p < 0.01 versus 30 mm glucose for 24 h. Panel B here and panels C and F in Fig. 3 use the same band of β-actin because of the identical protein sample in same Western blotting experiment. C, the SASP factors in the supernatant of macrophage were determined by a Luminex assay customization tool and shown in the heat map. D, cell proliferation was detected using EdU detection kits to analyze the incorporation of EdU during DNA synthesis. Scale bar, 100 μm. The percentage of proliferating cells is represented in bar histograms. The data are means ± S.D. (n = 3). **, p < 0.01 versus 30 mm glucose for 6 h. ##, p < 0.01 versus 30 mm glucose for 24 h.
Figure 3.
Figure 3.
NLRC4-related pathway was activated in the gingival tissue of diabetic mice and macrophage exposed to high glucose for 24 h. A, Western blotting analysis showing IRF8, p-NLRC4, and NLRC4 specific immunoreactivity in the gingival tissue of the N and D groups. The O.D. values of IRF8, p-NLRC4, and NLRC4 levels relative to β-actin are represented in bar histograms. The data are means ± S.D. (n = 3). *, p < 0.05; **, p < 0.01 versus N group. B, representative of immunohistochemical staining of IRF8 and NLRC4 on the gingival sections from the N group and D group. Scale bar, 50 μm. The percentage of positive cells was calculated and is represented in bar histograms. The data are means ± S.D. (n = 3). *, p < 0.05; **, p < 0.01 versus N group. C, the expression levels of IRF8, p-NLRC4, and NLRC4 in macrophage were analyzed by Western blotting. The O.D. values of IRF8, NLRC4, and p-NLRC4 levels relative to β-actin are represented in bar histograms. The data are means ± S.D. (n = 3). *, p < 0.05; **, p < 0.01 versus 30 mm glucose for 6 h. #, p < 0.05; ##, p < 0.01 versus 30 mm glucose for 24 h. The black vertical line represents the splicing border, because there is a protein marker between the 6- and 24-h samples in one band. D, IRF8 and NLRC4 levels were measured by immunofluorescence staining. Scale bar, 50 μm. The fluorescence intensity is represented in bar histograms. The data are means ± S.D. (n = 3). *, p < 0.05; **, p < 0.01 versus 5 mm glucose for 24 h. E, the expression levels of Caspase-1, cleaved Caspase-1, and NF-κB were analyzed by Western blotting in vivo. The O.D. values of Caspase-1, cleaved Caspase-1, and NF-κB levels relative to β-actin are represented in bar histograms. The data are means ± S.D. (n = 3). *, p < 0.05; **, p < 0.01 versus N group. Fig. 1C and panels A and E in Fig. 3 use the same band of β-actin because of the identical protein sample in same Western blotting experiment. F, the expression levels of Caspase-1, cleaved Caspase-1, and NF-κB were analyzed by Western blotting in vitro. The O.D. values of Caspase-1, cleaved Caspase-1, and NF-κB levels relative to β-actin are represented in bar histograms. The data are means ± S.D. (n = 3). *, p < 0.05; **, p < 0.01 versus 30 mm glucose for 6 h. #, p < 0.05; ##, p < 0.01 versus 30 mm glucose for 24 h. The black vertical line represents the splicing border, because there is a protein marker between the 6- and 24-h samples in one band. Figs. 2B and 3 (C and F) use the same band of β-actin because of the identical protein sample in same Western blotting experiment.
Figure 4.
Figure 4.
High glucose was incapable of inducing cellular senescence and SASP in in IRF8−/− or NLRC4−/− macrophage exposed to 30 mm glucose for 24 h. A, the activity of SA–β-gal was determined in control, NLRC4−/−, and IRF8−/− macrophage exposed to 5 and 30 mm glucose for 24 h. Scale bar, 100 μm. The rate of SA–β-gal–positive cells is represented in bar histograms. The data are means ± S.D. (n = 3). **, p < 0.01 versus control CRISPR/Cas9 plasmid (30 mm glucose). B, p16 and p21 levels were measured by immunofluorescence staining. Scale bar, 50 μm. The fluorescence intensity is represented in bar histograms. The data are means ± S.D. (n = 3). **, p < 0.01 versus control CRISPR/Cas9 plasmid (30 mm glucose). C, the change of SASP-associated factors is displayed in the heat map. D, Western blotting analysis showing IRF8, p-NLRC4, NLRC4, Caspase-1, cleaved Caspase-1, NF-κB, p16, and p21 specific immunoreactivity. The O.D. values of these proteins' levels relative to β-actin are represented in bar histograms. The data are means ± S.D. (n = 3). *, p < 0.05; **, p < 0.01 versus control CRISPR/Cas9 plasmid (30 mm glucose).
Figure 5.
Figure 5.
Metformin ameliorated the burden of senescent cells in gingival tissue and the SASP in serum of diabetic mice. A, all protocols were performed strictly according to the procedure. The diabetic mice were treated with the metformin (300 mg/kg body weight, everyday) from weeks 9 to 17. B, fasting blood glucose levels were determined at sacrifice (week 17) among control mice (N group), diabetic mice (D group), and diabetic mice treated with metformin (DM group). The data are means ± S.D. (n = 3). *, p < 0.05; **, p < 0.01 versus D group. C, representative of immunohistochemical staining of p16, p21, IRF8, and NLRC4 on the gingival sections from the N, D, and DM groups. Scale bar, 50 μm. The percentage of positive cells was calculated and is represented in bar histograms. The data are means ± S.D. (n = 3). *, p < 0.05; **, p < 0.01 versus the D group. D, the SASP factors in the serum of the N, D, and DM groups were determined at sacrifice (week 17) by a Luminex assay customization tool and shown in the heat map. E, the gingival tissues of the N, D, and DM group mice were stained for immunofluorescence using an F4/80 antibody targeting macrophages (red) and a p16 antibody (green). The nuclei were stained with DAPI (blue). Scale bar, 50 μm. F, IRF8, p-NLRC4, NLRC4, Caspase-1, cleaved Caspase-1, NF-κB, p16, and p21 in the gingival tissue of the N, D, and DM groups were analyzed by Western blotting. The O.D. values of these proteins' levels relative to β-actin are represented in bar histograms. The data are means ± S.D. (n = 3). *, p < 0.05; **, p < 0.01 versus D group.
Figure 6.
Figure 6.
Metformin attenuated high glucose–induced cellular senescence and SASP in macrophage exposed to high glucose (30 mm) for 24 h. A, the activity of SA–β-gal were determined in macrophage treated with low glucose (5 mm) (N), high glucose (30 mm) (HG), and high glucose (30 mm) + metformin (10 mm) (HGM). Scale bar, 100 μm. The rate of SA–β-gal–positive cells was calculated and is represented in bar histograms. The data are means ± S.D. (n = 3). *, p < 0.05; **, p < 0.01 versus HG. B and E, p16, p21, IRF8, and NLRC4 levels were measured by immunofluorescence staining. Scale bar, 50 μm. The fluorescence intensity is represented in bar histograms. The data are means ± S.D. (n = 3). **, p < 0.01 versus HG. C, the change of SASP factors are displayed in the heat map. D, the expression levels of IRF8, p-NLRC4, NLRC4, Caspase-1, cleaved Caspase-1, NF-κB, p16, and p21 in N, HG, and HGM were analyzed by Western blotting. The O.D. values of these proteins' levels relative to β-actin are represented in bar histograms. The data are means ± S.D. (n = 3). *, p < 0.05; **, p < 0.01 versus HG.
Figure 7.
Figure 7.
The potential mechanism of high glucose–induced inflamm-aging in gingival tissue.

Similar articles

Cited by

References

    1. Bell G. I., and Polonsky K. S. (2001) Diabetes mellitus and genetically programmed defects in β-cell function. Nature 414, 788–791 10.1038/414788a - DOI - PubMed
    1. Lalla E., and Papapanou P. N. (2011) Diabetes mellitus and periodontitis: a tale of two common interrelated diseases. Nat. Rev. Endocrinol 7, 738–748 10.1038/nrendo.2011.106 - DOI - PubMed
    1. Demmer R. T., Holtfreter B., Desvarieux M., Jacobs D. R. Jr., Kerner W., Nauck M., Völzke H., and Kocher T. (2012) The influence of type 1 and type 2 diabetes on periodontal disease progression: prospective results from the Study of Health in Pomerania (SHIP). Diabetes Care 35, 2036–2042 10.2337/dc11-2453 - DOI - PMC - PubMed
    1. Prattichizzo F., De Nigris V., La Sala L., Procopio A. D., Olivieri F., and Ceriello A. (2016) “Inflammaging” as a druggable target: a senescence-associated secretory phenotype-centered view of type 2 diabetes. Oxid Med. Cell Longev. 2016, 1810327 - PMC - PubMed
    1. Waaijer M. E., Parish W. E., Strongitharm B. H., van Heemst D., Slagboom P. E., de Craen A. J., Sedivy J. M., Westendorp R. G., Gunn D. A., and Maier A. B. (2012) The number of p16INK4a positive cells in human skin reflects biological age. Aging Cell 11, 722–725 10.1111/j.1474-9726.2012.00837.x - DOI - PMC - PubMed

Publication types