. 2019 Dec 13;294(50):19279-19291.
doi: 10.1074/jbc.RA119.008068. Epub 2019 Nov 1.

Residues and residue pairs of evolutionary importance differentially direct signaling bias of D2 dopamine receptors

Affiliations

Residues and residue pairs of evolutionary importance differentially direct signaling bias of D2 dopamine receptors

María E Terrón-Díaz et al. J Biol Chem. .

Abstract

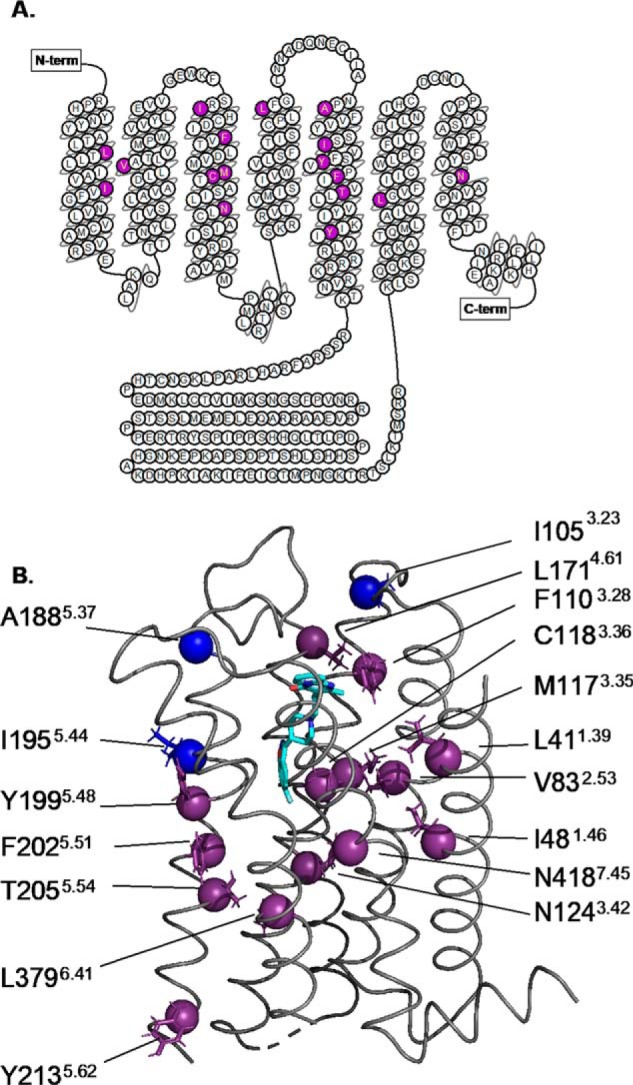
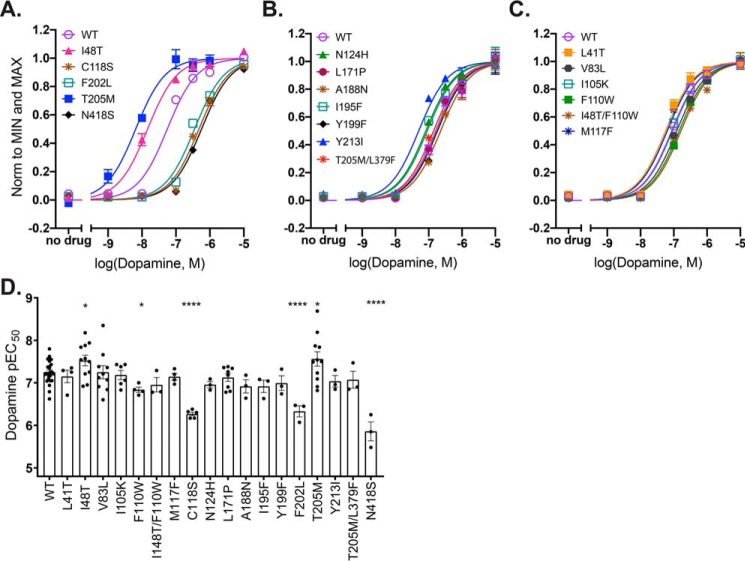
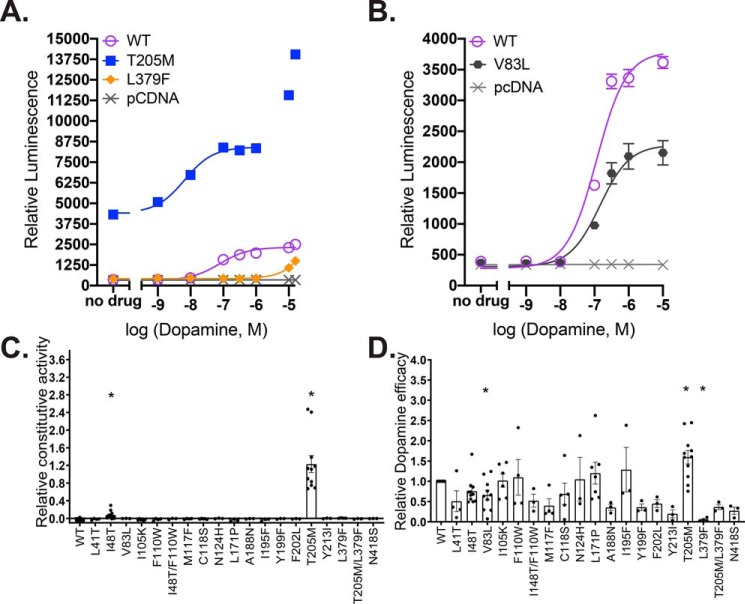
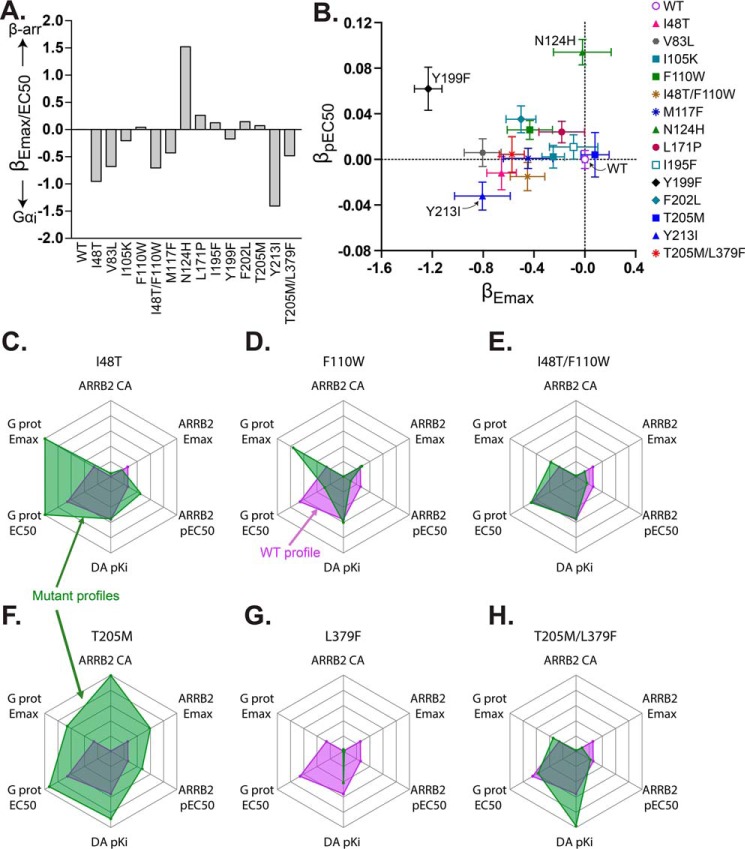
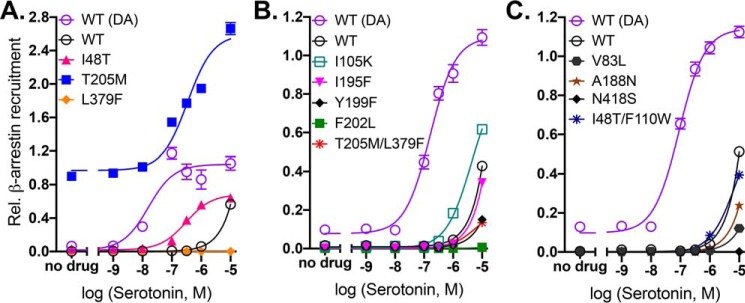
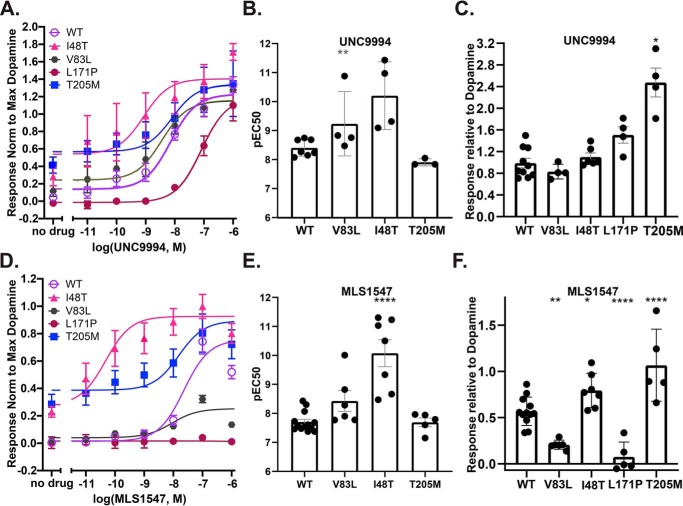
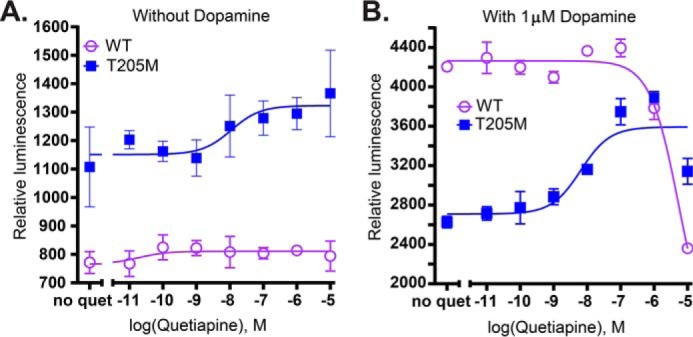
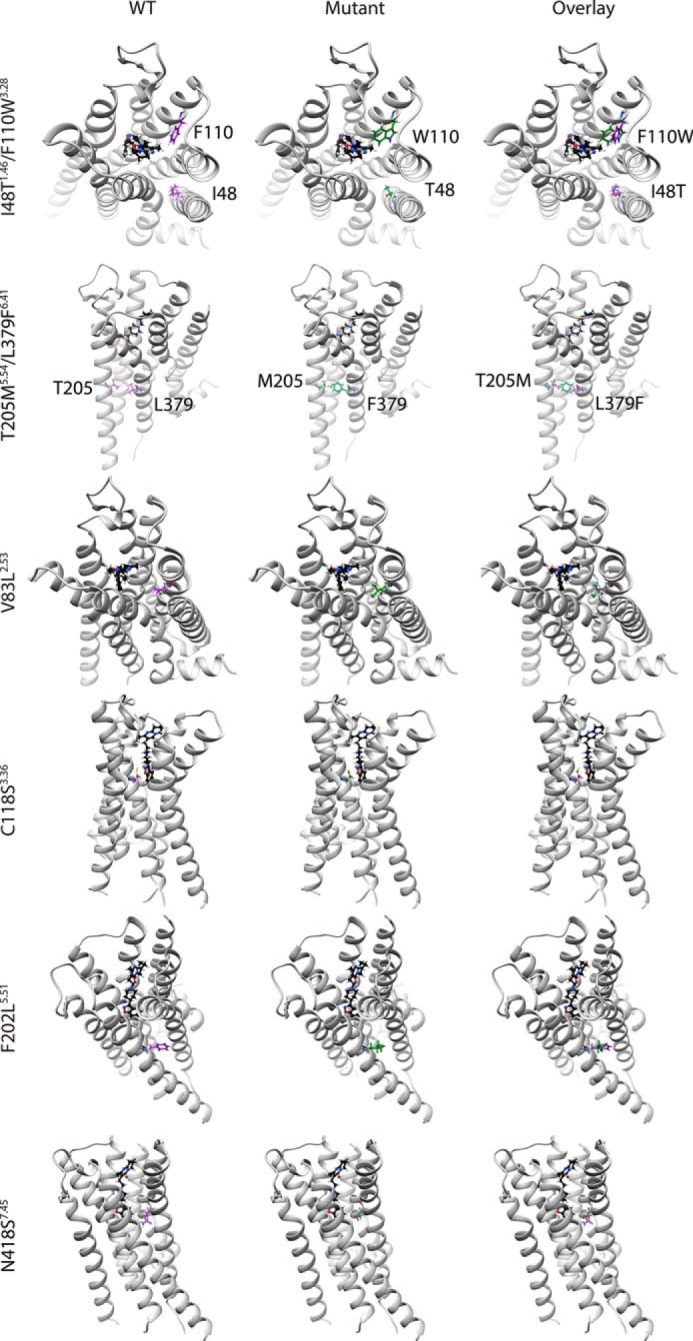
The D2 dopamine receptor and the serotonin 5-hydroxytryptamine 2A receptor (5-HT2A) are closely-related G-protein-coupled receptors (GPCRs) from the class A bioamine subfamily. Despite structural similarity, they respond to distinct ligands through distinct downstream pathways, whose dysregulation is linked to depression, bipolar disorder, addiction, and psychosis. They are important drug targets, and it is important to understand how their bias toward G-protein versus β-arrestin signaling pathways is regulated. Previously, evolution-based computational approaches, difference Evolutionary Trace and Evolutionary Trace-Mutual information (ET-Mip), revealed residues and residue pairs that, when switched in the D2 receptor to the corresponding residues from 5-HT2A, altered ligand potency and G-protein activation efficiency. We have tested these residue swaps for their ability to trigger recruitment of β-arrestin2 in response to dopamine or serotonin. The results reveal that the selected residues modulate agonist potency, maximal efficacy, and constitutive activity of β-arrestin2 recruitment. Whereas dopamine potency for most variants was similar to that for WT and lower than for G-protein activation, potency in β-arrestin2 recruitment for N124H3.42 was more than 5-fold higher. T205M5.54 displayed high constitutive activity, enhanced dopamine potency, and enhanced efficacy in β-arrestin2 recruitment relative to WT, and L379F6.41 was virtually inactive. These striking differences from WT activity were largely reversed by a compensating mutation (T205M5.54/L379F6.41) at residues previously identified by ET-Mip as functionally coupled. The observation that the signs and relative magnitudes of the effects of mutations in several cases are at odds with their effects on G-protein activation suggests that they also modulate signaling bias.

Keywords: G protein; G-protein–coupled receptor (GPCR); allosteric regulation; arrestin; cell signaling; dopamine; dopamine receptor.


Conflict of interest statement

The authors declare that they have no conflicts of interest with the contents of this article

Figures

Figure 1.
Figure 1.
Summary of mutations used to test allosteric regulation of β-arrestin2 recruitment to D2R. A, serpentine plot of D2R from GPCRdb with the residues of interest chosen based on difference-ET highlighted in purple. B, ET residues are shown in the structure of D2R as spheres (Cα atoms) and side chains, with hydrogens (PDB 6CM4, Wang et al. (43)). The spheres of the low ranked residues are in blue and the high ranked residues are in purple. The compound in cyan is the inverse agonist risperidone, located in the binding pocket. Superscripts represent the Ballesteros-Weinstein index for each residue.
Figure 2.
Figure 2.
Dopamine potency for β-arrestin recruitment. A–C, example TANGO assay dopamine dose-response curves shown normalized to maximum and minimum values of the best-fit curves. Points and error bars represent means ± S.E. of three technical replicates. Error bars not shown are smaller than the symbols. D, dopamine potency data from multiple experiments (n = 3–11 for mutants and 25 for WT). Points represent pEC50 values obtained from sigmoidal curve fits of raw data from the TANGO dose-response for each day tested. For T205M5.54, which exhibited a biphasic dose-response, data were truncated at 10−6 m for fitting to the sigmoidal curve. L379F6.41 is not included because the TANGO response is similar to that of the negative control. The bars represent means ± S.E. of the points shown. All mutants were compared with WT using an unpaired two-tailed t test; ****, p < 0.0001; *, p < 0.05. Detailed information about the sample sizes and statistics is provided in Table 1.
Figure 3.
Figure 3.
Relative efficacy of β-arrestin recruitment by dopamine. A and B, example of dopamine dose-response curves for assays carried out in parallel on the same day. Points are means ± S.E.M. of single-day experiments (n = 3 for mutants and 9 for WT). Error bars that are not shown are smaller than the symbols. Raw intensity values are shown, uncorrected for surface expression levels relative to WT, which were: logSErel (± S.D.) = −0.1 ± 0.18 (T205M), 0.71 ± 0.33 (L379F), and 0.56 ± 0.47 (V83L). C, constitutive activity was determined from the bottom plateau of dose-response curve fits, except for L379F6.41 where the response with no drug added was used, relative to WT, and normalized by mean surface expression. Points show constitutive activity values of biological replicates (i.e. single-day experiments; n = 3–6 for mutants and 38 for WT), and bars represent means ± S.E. D, dopamine efficacy. Points represent the maximal response relative to WT on individual days, based on the maximal values of the best-fit curves for the dose-response data, normalized for mean surface expression relative to WT. For the inactive mutant, L379F6.41, the response to 10−5 m dopamine is plotted. The bars represent the mean values ± S.E. over multiple biological replicates, handled and plotted as in C. In both C and D, for those values that appeared different at the p < 0.05 level by two-tailed unpaired t test, values were tested at the positive or negative extreme of the 95% confidence level for mean log(relative surface expression) and scored as significantly different (*) only if the differences were retained when re-normalized for those surface expression values. Detailed information about the sample sizes and statistics is provided in Table 1.
Figure 4.
Figure 4.
Bias parameters and rescue of WT behavior by second-site mutations. A and B, bias factors computed from relative activities of D2R mutants in response to dopamine for β-arrestin (β-arr) recruitment (TANGO assay, this study) and Gαi activation (membrane potential assay, Sung et al. (23)). A, equiactive comparison (40) calculated from relative Emax/EC50 values for the two assays. B, single measure bias factors calculated separately for Emax (x axis) and pEC50 (y axis). Error bars were derived from the S.E. of the two measurements using error propagation. Positive and negative values indicate bias toward β-arrestin recruitment or Gαi activation, respectively. Details of the bias factor calculations are provided under “Experimental procedures.” C–H, radar plots (generated using R) for I48T1.46 (C), F110W2.38 (D), I48T1.46/F110W2.38 (E), T205M5.54 (F), L379F6.41 (G), and T205M5.54/L379F6.41 (H) represent multiassay data after dopamine stimulation. The intersections of the lines outlining the inner magenta-shaded region with the radial axes denote WT activity, and those outlining the green-shaded regions depict activities of mutants. Data shown are as follows: Gαi pEC50; Gαi Erel; β-arrestin2 (ARRB2) pEC50; ARRB2 constitutive activity (CA); ARRB2 Erel, and dopamine (DA) binding pKi. The G-protein (G prot) and pKi data were obtained from Sung et al. (23) and Rodriguez et al. (22). All the radar plots share the same axes. The same maximum and minimum values were used for both ARRB2 and G-protein pEC50 and Erel to allow for comparison of values. The pEC50 axis origin is 6 and the outermost line corresponds to 7.8. The Erel axis origin is 0 and the outermost line is 3.9. The constitutive activity axes range from −0.03 to 1.44, and the pKi axes range from 3 to 5.7. All values are listed in Table 2.
Figure 5.
Figure 5.
Serotonin stimulation of β-arrestin2 recruitment. A and B, example of serotonin dose-response curves. Points with error bars are means ± S.E. of technical replicates (n = 3 for mutants and 9 for WT), compared with WT treated with dopamine (DA) the same day and normalized to expression levels relative to WT from three or more independent surface-expression assays. Error bars that are not shown are smaller than the symbols. WT and mutant constructs were assayed, and the results were analyzed as in Figs. 2 and 3.
Figure 6.
Figure 6.
Effects of biased ligands. A–C, responses in TANGO assay to β-arrestin–biased ligand UNC9994. D–F, responses in TANGO assay to G-protein–biased ligand MLS1547. A and D show example dose-response curves plotted as a ratio to the best-fit maximum response elicited by dopamine in parallel assays on the same day. B and E, pEC50 values. Individual points are average values for sets of three or more assays on individual days, and the bars show average over multiple days ±S.E. C and F, maximum responses normalized by dopamine responses on the same days, with both determined as best-fit values for sets of three or more titrations on individual days. Points show results for individual days, and bars show averages over multiple days ±S.E. All mutants were compared with WT using an unpaired two-tailed t test; ****, p < 0.0001; **, p < 0.001; *, p < 0.05. Responses relative to WT can be derived by comparisons to data in Fig. 3 and Table 1.
Figure 7.
Figure 7.
Effects of antagonist/weak partial agonist quetiapine on WT and T205M D2R. A and B, antagonist (quetiapine) TANGO dose-response curves carried out in parallel on the same day. A, no dopamine was added. B, quetiapine was added along with 10 μm dopamine. Points and error bars represent means ± S.E. of three technical replicates. Error bars that are not shown are smaller than the symbols. Raw intensity values are shown, uncorrected for surface expression levels relative to WT, which were: logSErel (± S.D.) = 0.18 ± 0.21 for T205M.
Figure 8.
Figure 8.
Structural comparison between WT and mutagenized residues. D2R (helices in light gray) bound to risperidone (ball and stick in black) (PDB 6CM4 (43)). The WT residues are depicted in purple, and the mutagenized residues are depicted in green. The residues depicted both before and after mutagenesis using Chimera are I48T1.46/F110W2.38, T205M5.54/L379F6.41, V83L2.53, C118S3.36, F202L5.51, and N418S7.45.

Similar articles

References

    1. Emamian E. S. (2012) AKT/GSK3 signaling pathway and schizophrenia. Front. Mol. Neurosci. 5, 33 10.3389/fnmol.2012.00033 - DOI - PMC - PubMed
    1. Schmid C. L., Streicher J. M., Meltzer H. Y., and Bohn L. M. (2014) Clozapine acts as an agonist at serotonin 2A receptors to counter MK-801–induced behaviors through a β-arrestin2–independent activation of Akt. Neuropsychopharmacology 39, 1902–1913 10.1038/npp.2014.38 - DOI - PMC - PubMed
    1. Deslauriers J., Desmarais C., Sarret P., and Grignon S. (2013) α-Lipoic acid interaction with dopamine D2 receptor-dependent activation of the Akt/GSK-3β signaling pathway induced by antipsychotics: potential relevance for the treatment of schizophrenia. J. Mol. Neurosci. 50, 134–145 10.1007/s12031-012-9884-4 - DOI - PubMed
    1. Beaulieu J. M., Sotnikova T. D., Marion S., Lefkowitz R. J., Gainetdinov R. R., and Caron M. G. (2005) An Akt/β-arrestin2/PP2A signaling complex mediates dopaminergic neurotransmission and behavior. Cell 122, 261–273 10.1016/j.cell.2005.05.012 - DOI - PubMed
    1. Beaulieu J. M., Del'guidice T., Sotnikova T. D., Lemasson M., and Gainetdinov R. R. (2011) Beyond cAMP: the regulation of Akt and GSK3 by dopamine receptors. Front. Mol. Neurosci. 4, 38 10.3389/fnmol.2011.00038 - DOI - PMC - PubMed

Publication types

Associated data