. 2019 Nov 1;10(1):4986.
doi: 10.1038/s41467-019-12983-z.

Lineage tracing of acute myeloid leukemia reveals the impact of hypomethylating agents on chemoresistance selection

Affiliations

Lineage tracing of acute myeloid leukemia reveals the impact of hypomethylating agents on chemoresistance selection

Francisco Caiado et al. Nat Commun. .

Erratum in

Abstract

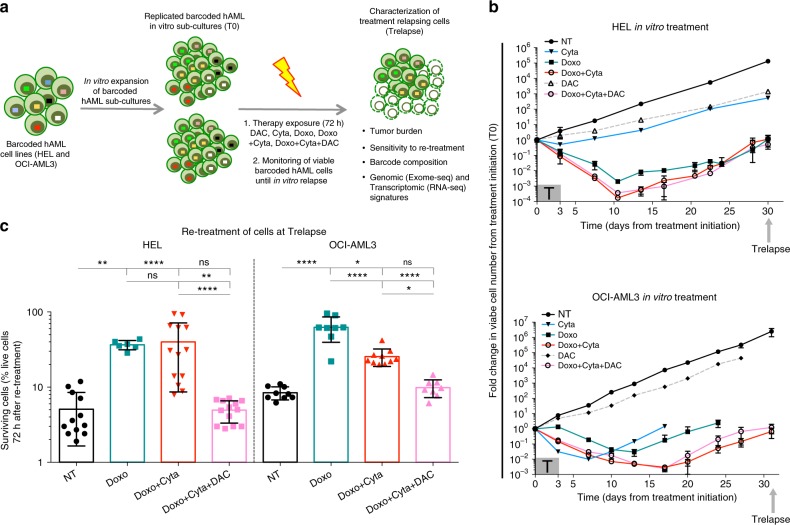
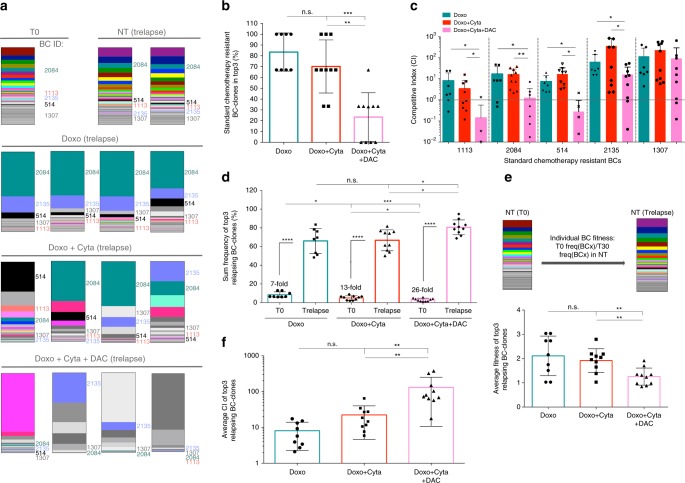
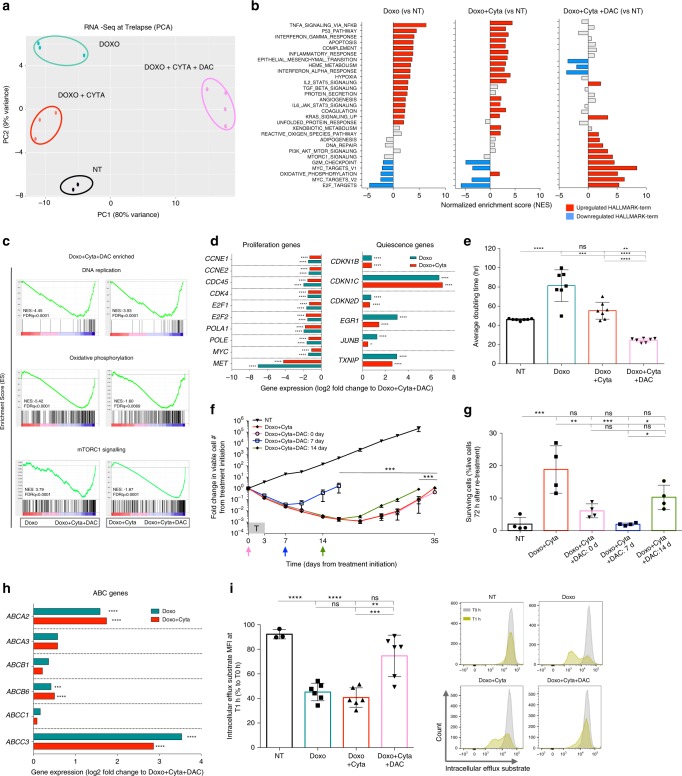
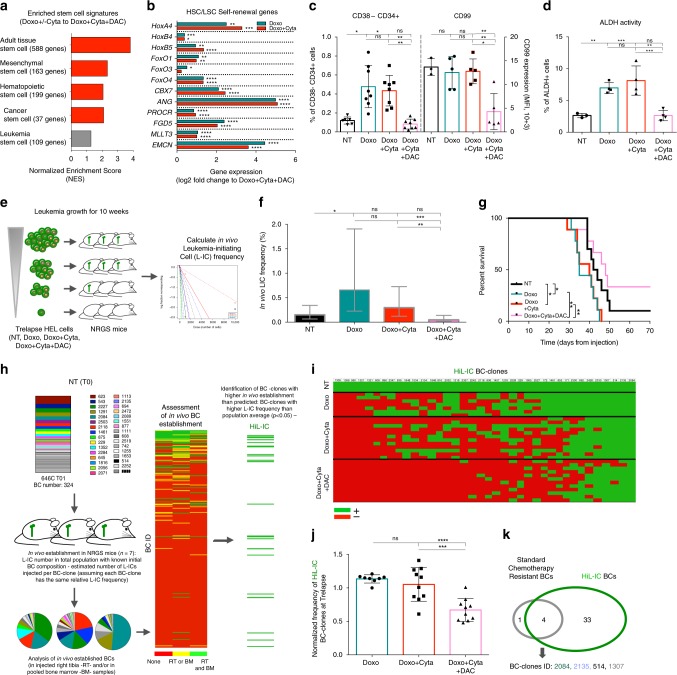
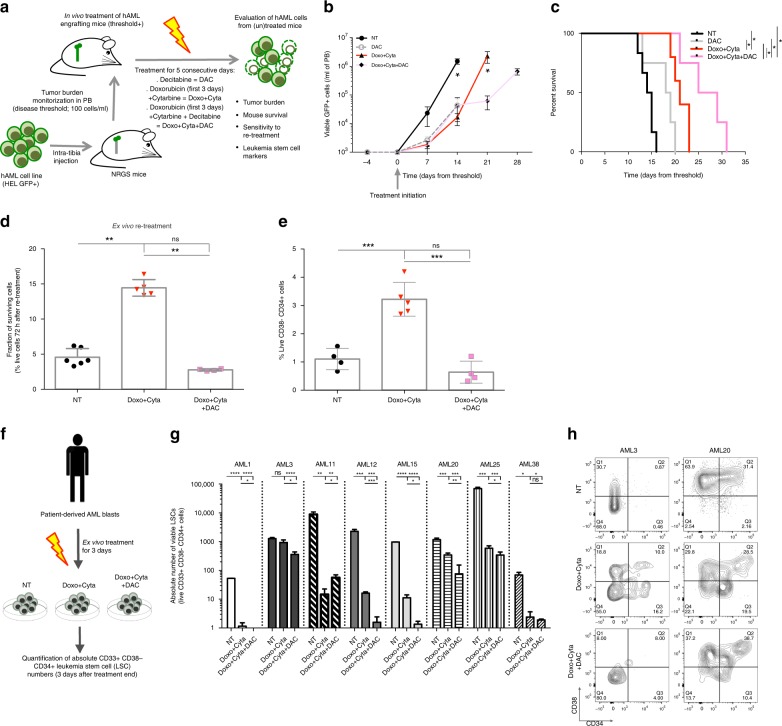
Chemotherapy-resistant cancer recurrence is a major cause of mortality. In acute myeloid leukemia (AML), chemorefractory relapses result from the complex interplay between altered genetic, epigenetic and transcriptional states in leukemic cells. Here, we develop an experimental model system using in vitro lineage tracing coupled with exome, transcriptome and in vivo functional readouts to assess the AML population dynamics and associated molecular determinants underpinning chemoresistance development. We find that combining standard chemotherapeutic regimens with low doses of DNA methyltransferase inhibitors (DNMTi, hypomethylating drugs) prevents chemoresistant relapses. Mechanistically, DNMTi suppresses the outgrowth of a pre-determined set of chemoresistant AML clones with stemness properties, instead favoring the expansion of rarer and unfit chemosensitive clones. Importantly, we confirm the capacity of DNMTi combination to suppress stemness-dependent chemoresistance development in xenotransplantation models and primary AML patient samples. Together, these results support the potential of DNMTi combination treatment to circumvent the development of chemorefractory AML relapses.


Conflict of interest statement

The authors declare no competing interests.

Figures

Fig. 1
Fig. 1
Chemotherapy + Decitabine combination prevents chemoresistance in hAML cells. a Schematic diagram of the experimental system used. T0 indicates the time of treatment initiation and Trelapse is defined as the post-therapy time point when re-grown hAML reached equivalent numbers as T0. NT–no treatment; DAC–decitabine (0.1 μM); Doxo–doxorubicin (1.8 μM); Cyta–cytarabine (6μM). b Total number of viable HEL and OCI-AML3 barcoded cells between T0 and Trelapse, defined as a fold variation of cell number at each measured time point relatively to T0 (n = 3 for NT and DAC, n = 5 for Cyta and Doxo, n = 8 for Doxo + Cyta and Doxo + Cyta + DAC, independent replicates). T box indicates the period of therapy exposure. c Frequency of viable Trelapse HEL and OCI-AML3 barcoded cells (NT: n = 12/9, Doxo: n = 6/8, Doxo + Cyta: 13/10 and Doxo + Cyta + DAC: 13/8, independent replicates in HEL / OCI-AML3 respectively) after re-exposure to Doxo + Cyta for 72 h. Concerning panels b and c displayed graphs show mean ± s.d.; P values were determined by one-way ANOVA test. ns–not significant, *P < 0.05; **P < 0.01; ***P < 0.001; ****P < 0.0001. Source data are provided as a Source Data file
Fig. 2
Fig. 2
Pre-determined set of BC-clones associates with chemoresistant relapses. (Data relative to HEL cell line) a Normalized (to NT) frequency of barcodes detected at Trelapse in Cyta (n = 3), Doxo (n = 8), Doxo + Cyta (n = 10) and Doxo + Cyta + DAC (n = 10) groups. b Shannon-Weaver diversity index (H) of indicated Trelapse groups. H = −Sum(xiLNxi), where xi is the frequency of each BC-clone in the population. H reflects the BC number and how evenly distributed these are in the population (higher H results from higher BC number and more even distribution). c Pearson correlation coefficient between BC-clonal architectures of each treatment and NT groups (Cyta: n = 9, Doxo: n = 19, Doxo + Cyta ± DAC = 36). d Pearson correlation coefficient between BC-clonal architectures of replicates within each treatment group at Trelapse.(Cyta: n = 3, Doxo: n = 10, Doxo + Cyta ± DAC = 14) e Strategy used to define Doxo and Doxo + Cyta resistant BC-clones. On the left are depicted the fold variations of each BC-clone between T0 and Trelapse in Doxo and Doxo + Cyta groups compared to NT, chemoresistant BC-clones were defined has the ones showing equal or increased fold variation relative to NT, determined by preforming multiple t-testing (per individual BC, P < 0.05). This was performed in three independent experiments (n = 2, n = 5, n = 3). On the right, venn diagrams depicting the overlap of chemoresistant BC-clones, shared between all the replicates of three independent experiments for Doxo and Doxo + Cyta groups; as well as the overlap between these respective cores. The list of the chemoresistant BC-clones is indicated with respective BC-identification (id). f Average frequency of each indicated BC-clone (and their summed frequency) in Doxo (n = 8), Doxo + Cyta (n = 10) at Trelapse and T0 (n = 5). Boxplots c, d and f: center line is median, lower box bound is the 25% percentile, upper box bound is the 75% percentile, whiskers are minimum and maximum values. Cross is the mean (f). g Same as e but applied to Doxo + Cyta + DAC group. Graphs of mean ± s.d., P values were determined by one-way ANOVA test. ns–not significant, *P < 0.05; **P < 0.01; ***P < 0.001; ****P < 0.0001. Source data are provided as a Source Data file
Fig. 3
Fig. 3
Decitabine combination suppresses the re-growth of chemoresistant BC-clones. (Data relative to HEL cell line) a BC-clonal composition of representative NT, Doxo, Doxo + Cyta and Doxo + Cyta + DAC samples at Trelapse. Each BC-clone has a fixed color-code across all samples. Chemoresistant BC-clones are indicated. b Average frequency at which chemotherapy-resistant BC-clones constitute the top 3 most dominant clones at Trelapse. In total, 3 out of 3 represents 100% frequency, 2 out of 3: 67%, 1 out of 3: 33% and 0 out of 3: 0% (Doxo: n = 8, Do33xo + Cyta ± DAC: n = 10). c. Competitive index (CI) of each chemoresistant BC-clone in Doxo (n = 8), Doxo + Cyta (n = 10) and Doxo + Cyta + DAC (n = 10) groups. A CI of 1 (dotted line) represents a similar barcode fold variation form T0 to Trelapse in the indicated condition relative to NT. d Summed frequency of top 3 most dominant BC-clones in each treatment group at Trelapse and their matched frequency at T0. The fold variation of the summed frequency of these BC-clones between T0 and Trelapse is indicated. e. Schematic representation of experimental approach to calculate BC-clone specific fitness. Lower graph—Average fitness of the top 3 most dominant BC-clones from indicated groups (Doxo: n = 9, Doxo + Cyta ± DAC: n = 10). f Competitive index (CI) of the top 3 most dominant BC-clones in indicated groups at Trelapse (Doxo: n = 9, Doxo + Cyta ± DAC: n = 10). Graphs of mean ± s.d., P values were determined by t-test (panel c.)one-way ANOVA test. ns – not significant, *P < 0.05; **P < 0.01; ***P < 0.001; ****P < 0.0001. Source data are provided as a Source Data file
Fig. 4
Fig. 4
Dectabine shapes the transcriptome and proliferative capacity of relapsing hAML. (Data relative to HEL cell line) a Principal component analysis plot of differential gene expression at Trelapse between experimental groups. b Gene set enrichment analysis (GSEA) of HALLMARK gene set terms significantly (FDRq < 0.05) upregulated (red) and downregulated (blue) in each treatment group as compared to NT, at Trelapse. Gray bars represent no statistically significant change. c GSEA of differentially expressed pathways in Doxo + Cyta + DAC group compared to Doxo ± Cyta groups at Trelapse. For GSEA analysis Kolmogorov-Smirnov statistical test was preformed. d Differential expression of indicated proliferation and quiescence genes between indicated groups at Trelapse. e Doubling time (hours) of indicated groups at Trelapse (n = 7). f Fold change in total number of viable AML cells between day 0 and 35 after chemotherapy treatment. Arrows indicate time point of DAC (0.1 μM) addition: 0 (pink), 7 (blue), and 14 (green) (n = 3). Cells were in all cases exposed to DAC for 72 h. g Frequency of viable cells after in vitro (re-)exposure to Doxo + Cyta for 72 h in NT, Doxo + Cyta and Doxo + Cyta + DAC (0, 7 or 14 days) relapsing cells (n = 4). h Differential expression of indicated ATP-binding cassette transporters (ABC) genes between indicated groups at Trelapse. i Intracellular efflux substrate MFI of NT, Doxo ± Cyta and Doxo + Cyta + DAC cells at Trelapse. MFI was determined after 1 h (T1h) at 37 °C and depicted as the ratio of the respective MFIs measured immediately after intracellular efflux substrate staining at T0h (n = 6 in all groups except NT: n = 3). Representative histograms. Graphs of mean ± s.d. P values were determined by one-way ANOVA test. ns—not significant, *P < 0.05; **P < 0.01; ***P < 0.001; ****P < 0.0001. Gene expression graphs (d, h) represent mean log2(fold) change and indicated adjusted P value calculated by Wald testing. Source data are provided as a Source Data file
Fig. 5
Fig. 5
Decitabine combination reduces stemness properties of relapsing hAML cells. (Data relative to HEL cell line) a GSEA of different stem-cell signatures significantly enriched (red, FDRq < 0.05 calculated by Kolmogorov-Smirnov statistical test) in Doxo ± Cyta Trelapses relative to Doxo + Cyta + DAC group (indicated NES are relative to the highest enrichment observed in Doxo ± Cyta). b Differential expression of indicated genes implicated in hematopoietic and leukemic stem cells (HSCs, LSCs) self-renewal between indicated groups at Trelapse. c Frequency of CD38-CD34 + cells (left axis, NT: n = 6, Doxo ± Cyta and Doxo + Cyta + DAC: n = 8) and CD99 mean florescence intensity (MFI) (right axis, NT: n = 3, Doxo ± Cyta and Doxo + Cyta + DAC: n = 5) on indicated groups at Trelapse. d Fraction (%) of cells with active ALDH enzymatic activity in indicated grups (NT: n = 3, Doxo ± Cyta and Doxo + Cyta + DAC: n = 4). e Schematic diagram of limiting-dilution assay performed with Trelapse populations from NT, Doxo ± Cyta and Doxo + Cyta + DAC cells on NRGS mice, via intra-bone marrow injection of 10000, 1000, 100 and 10 cells. f Estimated leukemia-initiating cell (LIC) frequency in Trelapse populations from indicated groups (the y-axis denotes the confidence intervals—lower, estimate and upper for L-IC frequency). g Survival curves of mice transplanted with 1000 cells from Trelapse NT (n = 10), Doxo ± Cyta (n = 9) and Doxo + Cyta + DAC (n = 9) samples. h Schematic diagram of the strategy used to identify BC-clones with a higher L-IC frequency than the population average (HiL-IC). i Heat-map scoring the presence (green) or absence (red) of HiLIC BC-clones (columns, total of 37) present in Trelapse populations from replicates of indicated groups (lines). j Normalized frequency of HiL-IC BC-clones present at Trelapse in indicated groups (Doxo: n = 8, Doxo + Cyta ± DAC: n = 10). k Venn diagram depicting the overlap across BC-clones with HiL-IC and chemoresistant properties. Graphs of mean ± s.d., P values were determined by one-way ANOVA test. Survival curve analysis was performed by Log-rank (Mantle-Cox) testing. ns—not significant, *P < 0.05; **P < 0.01; ***P < 0.001; ****P < 0.0001. Gene expression graph (b) represents mean log2(fold) change and indicated adjusted P value calculated by Wald testing. Source data are provided as a Source Data file
Fig. 6
Fig. 6
Decitabine combination depletes LSCs from xenografts and AML patient samples. a Schematic diagram of the therapeutic setting used to treat NRGS mice bearing human AML (GFP + HEL) cells. Chemotherapy regimen (Doxo + Cyta): intraperitoneal (i.p.) injection of cytarabine (100 mg/kg per day over 5 days) and doxorubicin (3 mg/kg per day over the first 3days). Decitabine combination was initiated 2 days after Doxo + Cyta, via i.p. injection of 0,5 mg/kg DAC for 5 consecutive days. b The total number of viable hAML HEL (GFP + , 7AAD-) cells in peripheral blood (PB) and mouse survival (c) in untreated (NT, n = 6), DAC alone (n = 4), Doxo + Cyta (n = 5) and Doxo + Cyta + DAC (n = 4) groups. d Frequency of viable BM-sorted hAML cells, sorted from the BM of mice from the three groups described in b, c, after ex vivo exposure to Doxo + Cyta for 72 h. e Frequency of CD38-CD34 + cells (left axis, n = 4–8) on BM-sorted hAML cells from indicated groups. Schematic diagram depicting ex vivo treatment of AML patient samples Doxo + Cyta and Doxo + Cyta + DAC and the subsequent quantification of immunophenotypically defined LSCs. g Absolute number of LSCs (live CD33 + CD38− CD34 + cells) after ex vivo exposure to Doxo + Cyta and Doxo + Cyta + DAC (n = 3 per sample). h Representative flow cytometry contour plots of CD38/CD34 staining gated on CD33 + VioletZombie- population. Graphs of mean ± s.d., P values were determined by one-way ANOVA test. Survival curve analysis was performed by Log-rank (Mantle-Cox) testing. ns—not significant, *P < 0.05; **P < 0.01; ***P < 0.001; ****P < 0.0001. Source data are provided as a Source Data file

References

    1. Holohan C, Van Schaeybroeck S, Longley DB, Johnston PG. Cancer drug resistance: an evolving paradigm. Nat. Rev. Cancer. 2013;13:714–726. - PubMed
    1. Caiado F, Silva-Santos B, Norell H. Intra-tumour heterogeneity - going beyond genetics. FEBS J. 2016;283:2245–2258. - PubMed
    1. Aparicio S, Caldas C. The implications of clonal genome evolution for cancer medicine. N. Engl. J. Med. 2013;368:842–851. - PubMed
    1. Almendro V, Marusyk A, Polyak K. Cellular heterogeneity and molecular evolution in cancer. Annu. Rev. Pathol. Mech. Dis. 2013;8:277–302. - PubMed
    1. Batlle E, Clevers H. Cancer stem cells revisited. Nat. Med. 2017;23:1124–1134. - PubMed

Publication types

MeSH terms