. 2019 Nov 1;10(1):5015.
doi: 10.1038/s41467-019-12880-5.

Neratinib protects pancreatic beta cells in diabetes

Affiliations

Neratinib protects pancreatic beta cells in diabetes

Amin Ardestani et al. Nat Commun. .

Abstract

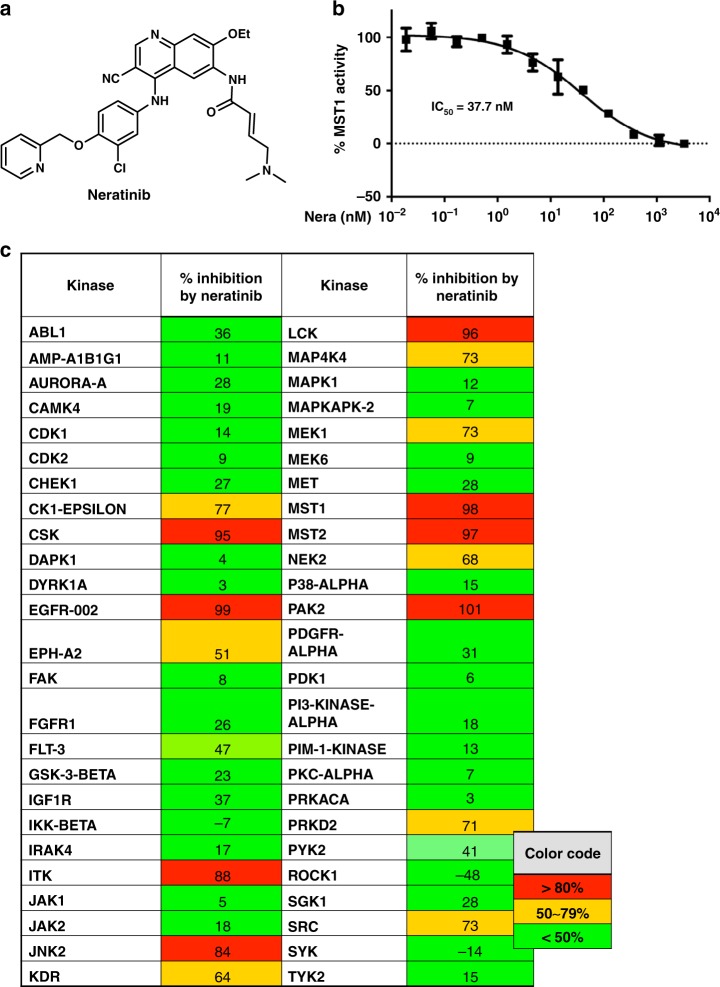
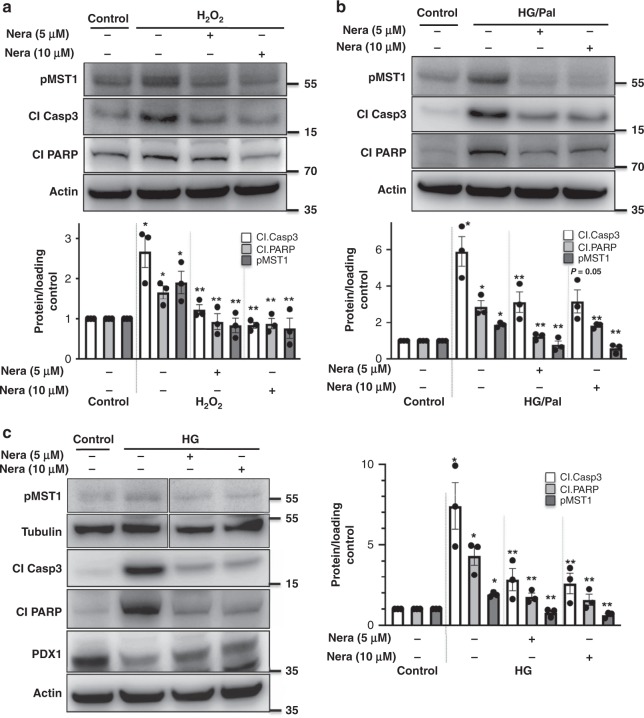
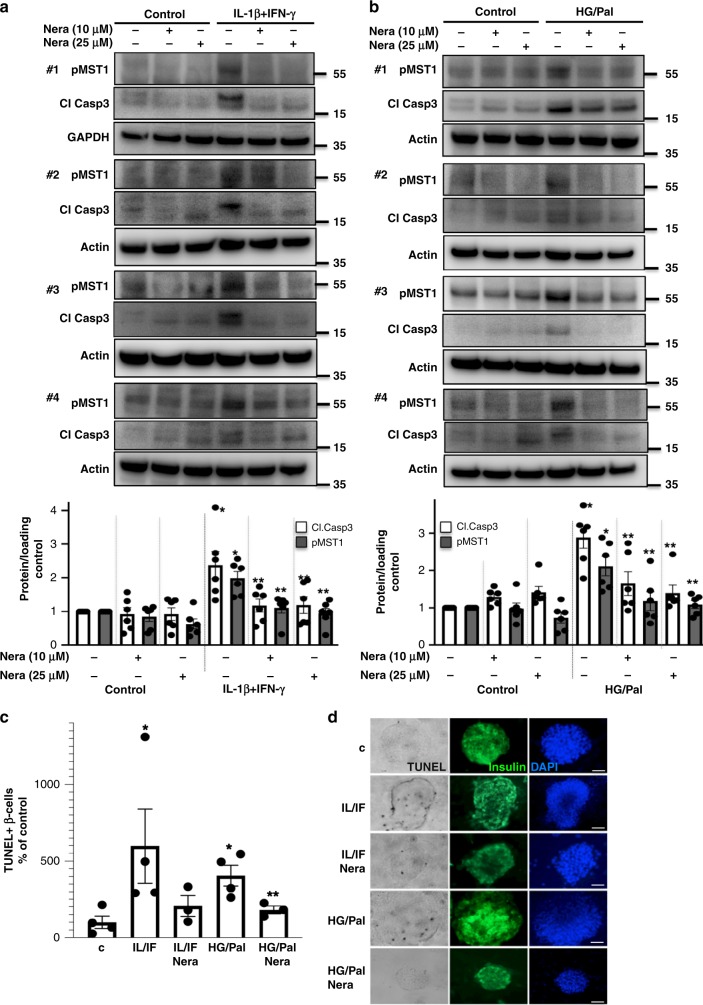
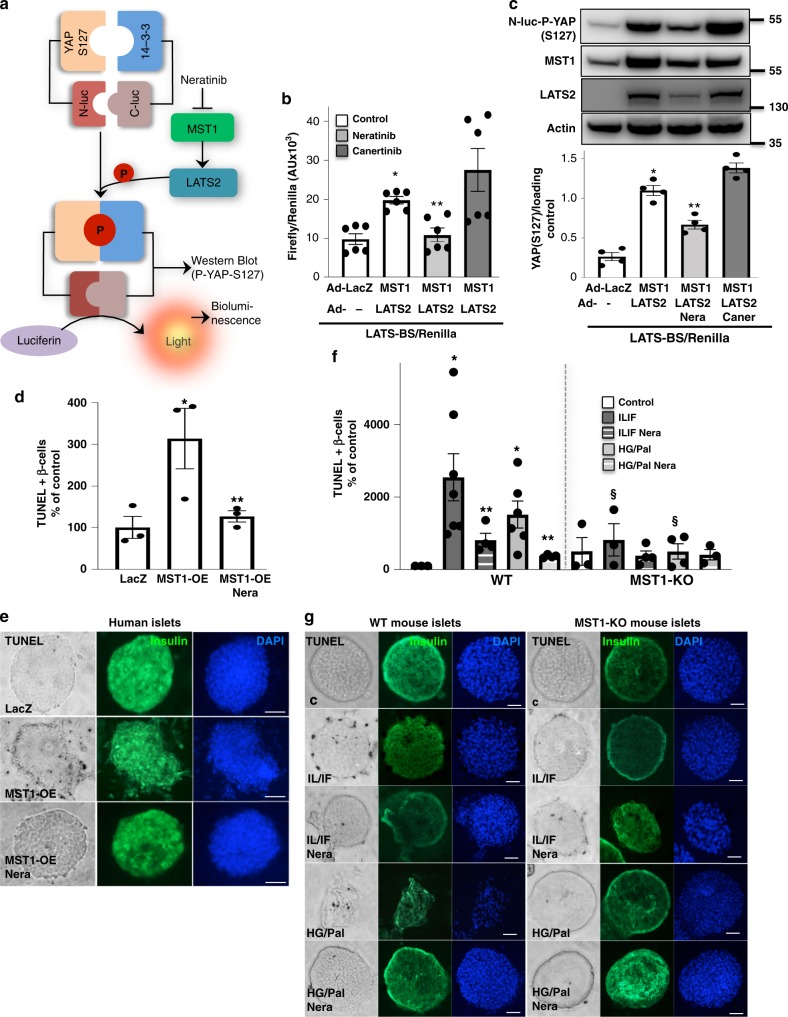
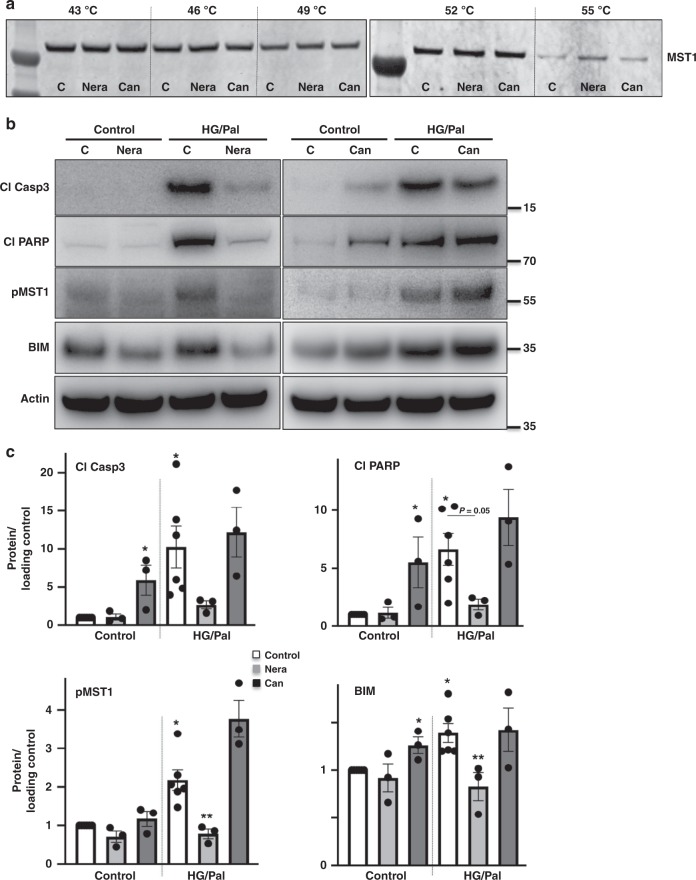
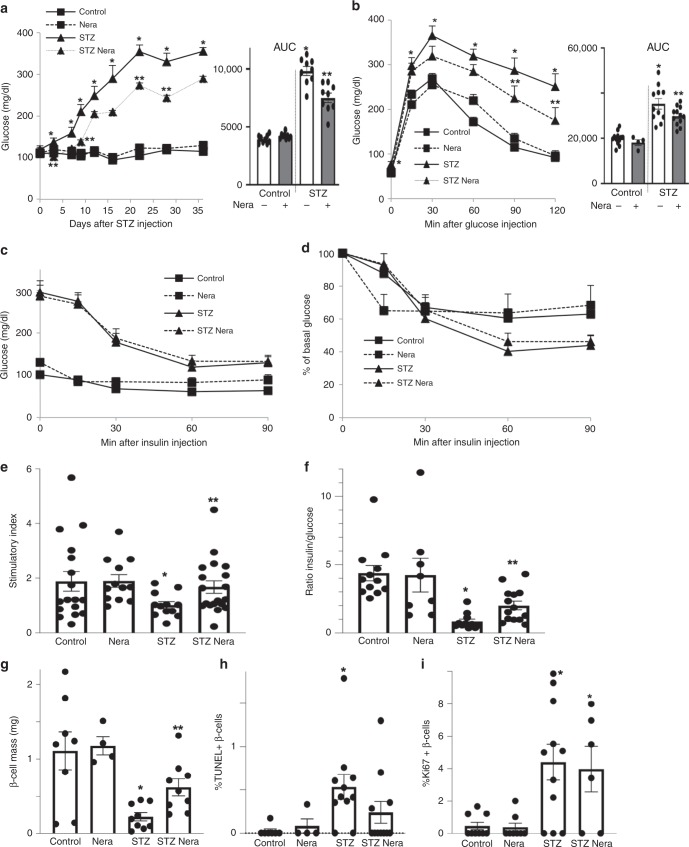
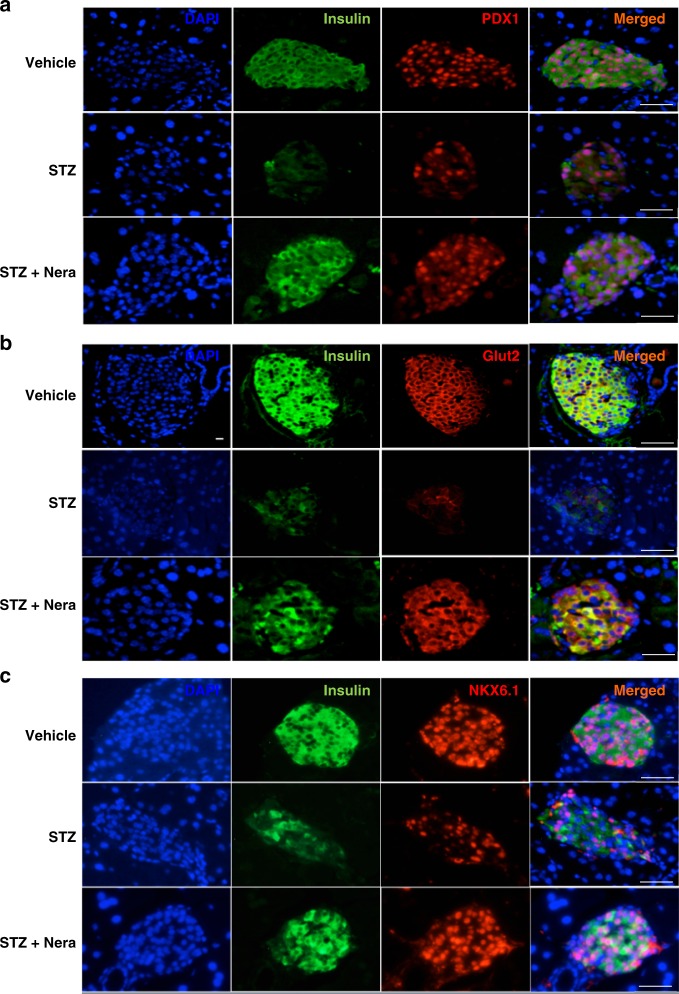
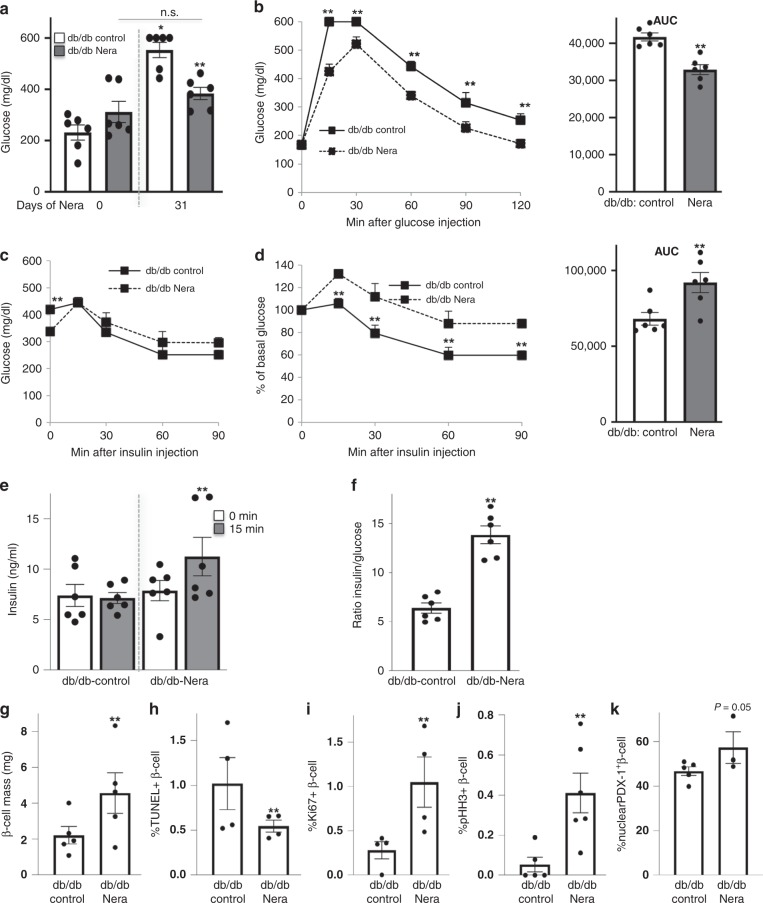
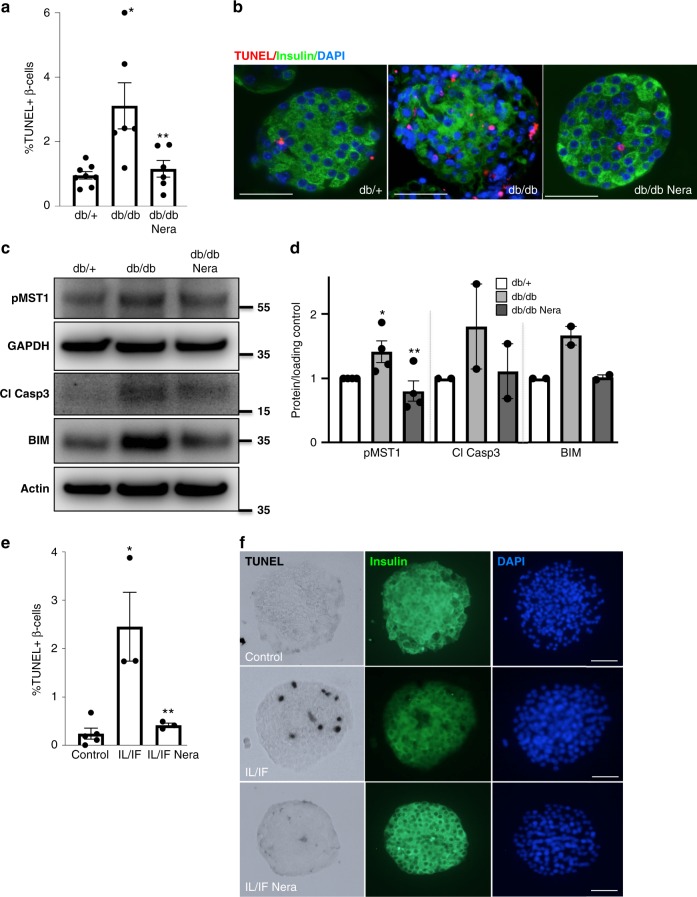
The loss of functional insulin-producing β-cells is a hallmark of diabetes. Mammalian sterile 20-like kinase 1 (MST1) is a key regulator of pancreatic β-cell death and dysfunction; its deficiency restores functional β-cells and normoglycemia. The identification of MST1 inhibitors represents a promising approach for a β-cell-protective diabetes therapy. Here, we identify neratinib, an FDA-approved drug targeting HER2/EGFR dual kinases, as a potent MST1 inhibitor, which improves β-cell survival under multiple diabetogenic conditions in human islets and INS-1E cells. In a pre-clinical study, neratinib attenuates hyperglycemia and improves β-cell function, survival and β-cell mass in type 1 (streptozotocin) and type 2 (obese Leprdb/db) diabetic mouse models. In summary, neratinib is a previously unrecognized inhibitor of MST1 and represents a potential β-cell-protective drug with proof-of-concept in vitro in human islets and in vivo in rodent models of both type 1 and type 2 diabetes.


Conflict of interest statement

The authors declare no competing interests.

Figures

Fig. 1
Fig. 1
Neratinib, a kinase inhibitor with MST1 efficacy. a Chemical structure of neratinb. b Biochemical dose response confirmation of MST1 inhibition. Data show means ± SEM from three independent experiments (n = 3). c Kinase profiling showing % kinase inhibition at 10 µM neratinib with a panel of 50 kinases, means of duplicates are shown. Source data for (b) are provided as a Source Data file
Fig. 2
Fig. 2
Neratinib blocks MST1 activation and apoptosis in INS-1E β-cells. INS-1E cells were exposed to diabetogenic conditions (a H2O2, b, c 22.2 mM glucose or the mixture of 22.2 mM glucose and 0.5 mM palmitate (HG/Palm)) ± neratinib for 72 h. Phospho-MST1 (pMST1; pThr183), caspase-3 and PARP cleavage, PDX1, tubulin, and actin were analyzed by western blotting. Representative Western blots and pooled quantitative densitometry analysis are shown from three independent cell line experiments (n = 3). Results shown are means ± SEM. *p < 0.05 H2O2 or HG or HG/Pal to control, **p < 0.05 neratinib to vehicle-treated β-cells under the same diabetogenic conditions; all by Student’s t tests. Source data are provided as a Source Data file
Fig. 3
Fig. 3
Neratinib blocks MST1 activation and apoptosis in human islets. Human islets were exposed to diabetogenic conditions (a, c, d IL-1β/IFNγ, bd mixture of 22.2 mM glucose and 0.5 mM palmitate (HG/Palm)) ± neratinib for 72 h. a, b Phospho-MST1 (pMST1; pThr183), caspase-3 cleavage, and GAPDH or actin were analyzed by western blotting. Representative Western blots of four different human islet donors (a, b; upper panels) and pooled quantitative densitometry analysis (a, b; lower panels) of six different human islet donors are shown (n = 6). c, d β-cell apoptosis analyzed by triple staining of TUNEL (black nuclei), insulin (green), and dapi (blue). Scale bar, 100 μm. An average number of 40,420 insulin-positive β-cell per condition was counted in 3–4 independent experiments from 3 to 4 different human islet donors (n = 3–4). Results shown are means ± SEM. *p < 0.05 IL/IF or HG/Pal to control, **p < 0.05 neratinib to vehicle-treated islets under the same diabetogenic conditions; all by Student’s t tests. Source data are provided as a Source Data file
Fig. 4
Fig. 4
Neratinib blocks MST1 signaling and MST1-induced β-cell apoptosis. a Domain structure and mechanism of action for the LATS-BS. At control condition, there is no interaction between YAP and 14-3-3 showing minimal bioluminescence activity for LATS-BS (N-luc-YAP15-S127 and C-luc-14-3-3). Upon LATS activation induced by MST1, LATS-dependent phosphorylation of YAP15-S127 (analyzed by Western blotting in (c)) leads to 14-3-3 binding, luciferase complementation, and high biosensor signal corresponding to higher LATS activity (analyzed by bioluminescence in (b)). b, c Adenoviral overexpression of MST1/LATS2 or LacZ (control) in INS-1E cells, which had been transfected with the firefly luciferase reporter plasmids N-luc-YAP15-S127 and C-luc-14-3-3 as well as pRL-Renilla luciferase vector control 24 h before 10 μM neratinib or canertinib was added for the last 24 h. Downstream YAP-S127 phosphorylation was determined by luciferase activity (normalized to the Renilla signal (b)). Western blotting for YAP-127 phospho-specific antibody (c); successful transfection was confirmed by LATS2 and MST1 analysis, and actin was used as housekeeping control. Data are means from six independent culture dishes (n = 6; b) or four independent cell line experiments (n = 4; c) ± SEM. Representative Western blot is shown. d, e Human islets were infected with Ad-LacZ (control) or Ad-MST1 adenoviruses and exposed to 10 μM neratinib for 48 h. f, g Isolated islets from MST1-KO mice and their WT littermates were recovered after isolation overnight and exposed to diabetogenic conditions (IL-1β/IFNγ or the mixture of 22.2 mM glucose and 0.5 mM palmitate (HG/Pal)) ± 10 μM neratinib for 72 h. dg β-cell apoptosis was analyzed by triple staining of TUNEL (black nuclei), insulin (green), and dapi (blue). Scale bar, 100 μm. d An average number of 30,700 insulin-positive β-cell per condition was counted in three independent experiments from three different donors (n = 3) and f of 5942 insulin-positive β-cells per condition from three to seven mice/condition (n = 3–7). Results shown are means ± SEM. *p < 0.05 MST-OE, or IL/IF or HG/Pal to Lac-Z or control, **p < 0.05 neratinib treated with MST1-OE or IL/IF or HG/Pal-treated islets to vehicle-treated islets under the same conditions; §p < 0.05 MST1-KO to WT islets under the same diabetogenic conditions; all by Student’s t tests. Source data are provided as a Source Data file
Fig. 5
Fig. 5
Neratinib but not canertinib binds to MST1 and restores β-cell survival through MST1 inhibition. a CETSA assay was performed in INS-1E cells pretreated with 5 μM neratinib, canertinib, or vehicle control, followed by heating to denature and precipitate protein at different temperatures. The stabilized MST1 protein in the soluble fraction of the cell lysate was detected by using western blotting. b, c INS1-E cells were exposed to diabetogenic conditions (22.2 mM glucose and 0.5 mM palmitate (HG/Pal)) ± 10 μM neratinib or canertinib for 24 h. Phospho-MST1 (pMST1; pThr183), caspase-3 and PARP cleavage, and BIM and actin were analyzed by western blotting. Representative Western blots (b) and pooled quantitative densitometry analysis (c) are shown from 3–6 independent culture dishes (n = 3–6). Results shown are means ± SEM. *p < 0.05 HG/Pal to control, **p < 0.05 neratinib to vehicle + HG/Pal-treated β-cells under the same conditions; all by Student’s t tests. Source data are provided as a Source Data file
Fig. 6
Fig. 6
Neratinib improves glycemia, insulin secretion, and β-cell survival in the MLD–STZ-mouse model of type 1 diabetes. C57Bl/6J mice were injected with 40 mg/kg streptozotocin or citrate buffer for 5 consecutive days. Neratinib or vehicle was daily i.p. injected at a concentration of 5 mg/kg starting 3 h before the first STZ injection throughout the whole experiment of 35 days. a Random fed blood glucose measurements after the first STZ injection (day 0) over 35 days and b intraperitoneal glucose tolerance test (ipGTT); (respective area-under-the curve (AUC) analyses are shown in the right insets). c, d Intraperitoneal insulin tolerance test (ipITT). In d, basal glucose values were normalized to 100%. e Insulin secretion measured from retro-orbital blood draw during an ipGTT measured before (0 min) and 15 min after glucose injection; data are expressed as the ratio of secreted insulin at 15 min/0 min (stimulatory index). f The ratio of secreted insulin and glucose is calculated at fed state. gi Mice were killed at day 35. g β-cell mass (given as percentage of the whole pancreatic section from ten sections spanning the width of the pancreas) and quantitative analyses from triple staining for h TUNEL or i Ki67, insulin, and DAPI expressed as percentage of TUNEL- or Ki67-positive β-cells ±SEM. An average number of 2331 (h), or 26369 (i) β-cells were counted. n = 9 mice/group for (a); n = 4–12 for (b); n = 5–15 for (c) and (d); n = 12–19 for (e); n = 8–14 for (f); n = 4–9 for (g); n = 4–11 for (h); and = 6–11 mice/groupfor (i); all from three independent experiments). Data show means ± SEM. *p < 0.05 STZ compared with vehicle-injected mice, **p < 0.05 STZ compared with STZ-Nera injected mice; by one-way ANOVA with Bonferroni corrections for (a, b); by Student’s t tests for (ei). Source data are provided as a Source Data file
Fig. 7
Fig. 7
Neratinib restores PDX1, NKX6.1, and Glut2 expression. Representative triple stainings for PDX1 (red, a), Glut2 (red, b), or NKX6.1 (red, c), insulin (green), and DAPI (blue) are shown from vehicle-, STZ-, and STZ/Nera-treated mice (n = 8, 4, 9 & 9 mice/group). Scale bar, 100 μm
Fig. 8
Fig. 8
Neratinib improves glycemia, insulin secretion, and β-cell survival in obese db/db mouse model of type 2 diabetes. Obese diabetic Leprdb/db mice on the C57BLKS/J background (db/db) were randomized in two groups at the age of 6 weeks, and then, neratinib or vehicle was daily i.p. injected at a concentration of 5 mg/kg throughout the whole experiment of 31 days. a Random fed blood glucose measurements before and after 31 days of Neratinib or vehicle injection (last day of the study). b Intraperitoneal glucose tolerance test (ipGTT). c, d Intraperitoneal insulin tolerance test (ipITT). In d, basal glucose values were normalized to 100% (respective area-under-the-curve (AUC) analyses for b and d are shown in the right insets). e Insulin secretion during an ipGTT measured before (0 min) and 15 min after glucose injection. f The ratio of secreted insulin and glucose is calculated at fed state. Data are representative of six mice per group (n = 6 for (af)). gj Mice were killed at day 31. g β-cell mass (given as percentage of the whole pancreatic section from ten sections spanning the width of the pancreas; n = 5 mice/group) and quantitative analyses from triple stainings for (h) TUNEL, (i) Ki67, (j) pHH3, and (k) nuclear PDX1 expression, insulin, and DAPI expressed as percentage of TUNEL-, Ki67-, pHH3-, or nuclear PDX1-positive β-cells ± SEM. An average number of 13667 (h), 5937 (i), 7108 (j), or 4330 (k) β-cells were counted from n = 3–5 (h, i, k) or n = 5–6 (j) mice/group. Data show means  ± SEM. *p < 0.05 vehicle control at the end (10.5 weeks of age) compared with the start of the study (6 weeks of age), **p < 0.05 db/db compared with db/db-Nera injected mice; by one-way ANOVA with Bonferroni corrections for (a); by Student’s t tests for (bk). Source data are provided as a Source Data file
Fig. 9
Fig. 9
Neratinib improves β-cell survival in islets in a therapeutic ex vivo approach. a, b Isolated islets from 10-week-old obese diabetic Leprdb/db mice or their heterozygous db/+ littermates were exposed to 10 μM neratinib for 24 h, fixed, and 2-μm sections were prepared. a Percentage of TUNEL-positive β-cells is shown as means ± SEM. b β-cell apoptosis was analyzed from islet sections by triple staining of TUNEL (red nuclei), insulin (green), and dapi (blue); scale bar, 100 μm. c Phospho-MST1 (pMST1; pThr183), caspase-3 cleavage, BIM and GAPDH, or actin were analyzed by western blotting shown by a representative blot (c) and pooled quantitative densitometry analysis (d). e, f Isolated islets from 2-month-old WT C57Bl/6 mice were exposed to the IL-1β/IFNγ cytokine mixture for 72 h (IL/IF); 10 μM neratinib was added to the culture for the last 24 h. e Percentage of TUNEL-positive β-cells is shown as means ± SEM. f β-cell apoptosis was analyzed from attached islet cultures by triple staining of TUNEL (black nuclei), insulin (green), and dapi (blue). Scale bar, 100 μm. All data are means ± SEM from multiple mice/condition (n = 6–8 for (a); n = 2–4 for (c); n = 3–5 for (e)). *p < 0.05 db/db or IL/IF to heterozygous db/+ or untreated control islets, **p < 0.05 neratinib to vehicle-treated islets under the same diabetogenic conditions; all by Student’s t tests. Source data are provided as a Source Data file

References

    1. Kurrer MO, Pakala SV, Hanson HL, Katz JD. Beta cell apoptosis in T cell-mediated autoimmune diabetes. Proc. Natl Acad. Sci. USA. 1997;94:213–218. doi: 10.1073/pnas.94.1.213. - DOI - PMC - PubMed
    1. Mathis D, Vence L, Benoist C. beta-Cell death during progression to diabetes. Nature. 2001;414:792–798. doi: 10.1038/414792a. - DOI - PubMed
    1. Butler AE, et al. Beta-cell deficit and increased beta-cell apoptosis in humans with type 2 diabetes. Diabetes. 2003;52:102–110. doi: 10.2337/diabetes.52.1.102. - DOI - PubMed
    1. Rhodes CJ. Type 2 diabetes-a matter of beta-cell life and death? Science. 2005;307:380–384. doi: 10.1126/science.1104345. - DOI - PubMed
    1. Vetere A, Choudhary A, Burns SM, Wagner BK. Targeting the pancreatic beta-cell to treat diabetes. Nat. Rev. Drug Discov. 2014;13:278–289. doi: 10.1038/nrd4231. - DOI - PubMed

Publication types

MeSH terms