. 2019 Nov 1;10(1):4997.
doi: 10.1038/s41467-019-13014-7.

Impact of delivery mode-associated gut microbiota dynamics on health in the first year of life

Affiliations

Impact of delivery mode-associated gut microbiota dynamics on health in the first year of life

Marta Reyman et al. Nat Commun. .

Erratum in

Abstract

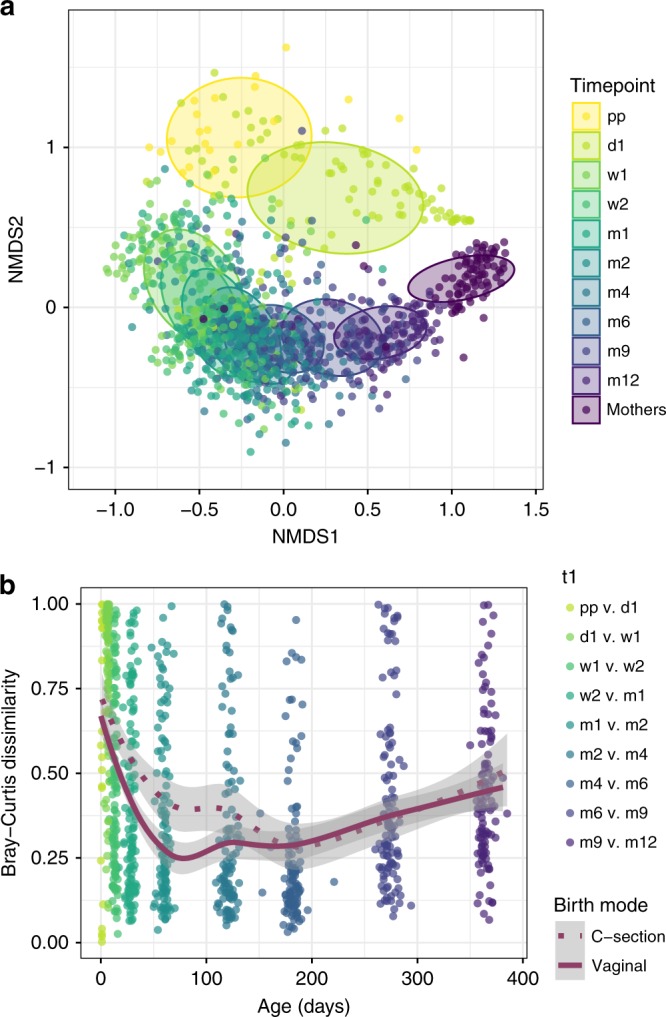
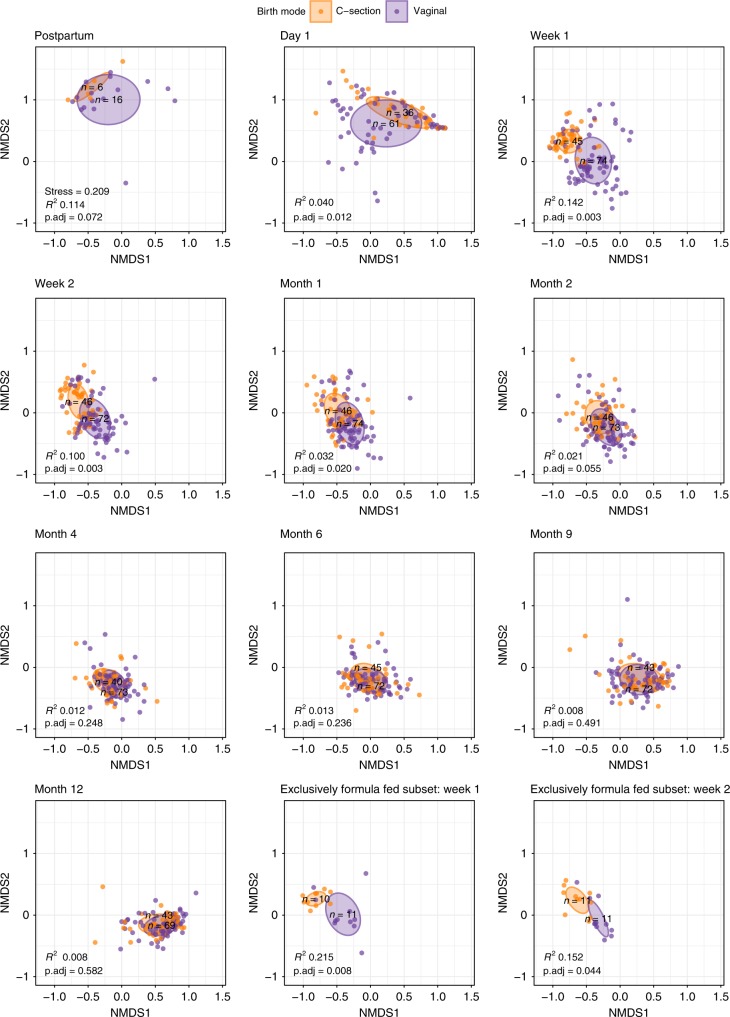
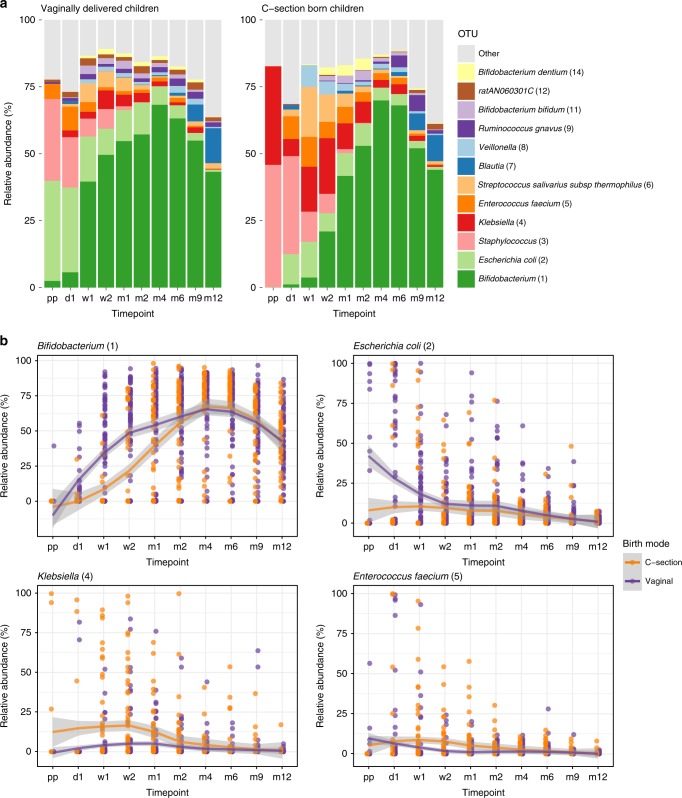
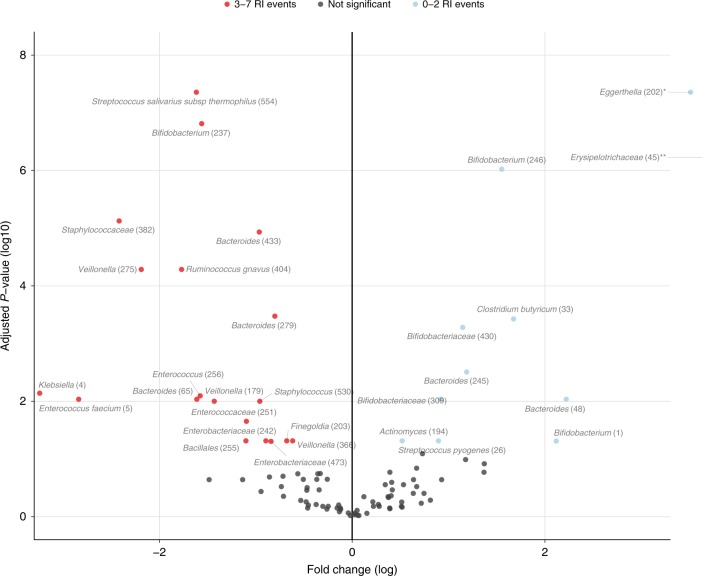
The early-life microbiome appears to be affected by mode of delivery, but this effect may depend on intrapartum antibiotic exposure. Here, we assess the effect of delivery mode on gut microbiota, independent of intrapartum antibiotics, by postponing routine antibiotic administration to mothers until after cord clamping in 74 vaginally delivered and 46 caesarean section born infants. The microbiota differs between caesarean section born and vaginally delivered infants over the first year of life, showing enrichment of Bifidobacterium spp., and reduction of Enterococcus and Klebsiella spp. in vaginally delivered infants. The microbiota composition at one week of life is associated with the number of respiratory infections over the first year. The taxa driving this association are more abundant in caesarean section born children, providing a possible link between mode of delivery and susceptibility to infectious outcomes.


Conflict of interest statement

E.A.M.S. declares to have received unrestricted research support from Pfizer, grant support for vaccine studies from Pfizer and GSK, and fees paid to the institution for advisory boards or participation in independent data-monitoring committees for Pfizer and GSK. D.B. declares to have received unrestricted fees paid to the institution for advisory work for Friesland Campina and well as research support from Nutricia. None of the fees or grants listed here were received for the research described in this paper. No other authors reported financial disclosures. None of the other authors report competing interests.

Figures

Fig. 1
Fig. 1
Overall gut microbiota community composition development and stability. a Nonmetric multidimensional scaling (nMDS) plot, based on Bray–Curtis (BC) dissimilarity between samples, with data points and ellipses colored by timepoint. Children’s overall gut community composition developed toward a more adult-like pattern in the first year of life, becoming more similar to microbiota of adults (mothers’ samples, n = 87). b As measure of stability, we calculated BC dissimilarities between consecutive sample pairs belonging to an individual per time interval and plotted these at the end of each interval (t + 1). Loess lines were fitted over the data points per delivery mode group, and the gray areas represent the 0.95 confidence intervals. Stability was significantly lower in C-section born infants until 2 months of life. Source data are provided as a Source Data file
Fig. 2
Fig. 2
NMDS plots of children’s samples per timepoint stratified according to mode of delivery. Nonmetric multidimensional scaling (nMDS) plots, based on Bray–Curtis (BC) dissimilarity between samples, visualizing the overall gut bacterial community composition stratified for mode of delivery, per timepoint. Each data point represents the microbial community composition of one sample. The ellipses represent the standard deviation of data points belonging to each birth mode group, with the center points of the ellipses calculated using the mean of the coordinates per group. The stress of the ordination, effect sizes (R2) calculated by multivariate permutational multivariate analysis of variance (PERMANOVA) tests and corresponding adjusted p-values (p.adj) are shown in the plots, and n represents the biologically independent samples per group
Fig. 3
Fig. 3
Comparison of overall composition between children and mothers (own vs. other). Children’s fecal microbiota were compared to the mothers’ fecal microbiota, based on BC dissimilarity and stratified according to mode of delivery. A significantly lower dissimilarity (more comparable microbiota) was observed between a child’s microbiota and its own mother vs. other mothers in children born vaginally throughout the first year of life, but not in children born by C-section (linear mixed models, ANOVA; p = 0.025 and p = 0.271, respectively). Boxplots with medians are shown; the lower and upper hinges correspond to the first and third quartiles (the 25th and 75th percentiles); the upper and lower whiskers extend from the hinge to the largest and smallest value no further than 1.5*IQR from the hinge; outliers are plotted individually. Pp = postpartum, d = day, m = month, n = number of mother-own-infant pair comparison per timepoint. Source data are provided as a Source Data file
Fig. 4
Fig. 4
Mean relative abundance of most abundant OTUs. a Mean relative abundances of the 12 most abundant OTUs are depicted for all samples per timepoint, stratified by birth mode. Pp = postpartum, d = day, m = month. b Mean relative abundances of Bifidobacterium, Escherichia, Klebsiella, and Enterococcus over time. Loess lines were fitted over the data points per delivery mode group and the gray areas represent the 0.95 confidence intervals. Source data are provided as a Source Data file
Fig. 5
Fig. 5
Differentially abundant taxa between 0-2 vs. 3-7 RI events in first year of life. To identify taxa that were differentially abundant between children experiencing more vs. limited respiratory infection (RI) events over the first year of life, fitZig analysis was performed on the 119 samples obtained at week 1 with the rare-features-filtered OTU-table containing 97 taxa and contrasts set to 0–2 vs. 3–7 RI events in the first year of life. The blue data points indicate taxa that were significantly more abundant in children having 0–2 RI events, while red points represent taxa that were significantly more abundant in children with 3–7 RI events in the first year of life. The results of two data points falling beyond the limits of the plot: *Eggerthella log2FC 3.512, adjusted p-value (log10) 7.357, **Erysipelotrichaceae log2FC 6.912, adjusted p-value (log10) 6.222, calculated using a zero-inflated Gaussian mixture model. Source data are provided as a Source Data file

References

    1. Tamburini S, Shen N, Wu HC, Clemente JC. The microbiome in early life: implications for health outcomes. Nat. Med. 2016;22:713–722. - PubMed
    1. Savage DC. Microbial ecology of the gastrointestinal tract. Annu. Rev. Microbiol. 1977;31:107–133. - PubMed
    1. Gensollen T, Iyer SS, Kasper DL, Blumberg RS. How colonization by microbiota in early life shapes the immune system. Science. 2016;352:539–544. - PMC - PubMed
    1. Dominguez-Bello MG, et al. Delivery mode shapes the acquisition and structure of the initial microbiota across multiple body habitats in newborns. Proc. Natl Acad. Sci. USA. 2010;107:11971–11975. - PMC - PubMed
    1. Sevelsted A, Stokholm J, Bønnelykke K, Bisgaard H. Cesarean section and chronic immune disorders. Pediatrics. 2015;135:e92–e98. - PubMed

Publication types