. 2019 Nov 1;9(1):15808.
doi: 10.1038/s41598-019-52386-0.

Alternatively spliced isoforms reveal a novel type of PTB domain in CCM2 protein

Affiliations

Alternatively spliced isoforms reveal a novel type of PTB domain in CCM2 protein

Xiaoting Jiang et al. Sci Rep. .

Abstract

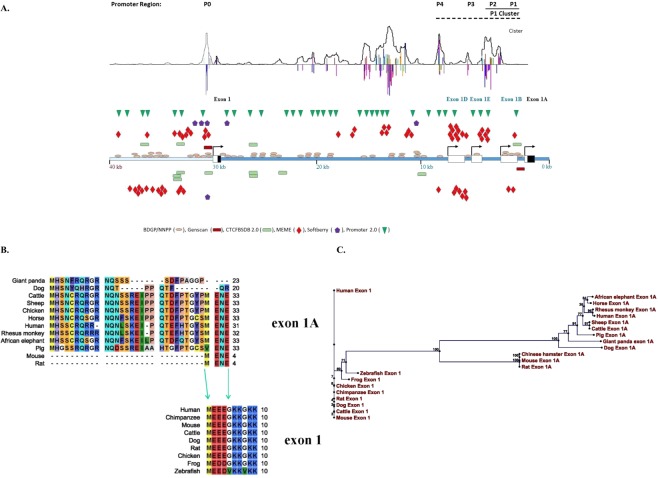
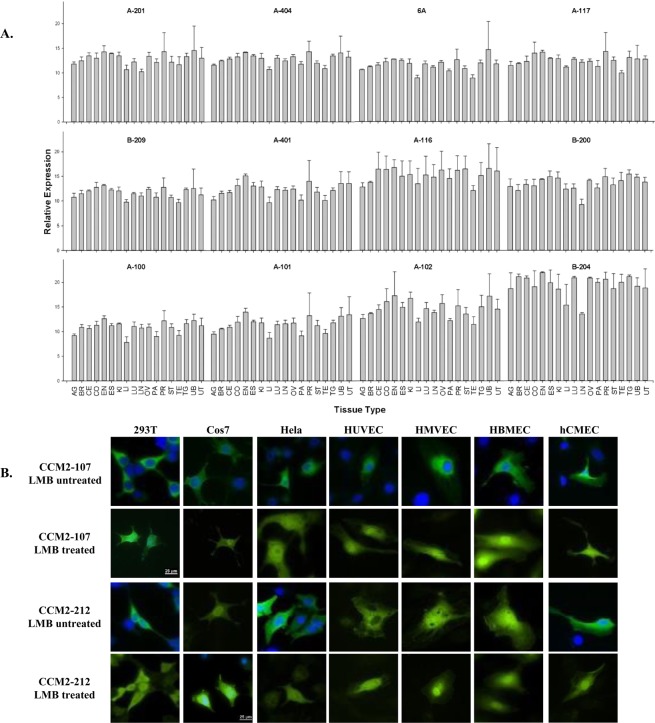
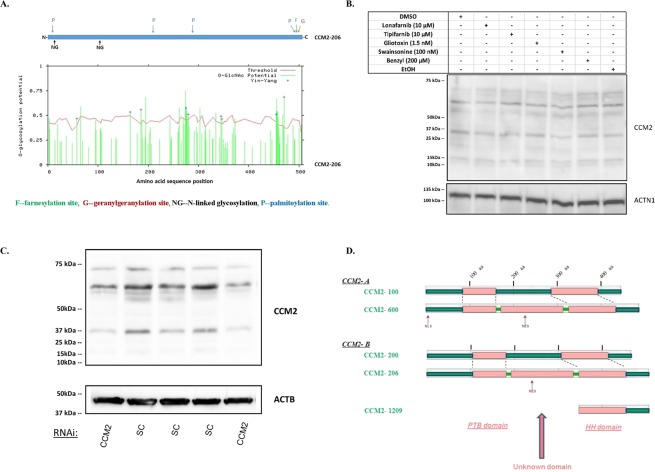
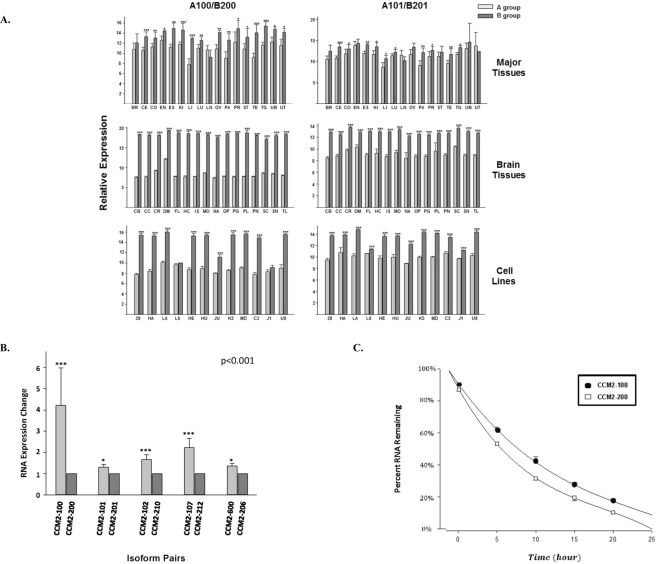
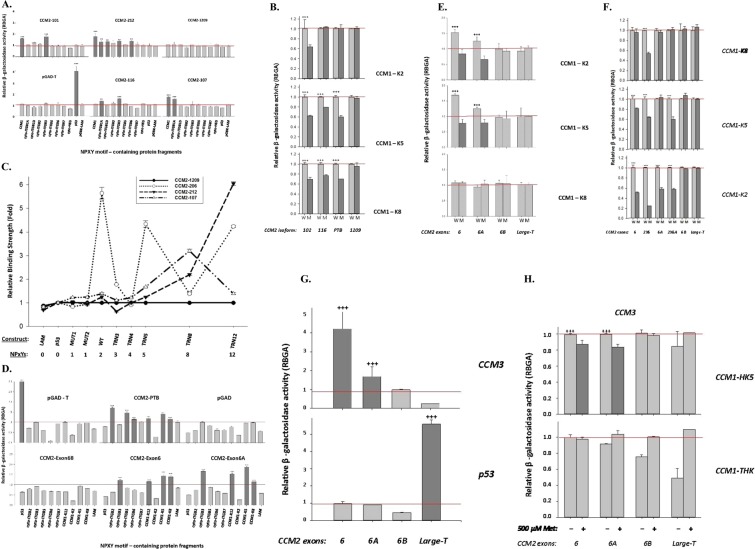
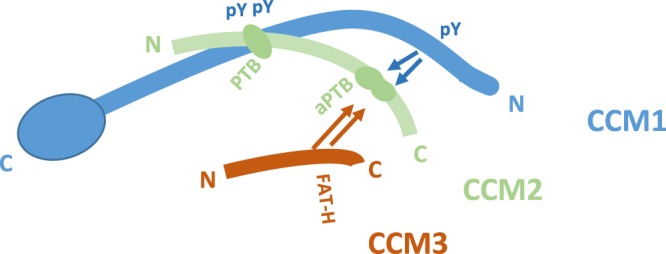
Cerebral cavernous malformations (CCMs) is a microvascular disorder in the central nervous system. Despite tremendous efforts, the causal genetic mutation in some CCM patients has not be identified, raising the possibility of an unknown CCM locus. The CCM2/MGC4607 gene has been identified as one of three known genes causing CCMs. In this report, we defined a total of 29 novel exons and 4 novel promoters in CCM2 genomic structure and subsequently identified a total of 50 new alternative spliced isoforms of CCM2 which eventually generated 22 novel protein isoforms. Genetic analysis of CCM2 isoforms revealed that the CCM2 isoforms can be classified into two groups based on their alternative promoters and alternative start codon exons. Our data demonstrated that CCM2 isoforms not only are specific in their subcellular compartmentation but also have distinct cellular expression patterns among various tissues and cells, indicating the pleiotropic cellular roles of CCM2 through their multiple isoforms. In fact, the complexity of the CCM2 genomic structure was reflected by the multiple layers of regulation of CCM2 expression patterns. At the transcriptional level, it is accomplished by alternative promoters, alternative splicing, and multiple transcriptional start sites and termination sites; while at the translational level, it is carried out with various cellular functions with a distinguishable CCM2 protein group pattern, specified abundance and composition of selective isoforms in a cell and tissue specific fashion. Through experimentation, we discovered a unique phosphotyrosine binding (PTB) domain, namely atypical phosphotyrosine binding (aPTB) domain. Some long CCM2 isoform proteins contain both classes of PTB domains, making them a dual PTB domain-containing protein. Both CCM1 and CCM3 can bind competitively to this aPTB domain, indicating CCM2 as the cornerstone for CCM signaling complex (CSC).


Conflict of interest statement

The authors declare no competing interests.

Figures

Figure 1
Figure 1
Genomic structure, conservation, and variability among alterative start-codon exons and promotors of CCM2. (A) The complex promoter regions of human CCM2 locus were defined with bioinformatics (promoter prediction software from top to bottom: Cister, promotor2.0, Softberry, MEME, CTCFBSDB, BDGP/NNPP and Genscan as indicated by different colors). Symbols on top of DNA templates are on positive strand, below are on negative strand. The single promoter for the original bonafide start-codon exon, exon 1, simply lies immediately upstream of the transcription start site for exon 1, as P0. The promoter region for exon 1A is much more complicated. Although a seemingly weak promoter, P1 lies immediately upstream of its transcription-start site; in addition, there are three relatively strong promoters (P2-P4) upstream adjacent to P1 promoter. Three exons (exon 1B, 1D, 1E) with the transcription start site driven by these three promoters (P2-P4), respectively, usually skip exon 1A (coding exon), presumably to down-regulate the transcription level of group B CCM2 isoforms. Genomic structure of 5′ region of the human CCM2 locus is schematically summarized in this map. Noncoding region within a transcription-start exon labeled as white box while coding region within the exon labeled as black box. (B) Multiple-alignment between two alterative start codon exons (exon 1 and exon 1A) across species reveals a vertebrate-specific exon 1 and a mammalian-specific exon 1A and their evolutional relationship. Exon 1A is evolutionarily evolved from exon1 with its C-terminus homolog to the N-terminus of exon1. (C) Phylogenetic relationships between exon 1A and exon 1 among CCM2 isoforms across species based on neighbor joining (NJ) method which hypothesizes a stochastic process in different lineages during evolution.
Figure 2
Figure 2
Relative expression profiling of endogenous CCM2 isoforms among various tissues. (A) The relative expression (2−∆CT) of CCM2 isoforms measured by qPCR in various tissues is presented with bar plots. Allele-specific real-time quantitative PCR (qPCR) assays were performed in triplicates (n = 3) and represented with means and standard deviations (M ± SD) of the relative expressions. Adrenal gland (AG), Breast (BR), Cervix (CE), Colon (CO), Endometrium (EN), Esophagus (ES), kidney (KI), Liver (LI), Lung (LU), Lymph node (LN), Ovary (OV), Pancreas (PA), Prostate (PR), Stomach (ST), Testis (TE), Thyroid gland (TG), Urinary bladder (UB), and Uterus (UT). (B) Subcellular localization of CCM2 isoform pairs, CCM2-107 and CCM2-212, in various immortalized cell lines: Immortalized Human Embryonic Kidney cells (293 T), Immortalizing Monkey Kidney Fibroblast cells (COS7), Immortalized Human Cervical Cancer cells (HeLa); and several primary/immortalized human endothelial cell lines: Human Umbilical Vein Endothelial Cells (HUVEC), Human Microvascular Endothelial Cells (HMVEC), Human Brain Microvascular Endothelial Cells (HBMEC), and Immortalized Human Cerebral Microvascular Endothelial Cells, hCMEC/D3 cells (hCMEC). Isoform CCM2-107s is seen predominantly in the cytoplasm in every cell line but accumulates in the nucleus after treatment with leptomycin (LMB treated). However, isoform CCM2-212 behaves differently and is seen predominantly in the cytoplasm in some cells, but distributed evenly in both the nucleus and cytoplasm before leptomycin treatment (LMB untreated), indicating its differentiated cellular compartmentation, possible nuclear function, and potential association with new cellular partners. Scale bars represent 25 µm and are located in CCM2-107 LMB treated 293 T panel and CCM2-212 LMB treated Cos7 panel; all images were acquired using the same microscope and magnitude and processed identically to each other.
Figure 3
Figure 3
Cellular distribution and motifs/domains among different endogenous CCM2 isoform proteins. (A) the potential post-translation modification (PTM) sites were defined with prediction software by searching the longest CCM2 isoform, CCM2-206. In the upper panel, CSS (clustering and scoring strategy) was used to scan palmitoylation sites (P), farnesylation sites (F), and geranylgeranylation sites (G) while NetNGlyc 1.0 was used to predict N-glycosylation sites (NG). In the lower panel, YinOYang 1.2 was used to predict O-glycosylation sites: green bars surpassing the red threshold line have significant chance to be glycosylated at the site through O-glycosylation. Each major PTM is color coded. (B) Multiple CCM2 protein bands are not a result of post-translation modifications. Two different vehicle-controls (DMSO, EtOH), inhibitors of farnesylation (Lonafarnib, Tipifarnib, Gliotoxin) and geranylgeranylation (GGTI-298), N-linked glycosylation inhibitor (Swainsonine), and O-linked glycosylation inhibitor (benzyl-α-GalNAc, Benzyl) were used to treat 293 T cells. None of the treatments resulted in missing bands or significantly changed band density, comparable to the controls. (C) Multiple CCM2 protein bands are diminished by silencing CCM2. 293 T cells were treated with either CCM2 RNAi (siRNA-CCM2) or scrambled control (SC). Significantly decreased densities of all protein bands of CCM2 were observed consistently (two shown) in CCM2 knockdown cells, relative to SC controls. (D) Bioinformatics analysis of potential functional domains and putative linear motifs in CCM2 isoforms. (D1). Two longest isoform pairs of CCM2 from A group (100 and 600) and B group (200 and 206) were selected, to screen for intrinsic globularity with GlobPLot 2.3 and putative linear motifs with ELM, (Eukaryotic linear motifs). Structurally globular regions are considered to be composed of different secondary structures and fold types (pink), in contrast to disorder (unstructured) regions (green). All isoforms of CCM2 from A group and B group share two common globular regions: N-terminal globular region which harbors PTB domain and C-terminal region which covers HH domain (Harmonin homology). Intriguingly, a third globular region was identified, by analyzing two longest isoforms of CCM2, which have an additional newly identified 41 amino acid (aa) peptide coded by exon 6A (CCM2-600 and CCM2-206), compared to their respective paired isoforms, CCM2-100 (A) and CCM2-200 (B). The appearance of a new middle globular region might suggest an additional secondary structure and fold created in conjunction with this additional peptide. (D2). With motif prediction tool, ELM, we found five major linear protein motifs along CCM2 isoforms. (D2.1). Motif for protein degradation (red colored). 11, signal motif targeting to endoplasmic reticulum (ER) lumen; 12, signal motif targeting the protein for degradation in a cell cycle dependent manner; 13, signal motif targeting the protein for degradation by binding to the UBR-box of N-recognins; 14, S/T rich motif for SPOP/Cul3-dependant ubiquitination; 15, a degron motif, for the cyclin’s degradation; 16, LIR motif in autophagy; 17, di-Arg ER retention motif, targeting to endoplasmic reticulum (ER) lumen; 18, Sorting motif, targeting to the lysosomal-endosomal-complex. (D2.2). Motif for protein phosphorylation (pink colored). 21, canonical motif for the CDK phosphorylation site; 22, canonical motif for MAP kinases docking or phosphorylation site; 23, CK1 phosphorylation site; 24, GSK3 phosphorylation recognition site. (D2.3). Motif for proteinase cleavage (dark blue colored). 31, canonical motif for proteinase cleavage site. (D2.4). Motif for protein-protein binding (light blue colored). 41, Docking motif in calcineurin; 42, USP7 MATH domain binding motif; 43, USP7 CTD domain binding motif; 44, WW domain interaction motif. (D2.5). Motif for nucleocytoplasmic shuttling (brown colored). NLS, nuclear localization signals; NES, nuclear export signals. Most of the predicted motifs for two pairs are identical, except a few motifs which are located at the beginning of transcript (exon 1 for A group, exon 1A for B group).
Figure 4
Figure 4
The relative expression level and cellular stability between A and B group isoforms. (A) Comparison of endogenous expression levels between CCM2 isoform pairs among various tissues. The relative mRNA expression levels of paired-CCM2 isoforms (2−∆CT) were presented with bar plots, in which light grey bars represent A group isoforms, dark grey bars represent their respective counterparts, B group isoforms. For experimental design, the left three panels represent expression levels between CCM2 isoform pairs with primer set, CCM2-A100 and CCM2-B200; the right three panels for CCM2 isoform pairs with primer set, CCM2-A101 and CCM2-B201. For tissue location and cell lines, upper two panels represent the expression levels of paired-CCM2 isoforms among major tissues (see Fig. 2A), middle two panels for various brain tissues, and lower two panels for multiple cell lines (see Suppl. Fig. 1) Middle and lower panels are further described in supplemental Fig. 1. One-way ANOVA was also performed for the comparison between A and B groups of isoforms among different tissues and cells; it was found there is a very significant difference (P < 0.001). The detailed information for isoform-qPCR primer sets is listed in Suppl. Table 2. (B) The changes in the expression levels between ectopic expressed A and B group isoform pairs. The expression levels were measured by allele-specific qPCR (V5-tag), then normalized first by internal expression control (Neo) and followed by mean values for B group isoforms, presented as fold changes. (C) Comparison of RNA decay rates between two ectopic expressed CCM2-100 (A) and CCM2-200 (B), isoform pairs from groups A and B respectively, measured with allele-specific qPCR primers (Suppl. Table 2) at five different time points (after 5, 10, 15, 20, and 25 hours). The solid circle presents A Group isoform (CCM2-100), while hollow square presents Group B isoform (CCM2-200). One-way ANOVA was also performed for the comparison between A and B groups of isoforms and found there is a very significant difference for the expression levels between A and B groups of isoforms (P < 0.001). ***, **, and *above bar indicate P =< 0.001, 0.01, and 0.05 respectively for paired t-test. For major tissue abbreviations refer to Fig. 2; for brain tissue and cell line abbreviations please refer to Suppl. Fig. 1.
Figure 5
Figure 5
Molecular interactions defined with yeast two-hybrid system. (A) Interactions between various NPXY-motif containing protein fragments and CCM2 PTB-less isoforms (CCM2-116, CCM2-107, and CCM2-212). CCM2-101 serves as positive control, while CCM2-1209 as negative control. pGAD-T with p53 is a system control. (B) Interactions between wild type (W) and mutated (M) three NPXY motifs of CCM1 (K2, K5, and K8) and a CCM2 PTB-less isoform (CCM2-116). CCM2-102 and full-length CCM2 PTB domain serves as positive control, while CCM2-1209 as negative control. (C) Interactions between protein fragments containing various number of NPXY-motifs and CCM2 PTB-less isoforms (CCM2-107, and CCM2-212). CCM2-206 serves as positive control, while CCM2-1209 as negative control. (D) Interactions between various NPXY-motif containing protein fragments and CCM2 exons (6, 6A, and 6B). CCM2-PTB serves as positive control, while pGAD as negative control. pGAD-T with p53 is a system control. (E) Interactions between wild type (W) and mutated (M) three NPXY motifs of CCM1 (K2, K5, and K8) and CCM2 exons (6, 6A, and 6B). Large-T serves as system control. (F) Interactions between wild type (W) and mutated (M) three NPXY motifs of CCM1 (K2, K5, and K8) and CCM2 exons (6, 6A, and 6B) and duplicate forms (2 × 6 and 2 × 6A). Large-T serves as system control. (G) Interactions between CCM3 protein and CCM2 exons (6, 6A, and 6B). Large-T with p53 serves as system control. (H) Competition assays between CCM3 protein with either CCM1-HK5 (containing 1st NPXY motif) (upper panel) or CCM1-THK (containing 2nd and 3rd NPXY motif) (lower panel) binding to CCM2 exons (6, 6A, and 6B). β -galactosidase activity of each transformant was measured, normalized, and converted to relative β -galactosidase activity (RBGA). The normalized data were represented with means and standard deviations (M ± SD) generated from at least three independent assays (n = 3). RBGA+++, ++: significantly higher than that observed in any negative controls (P < 0.001, 0.01 respectively). K2, K5, and K8 are fragments containing the first, second, and third NPXY motif in CCM1 respectively. Cyto-ITGB represents cytoplasmic tails of β integrins (usually containing two NPXY motifs).
Figure 6
Figure 6
Molecular interactions defined by co-immunoprecipitation (CO-IP). (A) Various NPXY-motif containing protein fragments pulling down PTB-less CCM2 isoforms (CCM2-107, CCM2-116, and CCM2-212). CCM2-201 serves as positive control. Interactions between cytoplasmic tails of β-Integrins and CCM2 isoforms were confirmed by IP with GST beads pull-down. (B) Various NPXY-motif containing protein fragments pulled down CCM2 exons (6, 6A, and 6B) with GST beads. Full-length CCM2 PTB domain serves as positive control, while CCM2-1209 as negative control. (C) Various NPXY-motif containing protein fragments pulling down CCM2 exons (6, 6A, and 6B) with HIS beads. NPXY motifs containing protein fragments are cytoplasmic tails of β-Integrins and CCM1 or PTB cores. CCM2-1209 (CCM2 C-terminal fragment, residues 303-444, no PTB domain), CCM1 fragments, K2 (1st NPXY motif), K5 (2nd NPXY motif), and mock control. Mock control is host cell lysate. MagneGST Glutathione Particles (Promega) for GST-tagged bait proteins and dynabeads (Invitrogen) for HIS-tagged bait proteins. All target proteins were labeled with radioactive with S.
Figure 7
Figure 7
Structures of the novel atypical PTB domain. (A) Ribbon representations of exon 6, exon 6A and exon 6B. Both exon 6 and exon 6A share a structural similarity with a C-terminal α helix followed by a turn, but not exon 6B. (B) Predicted ribbon presentation of CCM2 exon homo-and hetero-dimers. Homodimer of exon 6 (2X exon6), homodimer of exon 6A (2X exon6A) and heterodimer of exon 6 and 6A (canonical aPTB domain, exon6 + 6A) were simulated. Surprisingly, homodimer of exon 6 (2X exon6) was found to assemble to a naturally occurring heterodimer between exon 6 and 6A (exon6 + 6A), a dual horseshoe or simple duplication of exon 6, raising the doubt of the accuracy of predicted structure of exon 6A. (C) To determine accuracy of predicted structure of exon 6/6A, 4 or 9 amino acids from exon 6 were added to C-terminus of exon6A (N4 + exon6A and N9 + exon6A respectively). N4 + exon6A is equal to exon 6 in size (45 aa), while N9 + exon6A is larger than exon 6 in size (50 aa) and contains > 20% of amino acid sequence from exon 6, suggesting that neither size nor sequencing from exon 6 influences conformation of exon 6A. Red color: c-terminus and blue color: N-terminus.
Figure 8
Figure 8
Schematic representation of binding interaction among CCM proteins within CSC complex. Our current data suggests that CCM1 utilizes 2nd and 3rd NPXY motifs (pY) in its center portion to bind to CCM2 classic PTB domain (PTB). The remaining 1st NPXY motif competes with the CCM3 (FAT-H) to bind to the newly defined atypical PTB domain (aPTB) present at the C – terminus of the CCM2, suggesting CCM2 plays a central role in the CSC. CCM1: blue color; CCM2: light green color; CCM3: red color.

References

    1. Del Curling O, Jr., Kelly DL, Jr., Elster AD, Craven TE. An analysis of the natural history of cavernous angiomas. J Neurosurg. 1991;75:702–708. doi: 10.3171/jns.1991.75.5.0702. - DOI - PubMed
    1. Zhang J, Clatterbuck RE, Rigamonti D, Chang DD, Dietz HC. Interaction between krit1 and icap1alpha infers perturbation of integrin beta1-mediated angiogenesis in the pathogenesis of cerebral cavernous malformation. Hum Mol Genet. 2001;10:2953–2960. doi: 10.1093/hmg/10.25.2953. - DOI - PubMed
    1. Zawistowski JS, Serebriiskii IG, Lee MF, Golemis EA, Marchuk DA. KRIT1 association with the integrin-binding protein ICAP-1: a new direction in the elucidation of cerebral cavernous malformations (CCM1) pathogenesis. Hum. Mol. Genet. 2002;11:389–396. doi: 10.1093/hmg/11.4.389. - DOI - PubMed
    1. Uhlik MT, et al. Rac-MEKK3-MKK3 scaffolding for p38 MAPK activation during hyperosmotic shock. Nat Cell Biol. 2003;5:1104–1110. doi: 10.1038/ncb1071. - DOI - PubMed
    1. Zhang J, Carr C, Badr A. The cardiovascular triad of dysfunctional angiogenesis. Translational stroke research. 2011;2:339–345. doi: 10.1007/s12975-011-0065-5. - DOI - PMC - PubMed

Publication types