. 2019 Nov;51(11):1652-1659.
doi: 10.1038/s41588-019-0521-9. Epub 2019 Nov 1.

The impact of short tandem repeat variation on gene expression

Affiliations

The impact of short tandem repeat variation on gene expression

Stephanie Feupe Fotsing et al. Nat Genet. 2019 Nov.

Abstract

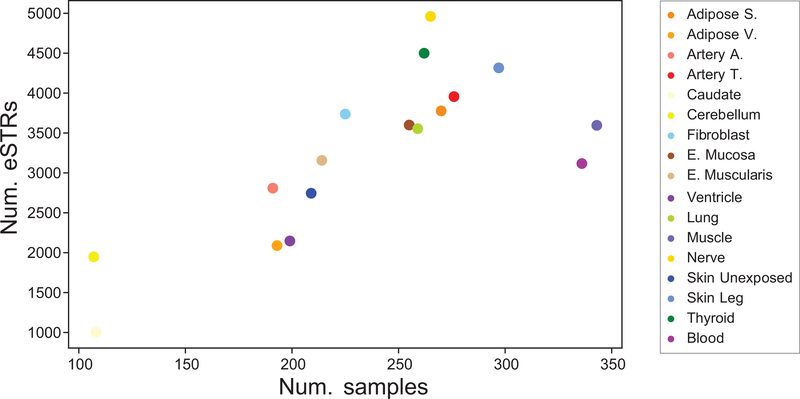
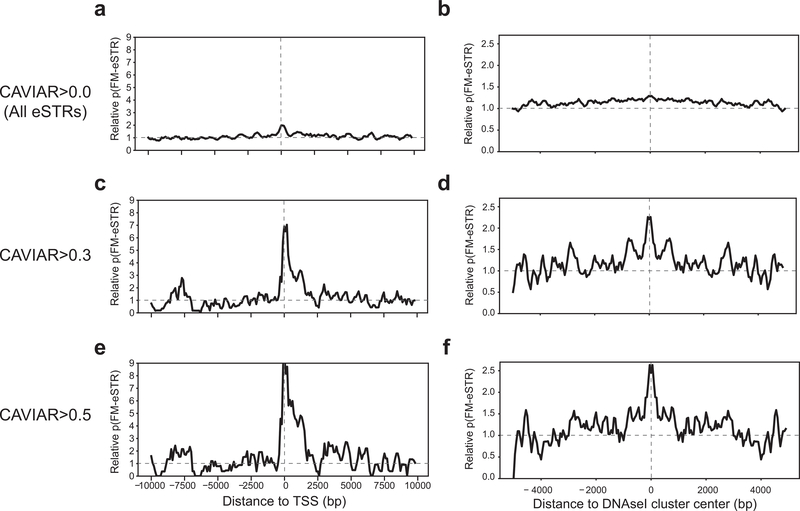
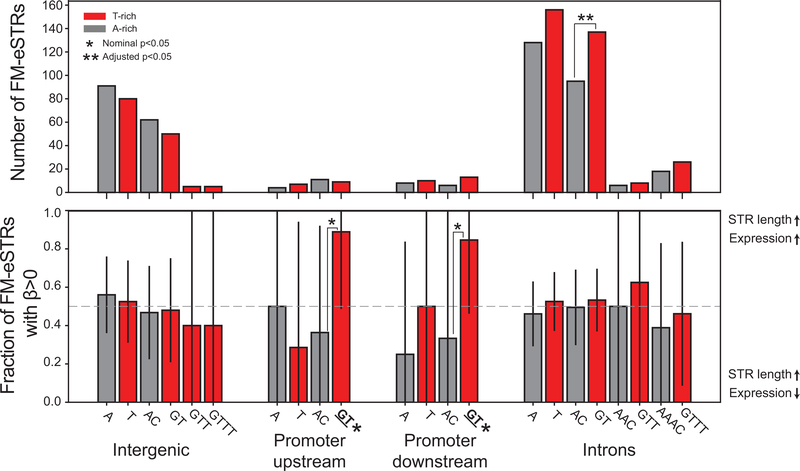
Short tandem repeats (STRs) have been implicated in a variety of complex traits in humans. However, genome-wide studies of the effects of STRs on gene expression thus far have had limited power to detect associations and provide insights into putative mechanisms. Here, we leverage whole-genome sequencing and expression data for 17 tissues from the Genotype-Tissue Expression Project to identify more than 28,000 STRs for which repeat number is associated with expression of nearby genes (eSTRs). We use fine-mapping to quantify the probability that each eSTR is causal and characterize the top 1,400 fine-mapped eSTRs. We identify hundreds of eSTRs linked with published genome-wide association study signals and implicate specific eSTRs in complex traits, including height, schizophrenia, inflammatory bowel disease and intelligence. Overall, our results support the hypothesis that eSTRs contribute to a range of human phenotypes, and our data should serve as a valuable resource for future studies of complex traits.


Conflict of interest statement

Competing Interests

The authors have no competing interests to declare.

Figures

Extended Data Fig. 1:
Extended Data Fig. 1:. Relationship between sample size and number of eSTRs detected
The x-axis shows the number of samples per tissue. The y-axis shows the number of eSTRs (gene-level FDR<10%) detected in each tissue. Each dot represents a single tissue, using the same colors as shown in Fig. 1 in the main text (see box on the right). Notably, although whole blood and skeletal muscle had the highest number of samples, we identified fewer eSTRs in those tissues than in others with lower sample sizes. This is concordant with previous results for SNPs in the GTEx cohort and may reflect higher cell-type heterogeneity in these tissue samples.
Extended Data Fig. 2:
Extended Data Fig. 2:. Enrichment of genomic annotations as a function of CAVIAR threshold
The x-axis represents CAVIAR thresholds in terms of the percentile (percentage of all 28,375 eSTRs excluded by those thresholds). The y-axis represents the odds ratio for enrichment in eSTRs above each percentile threshold in each of these categories: a. 5’UTRs (purple); b. 3’UTRs (blue); c. promoters (orange; TSS +/− 3kb); d. Coding regions (red) and e. Introns (green). The y-axis center values denote the log2 odds ratios comparing eSTRs passing each threshold to all STRs. Error bars represent +/−1 s.e.
Extended Data Fig. 3:
Extended Data Fig. 3:. Example multi-allelic FM-eSTRs
For each plot, the x-axis represents the mean number of repeats in each individual and the y-axis represents normalized expression in the tissue for which the eSTR was most significant. Boxplots summarize the distribution of expression values for each genotype. Horizontal lines show median values, boxes span from the 25th percentile (Q1) to the 75th percentile (Q3). Whiskers extend to Q1–1.5*IQR (bottom) and Q3+1.5*IQR (top), where IQR gives the interquartile range (Q3-Q1). The red line shows the mean expression for each x-axis value.
Extended Data Fig. 4:
Extended Data Fig. 4:. Sharing of eSTRs across tissues
The x-axis represents the number of tissues that share a given eSTR (absolute value of mashR Z-score >4). The y-axis represents the number of eSTRs shared across a given number of tissues.
Extended Data Fig. 5:
Extended Data Fig. 5:. Localization of all STRs around putative regulatory regions
Left and right plots show localization around transcription start sites and DNAseI HS clusters, respectively. The y-axis denotes the fraction of STRs of each type in each bin. For promoters, the x-axis is divided into 100bp bins. For DNAseI HS sites, the x-axis is divided into 50bp bins. In each plot, values were smoothed by taking a sliding average of each four consecutive bins. Only STR-gene pairs included in our analysis are considered. Each plot compares localization of the two possible sequences of a given repeat unit on the coding strand. i.e. top plots compare repeat units of the form CnG vs. their reverse complement on the opposite strand, middle plots compare AC vs. GT repeats, and bottom plots compare A vs. T repeats. The strand of each STR was determined based on the coding strand of each target gene.
Extended Data Fig. 6:
Extended Data Fig. 6:. Relative probability of eSTRs around TSSs and DNAseI HS sites for a range of CAVIAR scores
Plots are shown for FM-eSTRs defined using multiple CAVIAR thresholds (0, corresponding to all eSTRs, 0.3, as used in the main text, or 0.5). a., c., and e. show the relative probability of an STR to be an FM-eSTR around TSSs. The black lines represent the probability of an STR in each bin to be an FM-eSTR. Values were scaled relative to the genome-wide average. b., d., and f. show the relative probability of an STR to be an FM-eSTR around DNAseI HS clusters. Values were smoothed by taking a sliding average of each four consecutive bins.
Extended Data Fig. 7:
Extended Data Fig. 7:. Nucleosome occupancy and DNAseI hypersensitivity show distinct patterns around eSTRs
a-c. Nucleosome density around STRs with different repeat unit lengths. Nucleosome density in GM12878 in 5bp windows is averaged across all STRs analyzed (dashed) and FM-eSTRs (solid) relative to the center of the STR. b. DNAseI HS density around STRs with different repeat unit lengths. The number of DNAseI HS reads in GM12878 (gray), fat (red), tibial nerve (yellow), and skin (cyan) is averaged across all STRs in each category. Solid lines show FM-eSTRs. Dashed lines show all STRs. Left=homopolymers, middle=dinucleotides, right=tetranucleotides. Other repeat unit lengths were excluded since they have low numbers of FM-eSTRs (see Fig. 4a). Dashed vertical lines in (d) show the STR position +/− 147bp.
Extended Data Fig. 8:
Extended Data Fig. 8:. Strand-biased characteristics of FM-eSTRs
Top panel: the y-axis shows the number of FM-eSTRs with each repeat unit on the template strand. Bottom panel: the y-axis shows the percentage of FM-eSTRs with each repeat unit on the template strand that have positive effect sizes. Gray bars denote A-rich repeat units (A/AC/AAC/AAAC) and red bars denote T-rich repeat units (T/GT/GTT/GTTT). Single asterisks denote repeat units nominally enriched or depleted (two-sided binomial p<0.05). Double asterisks denote repeat units significantly enriched after controlling for multiple hypothesis testing (Bonferroni adjusted p<0.05). Asterisks above brackets show significant differences between repeat unit pairs. Asterisks on x-axis labels denote departure from the 50% positive effect sizes expected by chance. Error bars give 95% confidence intervals.
Extended Data Fig. 9:
Extended Data Fig. 9:. Example GWAS signals co-localized with FM-eSTRs
Left: For each plot, the x-axis represents the mean number of repeats in each individual and the y-axis represents normalized expression in the tissue with the most significant eSTR signal at each locus. Boxplots summarize the distribution of expression values for each genotype. Box plots are as defined in Fig. 1c. The red line shows the mean expression for each x-axis value. Right: Top panels give genes in each region. The target gene for the eQTL associations is shown in black. Middle panels give the -log10 p-values of association of the effect-size between each SNP (black points) and the expression of the target gene. The FM-eSTR is denoted by a red star. Bottom panels give the -log10 p-values of association between each SNP and the trait based on published GWAS summary statistics. P-values are two-sided and are based on t-statistics computed for effect sizes (β) (see Methods). Dashed gray horizontal lines give the genome-wide significance threshold of 5E-8.
Extended Data Fig. 10:
Extended Data Fig. 10:. Example GWAS signal for schizophrenia potentially driven by an eSTR for MED19
a. eSTR association for MED19. The x-axis shows STR genotypes at an AC repeat (chr11:57523883) as the mean number of repeats in each individual and the y-axis shows normalized MED19 expression in subcutaneous adipose. Each point represents a single individual. Red lines show the mean expression for each x-axis value. Boxplots are as defined in Fig. 1c. b. Summary statistics for MED19 expression and schizophrenia. The top panel shows genes in the region around MED19. The middle panel shows the -log10 p-values of association between each variant and MED19 expression in subcutaneous adipose tissue in the GTEx cohort. The FM-eSTR is denoted by a red star. The bottom panel shows the -log10 p-values of association for each variant with schizophrenia reported by the Psychiatric Genomics Consortium. The dashed gray horizontal line shows genome-wide significance threshold of 5E-8. c. Detailed view of the MED19 locus. A UCSC genome browser screenshot is shown for the region in the gray box in (b). The FM-eSTR is shown in red. The bottom track shows transcription factor (TF) and chromatin regulator binding sites profiled by ENCODE. The bottom panel shows long-range interactions reported by Mifsud, et al. using Capture Hi-C on GM12878. Interactions shown in black include MED19. Interactions to loci outside of the window depicted are not shown.
Figure 1:
Figure 1:. Multi-tissue identification of eSTRs.
(a) Schematic of eSTR discovery pipeline. We analyzed eSTRs using RNA-seq from 17 tissues and STR genotypes obtained from deep WGS for 652 individuals from the GTEx Project. (b) eSTR association results. The quantile-quantile plot compares observed p-values for each STR-gene test vs. the expected uniform distribution for each tissue. Gray dots denote permutation controls (n = 336). Supplementary Table 1 gives the number of tests performed in each tissue. (c) Example eSTRs previously implicated in disease. Example FM-eSTRs previously implicated in myoclonus epilepsy (left), spinocerebellar ataxia 36 (middle), and reduced lung function and cardiovascular disease (right) are shown. Black points represent single individuals. For each plot, the x-axis represents the mean number of repeats in each individual and the y-axis represents normalized expression in a representative tissue. Boxplots summarize the distribution of expression values. Horizontal lines show median values, boxes span from the 25th percentile (Q1) to the 75th percentile (Q3). Whiskers extend to Q1–1.5*IQR (bottom) and Q3+1.5*IQR (top), where IQR gives the interquartile range (Q3-Q1). The red line shows the mean expression for each x-axis value. Gene diagrams not drawn to scale. (d) eSTR correlations across tissues. Each cell shows the Spearman correlation between mashR FM-eSTR effect sizes for each pair of tissues. Only eSTRs with CAVIAR score >0.3 (FM-eSTRs) in one of the two tissues were included in each correlation. Supplementary Table 1 gives the number of FM-eSTRs identified in each tissue. Rows and columns were clustered using hierarchical clustering (Methods).
Figure 2:
Figure 2:. Characterization of FM-eSTRs
(a) Density of all STRs around transcription start sites (TSS). The y-axis shows the fraction of STRs with each repeat unit type located in each 100 bp bin around the TSS. (b) Density of all STRs around DNAseI hypersensitive sites. Plots are centered at ENCODE DNAseI HS clusters and represent the fraction of STRs with each repeat unit type located in each 50 bp bin. (c) Relative probability to be an FM-eSTR around TSSs. (d) Relative probability to be an FM-eSTR around DNAseI HS clusters. For a-d, values were smoothed using a sliding average of each four consecutive bins. (e) Repeat unit enrichment at FM-eSTRs. The x-axis shows all repeat units for which there are at least 3 FM-eSTRs across all tissues. The y-axis center values denote the log2 odds ratios comparing FM-eSTRs to all STRs. Error bars represent ± 1 s.e. Asterisks denote repeat units that are significantly enriched or depleted in FM-eSTRs (based on two-sided Fisher exact p-value). Per repeat unit sample sizes and Fisher exact statistics are provided in Supplementary Table 5. (f-h) Example GC-rich FM-eSTRs in promoters predicted to modulate secondary structure. Top plots show mean expression across all individuals with each mean STR length. Vertical bars represent ± 1 s.d. Bottom plots show the free energy computed for each allele based on template (solid) and non-template (dashed) strands. The x-axis shows STR lengths relative to hg19 (bp). Gene diagrams are not drawn to scale.
Figure 3:
Figure 3:. FM-eSTRs co-localize with GWAS signals.
(a) Overview of analyses to identify FM-eSTRs involved in complex traits. We assumed a model where variation in STR repeat number alters gene expression, which in turn affects the value of a particular complex trait. (b) eSTR association for RFT1. The x-axis shows STR genotype as the mean number of AC repeats and the y-axis gives normalized RFT1 expression. Boxplots defined as in Fig. 1c. (c) Summary statistics for RFT1 expression and height. The middle panel shows the -log10 p-values of association between each variant and RFT1 expression. The bottom panel shows the -log10 p-values of association for each variant with height. Black dots=SNPs; red star=FM-eSTR; gray dashed line=genome-wide significance threshold. (d) Genomic view of the RFT1 locus. (e) eSTR and SNP associations with height in the eMERGE cohort. The y-axis denotes association p-values for each variant. Black dots=SNPs; red star=imputed FM-eSTR; blue star=top eMERGE SNP. (f) Imputed RFT1 repeat number is correlated with height. The x-axis shows the mean number of AC repeats. The y-axis shows the mean normalized height for all samples included in the analysis with a given genotype. Error bars show ± 1 s.e. (g) Reporter assay testing repeat number vs. expression. A variable number of AC repeats plus genomic context were introduced upstream of a reporter gene. Gray dots show the value for each of n=3 transfections, each averaged across three technical replicates. Black lines show the mean across the three transfections.
Figure 4:
Figure 4:. Summary of FM-eSTRs classes and potential regulatory mechanisms
(a) Distribution of FM-eSTR classes across genomic annotations. Each bar shows the fraction of FM-eSTRs falling in each annotation consisting of homopolymer (gray), dinucleotide (red), trinucleotide (orange), tetranucleotide (blue), pentanucleotide (green) or hexanucleotide (purple) repeats. The total number of FM-eSTRs and the top five most common repeat units in each category are shown on the right. Note, FM-eSTRs may be counted in more than one category. (b) Homopolymer A/T STRs are predicted to modulate nucleosome positioning. Homopolymer repeats are depleted of nucleosomes (gray circles) and may modulate expression changes in nearby genes through altering nucleosome positioning. (c) GC-rich STRs form DNA and RNA secondary structures during transcription. Highly stable secondary structures such as G4 quadruplexes may act by expelling nucleosomes (gray circle) or stabilizing RNAPII (light green circle). These structures may form in DNA (black) or RNA (purple) The stability of the structure can depend on the number of repeats. (d) Dinucleotide STRs can alter transcription factor binding. Dinucleotides are prevalent in putative enhancer regions. They may potentially alter transcription factor binding by forming binding sites themselves (top), changing affinity of nearby binding sites (middle), or modulating spacing between nearby binding sites (bottom). For (b)-(d), text and arrows in the white boxes provide a summary of the predicted eSTR mechanism depicted in each panel.

References

References for Main Text

    1. Consortium, G. et al. Genetic effects on gene expression across human tissues. Nature 550, 204–213 (2017). - PMC - PubMed
    1. Lappalainen T et al. Transcriptome and genome sequencing uncovers functional variation in humans. Nature 501, 506–11 (2013). - PMC - PubMed
    1. Grünewald TGP et al. Chimeric EWSR1-FLI1 regulates the Ewing sarcoma susceptibility gene EGR2 via a GGAA microsatellite. Nat. Genet. 47, 1073–1078 (2015). - PMC - PubMed
    1. Song JHT, Lowe CB & Kingsley DM Characterization of a Human-Specific Tandem Repeat Associated with Bipolar Disorder and Schizophrenia. Am J Hum Genet 103, 421–430 (2018). - PMC - PubMed
    1. Boettger LM et al. Recurring exon deletions in the HP (haptoglobin) gene contribute to lower blood cholesterol levels. Nat Genet 48, 359–66 (2016). - PMC - PubMed

Methods-only references

    1. Kent WJ et al. The human genome browser at UCSC. Genome Res. 12, 996–1006 (2002). - PMC - PubMed
    1. Genomes Project, C. et al. A global reference for human genetic variation. Nature 526, 68–74 (2015). - PMC - PubMed
    1. Purcell S et al. PLINK: a tool set for whole-genome association and population-based linkage analyses. Am J Hum Genet 81, 559–75 (2007). - PMC - PubMed
    1. Patterson N, Price AL & Reich D Population structure and eigenanalysis. PLoS Genet 2, e190 (2006). - PMC - PubMed
    1. Price AL et al. Principal components analysis corrects for stratification in genome-wide association studies. Nat Genet 38, 904–9 (2006). - PubMed

Publication types