. 2020 Mar;72(3):435-447.
doi: 10.1002/art.41156. Epub 2020 Feb 4.

Polyfunctional, Proinflammatory, Tissue-Resident Memory Phenotype and Function of Synovial Interleukin-17A+CD8+ T Cells in Psoriatic Arthritis

Affiliations

Polyfunctional, Proinflammatory, Tissue-Resident Memory Phenotype and Function of Synovial Interleukin-17A+CD8+ T Cells in Psoriatic Arthritis

Kathryn J A Steel et al. Arthritis Rheumatol. 2020 Mar.

Abstract

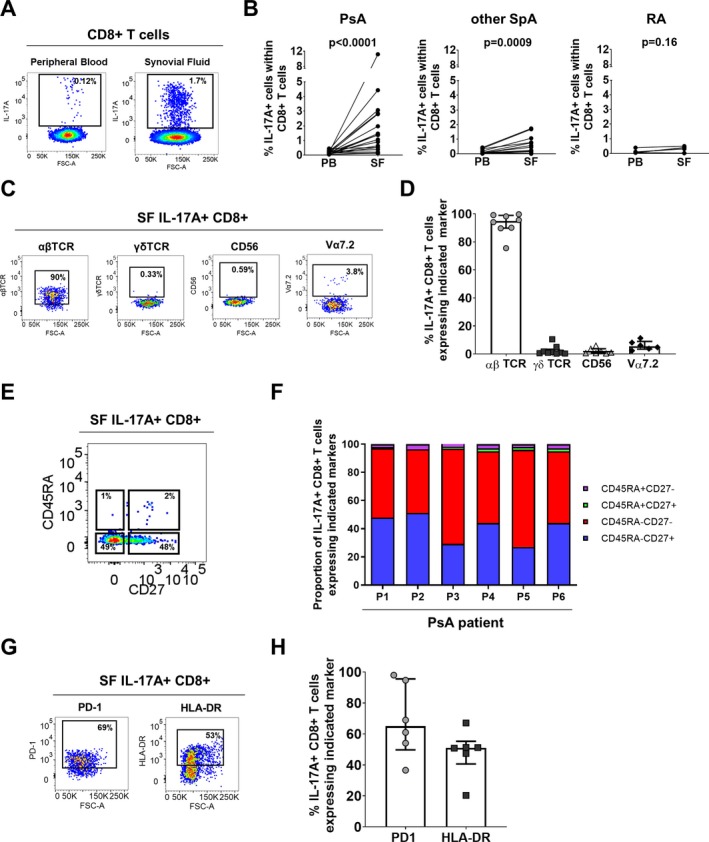
Objective: Genetic associations imply a role for CD8+ T cells and the interleukin-23 (IL-23)/IL-17 axis in psoriatic arthritis (PsA) and other spondyloarthritides (SpA). IL-17A+CD8+ (Tc17) T cells are enriched in the synovial fluid (SF) of patients with PsA, and IL-17A blockade is clinically efficacious in PsA/SpA. This study was undertaken to determine the immunophenotype, molecular profile, and function of synovial Tc17 cells in order to elucidate their role in PsA/SpA pathogenesis.

Methods: Peripheral blood (PB) and SF mononuclear cells were isolated from patients with PsA or other types of SpA. Cells were phenotypically, transcriptionally, and functionally analyzed by flow cytometry (n = 6-18), T cell receptor β (TCRβ) sequencing (n = 3), RNA-Seq (n = 3), quantitative reverse transcriptase-polymerase chain reaction (n = 4), and Luminex or enzyme-linked immunosorbent assay (n = 4-16).

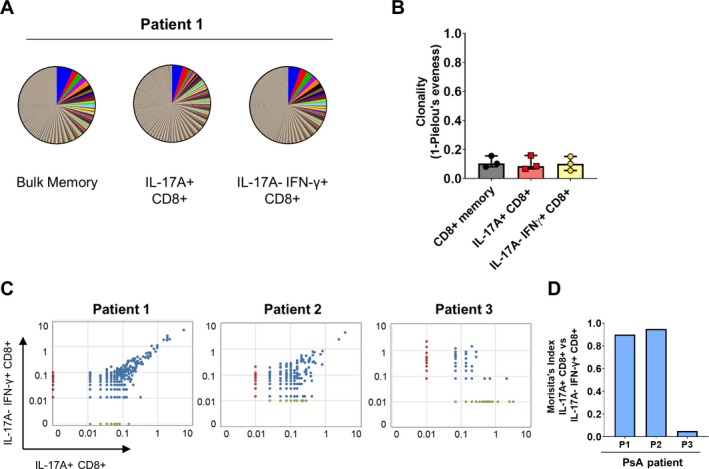
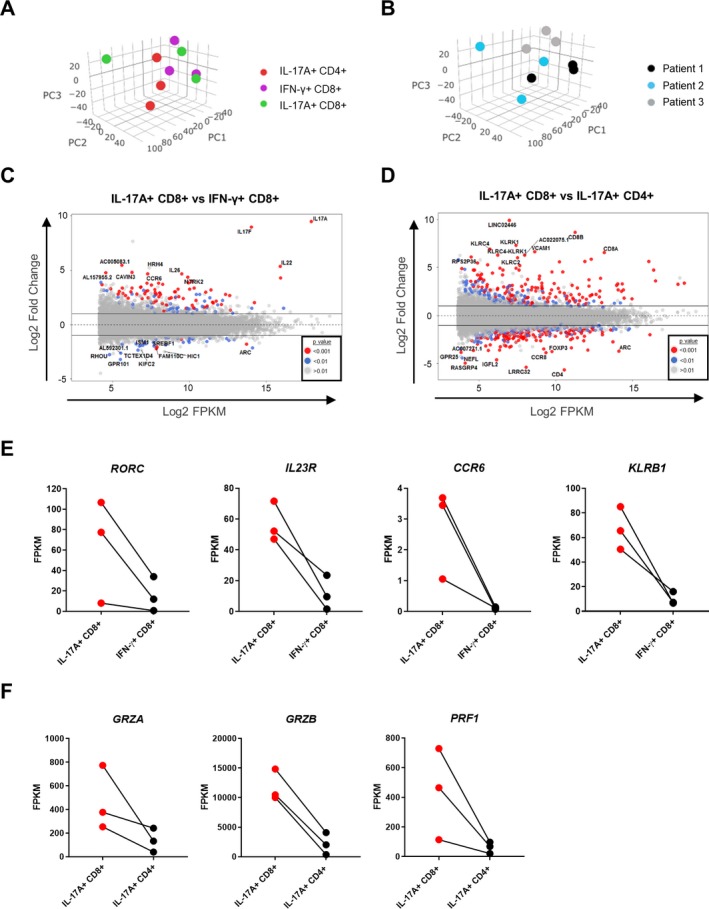
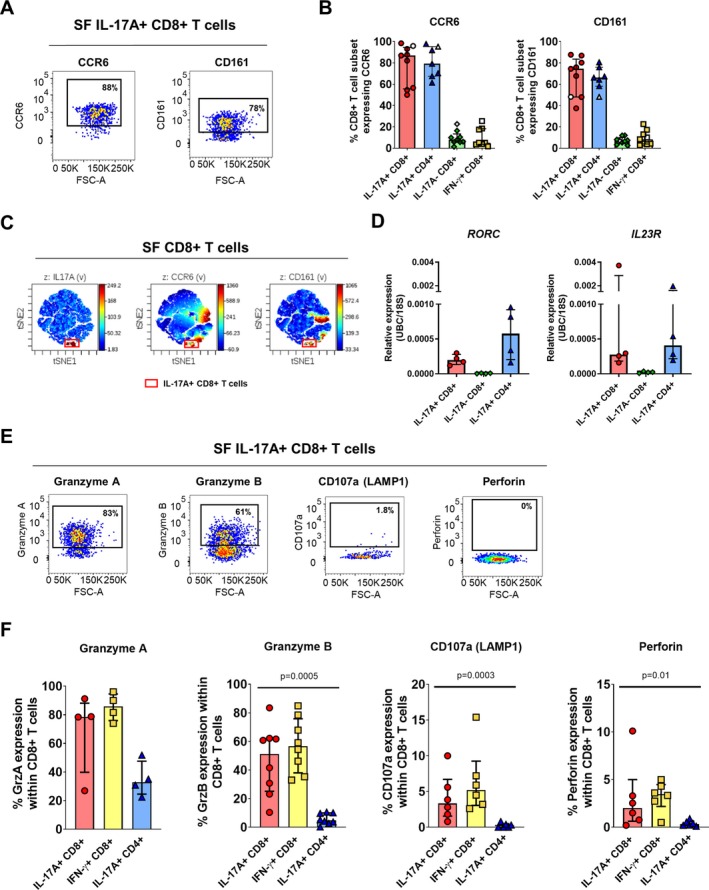
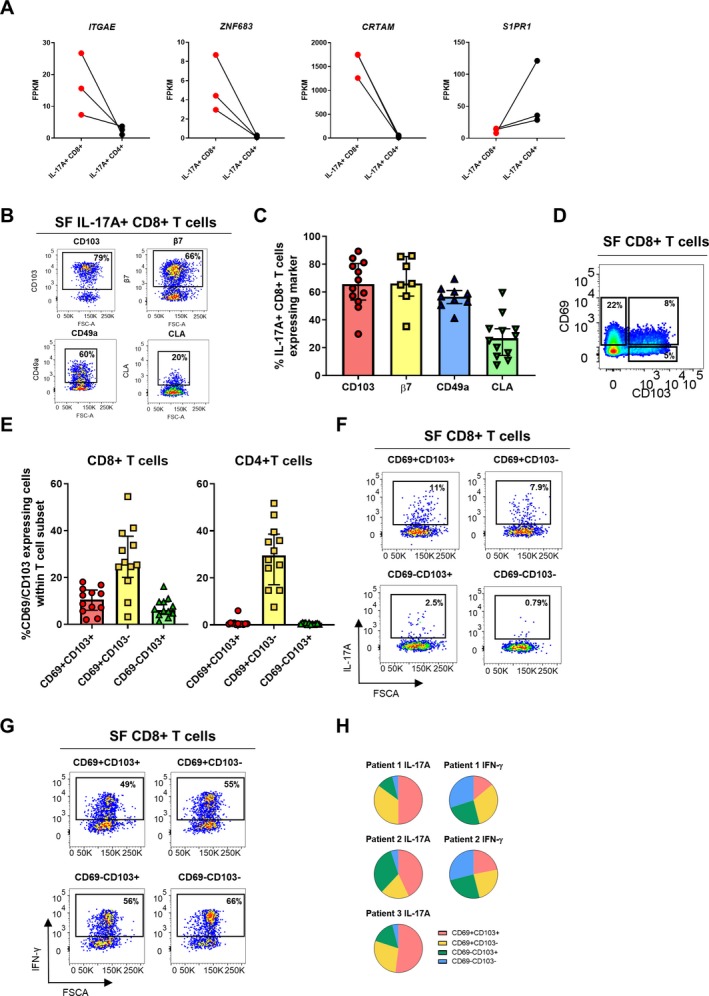
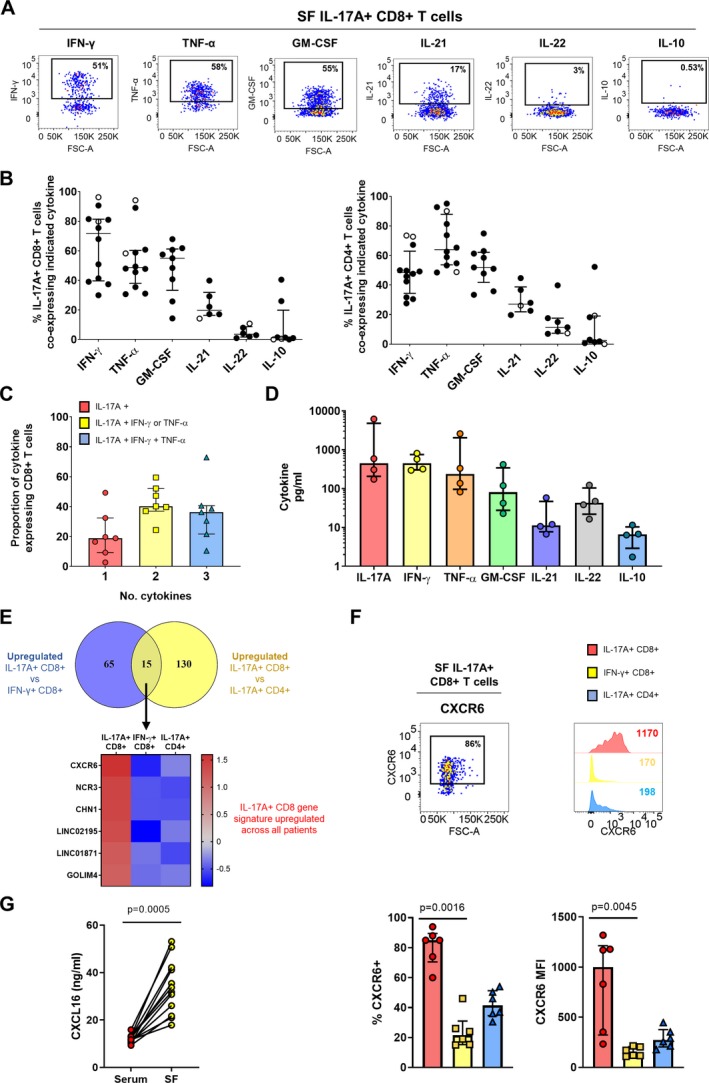
Results: IL-17A+CD8+ T cells were predominantly TCRαβ+ and their frequencies were increased in the SF versus the PB of patients with established PsA (P < 0.0001) or other SpA (P = 0.0009). TCRβ sequencing showed that these cells were polyclonal in PsA (median clonality 0.08), while RNA-Seq and deep immunophenotyping revealed that PsA synovial Tc17 cells had hallmarks of Th17 cells (RORC/IL23R/CCR6/CD161) and Tc1 cells (granzyme A/B). Synovial Tc17 cells showed a strong tissue-resident memory T (Trm) cell signature and secreted a range of proinflammatory cytokines. We identified CXCR6 as a marker for synovial Tc17 cells, and increased levels of CXCR6 ligand CXCL16 in PsA SF (P = 0.0005), which may contribute to their retention in the joint.

Conclusion: Our results identify synovial Tc17 cells as a polyclonal subset of Trm cells characterized by polyfunctional, proinflammatory mediator production and CXCR6 expression. The molecular signature and functional profiling of these cells may help explain how Tc17 cells can contribute to synovial inflammation and disease persistence in PsA and possibly other types of SpA.


Figures

Figure 1
Figure 1
Enrichment of T cells positive for interleukin‐17A (IL‐17A) and T cell receptor αβ (TCRαβ) in the synovial fluid (SF) of patients with spondyloarthritis (SpA). A and B, Representative staining (A) and cumulative data (B) showing the frequencies of IL‐17A+ cells among CD3+CD8+ T cells in paired peripheral blood mononuclear cells (PBMCs) and SF mononuclear cells (SFMCs) from patients with psoriatic arthritis (PsA; n = 18), other peripheral SpA (n = 14), or rheumatoid arthritis (RA; n = 6) after 3 hours of stimulation in the presence of phorbol myristate acetate, ionomycin, and GolgiStop. P values were determined by Wilcoxon's matched pairs signed rank test. C and D, Representative staining (C) and cumulative data (D) showing the frequencies of IL‐17A+CD8+ T cells expressing TCRαβ (n = 8), TCRγδ (n = 9), CD56 (n = 7), and Vα7.2 (n = 6) in PsA SF (stimulated as described in A and B). E and F, Representative staining (E) and frequencies (F) of IL‐17A+CD8+ T cells expressing CD45RA and/or CD27 in PsA SFMCs (n = 6) (stimulated as described in A and B). G and H, Representative staining (G) and cumulative data (H) showing the frequencies of IL‐17A+CD8+ T cells expressing programmed death 1 (PD‐1) or HLADR in PsA patients (n = 6). In D and H, symbols represent individual patients, bars show the median and interquartile range. Color figure can be viewed in the online issue, which is available at http://onlinelibrary.wiley.com/doi/10.1002/art.41156/abstract.
Figure 2
Figure 2
Diverse T cell receptor (TCR) repertoire in synovial Tc17 cells. A, Representative pie charts with segments representing the frequencies of all TCRβ sequences in bulk memory CD8+ T cells, CD8+ T cells positive for interleukin‐17A (IL‐17A), and CD8+ T cells negative for IL‐17A and positive for interferon‐γ (IFNγ) in a patient with psoriatic arthritis (PsA). B, Clonality score (defined as 1 − Pielou's evenness) for bulk memory CD8+, IL‐17A+CD8+, and IL‐17A−IFNγ+CD8+ T cells in PsA synovial fluid samples (n = 3). Symbols represent individual patients; bars show the median and interquartile range. C and D, Dot plots (C) and Morisita's index (D) showing the degree of clonal overlap between IL‐17A+CD8+ and IL‐17A−IFNγ+CD8+ T cells in 3 patients with PsA. Color figure can be viewed in the online issue, which is available at http://onlinelibrary.wiley.com/doi/10.1002/art.41156/abstract.
Figure 3
Figure 3
Transcriptional profile of synovial Tc17 cells compared to Tc1 cells and Th17 cells. A and B, Principal components analysis of the transcriptome of IL‐17A+CD8+, IFNγ+CD8+, and IL‐17A+CD4+ T cells from the synovial fluid of PsA patients (n = 3) by cell type (A) and by patient (B). C and D, MA plots showing genes that were significantly up‐regulated or down‐regulated in synovial IL‐17A+CD8+ T cells compared to IFNγ+CD8+ T cells or IL‐17A+CD4+ T cells (n = 3). E and F, Selected gene expression profiles shown as average gene expression values (fragments per kilobase million [FPKM]) in synovial IL‐17A+CD8+ compared to IFNγ+CD8+ T cells or CD4+IL‐17A+ T cells (n = 3). PC1 = principal component 1 (see Figure 2 for other definitions).
Figure 4
Figure 4
Synovial Tc17 cells have functional hallmarks of Th17 and Tc1 cells. A and B, Representative staining (A) and cumulative data (B) showing the frequencies of IL‐17A+CD8+, IL‐17A+CD4+, IL‐17A−CD8+, and IFNγ+CD8+ T cells expressing CCR6 and CD161 in synovial fluid mononuclear cells (SFMCs) from patients with PsA (solid symbols) and patients with other types of spondyloarthritis (open symbols) (n = 7–9). C, Representative viSNE plot showing concomitant expression of IL‐17A, CCR6, and CD161 among CD8+ T cells in PsA SFMCs. Representative results from 1 of 7 patients are shown. D, Gene expression levels of RORC and IL23R, normalized to the average values for UBC and 18S in sorted IL‐17A+CD8+, IL‐17A−CD8+, and IL‐17A+CD4+ T cells from PsA SFMCs (n = 4). E and F, Representative staining (E) and cumulative data (F) showing the frequencies of IL‐17A+CD8+, IFNγ+CD8+, and IL‐17A+CD4+ T cells expressing granzyme A (GrzA; n = 4), granzyme B (GrzB; n = 9), CD107a/lysosomal‐associated membrane protein 1 (LAMP‐1; n = 6), and perforin (n = 6) in PsA SFMCs. P values were determined by Friedman's multiple comparisons test. In B, D, and F, symbols represent individual patients; bars show the median and interquartile range. See Figure 2 for other definitions. Color figure can be viewed in the online issue, which is available at http://onlinelibrary.wiley.com/doi/10.1002/art.41156/abstract.
Figure 5
Figure 5
Synovial Tc17 cells form part of the synovial tissue‐resident T cell compartment. A, Selected tissue‐resident memory T (Trm) cell–associated gene expression profiles of sorted synovial IL‐17A+CD8+ T cells compared to IL‐17A+CD4+ T cells (n = 3). B and C, Representative staining (B) and cumulative data (C) showing the frequencies of IL‐17A+CD8+ T cells expressing CD103/αE integrin (n = 12), β7 integrin (n = 7), CD49a/very late activation antigen 1 (n = 9), or cutaneous lymphocyte antigen (CLA; n = 12) in PsA synovial fluid mononuclear cells (SFMCs), after 3 hours of stimulation in the presence of phorbol myristate acetate (PMA), ionomycin, and GolgiStop. D and E, Representative staining (D) and cumulative data (E) showing the frequencies of CD69+CD103+, CD69+CD103−, and CD69−CD103+ Trm cells among synovial CD3+CD8+ and CD3+CD4+ T cells (n = 12). F–H, PsA SF cells (n = 3) were sorted into CD69+CD103+, CD69+CD103−, CD69−CD103+, and CD69−CD103− CD8+ T cells. Sorted subsets were stimulated with PMA and ionomycin in the presence of GolgiStop for 3 hours. F and G, Representative staining showing IL‐17A (F) and IFNγ (G) expression within the 4 sorted subsets. H, Proportion of IL‐17A+ cells (left; n = 3) and IFNγ+ cells (right; n = 2) in each Trm subset, as a fraction of total IL‐17A–expressing or IFNγ‐expressing cells. In C and E, symbols represent individual patients; bars show the median and interquartile range. FPKM = fragments per kilobase million (see Figure 2 for other definitions). Color figure can be viewed in the online issue, which is available at http://onlinelibrary.wiley.com/doi/10.1002/art.41156/abstract.
Figure 6
Figure 6
Synovial Tc17 cells are polyfunctional proinflammatory cells characterized by high expression of CXCR6. A and B, Representative staining (A) and cumulative data (B) showing the frequencies of IL‐17A+CD8+ (left) and IL‐17A+CD4+ (right) T cells expressing IFNγ (n = 12), tumor necrosis factor (TNF; n = 12), granulocyte–macrophage colony‐stimulating factor (GMCSF; n = 9), IL‐21 (n = 6), IL‐22 (n = 6), and IL‐10 (n = 8) in synovial fluid mononuclear cells (SFMCs) from patients with PsA (solid symbols) or other types of spondyloarthritis (open symbols). C, Proportion of IL‐17A+CD8+ T cells expressing IL‐17A alone, IL‐17A plus IFNγ or TNF, and IL‐17A plus IFNγ and TNF. D, IL‐17A, IFNγ, TNF, GMCSF, IL‐21, IL‐22, and IL‐10 secretion by sorted synovial IL‐17A+CD8+ T cells (n = 4). E, Top, Venn diagram showing the number of significantly up‐regulated genes (P < 0.01) in IL‐17A+CD8+ T cells versus IFNγ+CD8+ T cells and in IL‐17A+CD8+ T cells versus IL‐17A+CD4+ T cells. Bottom, Heatmap showing genes that were consistently up‐regulated in all patients. F, Representative dot plot and histograms (top) and cumulative data (bottom) showing the percentage of CXCR6+ cells and CXCR6 expression levels in PsA synovial IL‐17A+CD8+ T cells, IFNγ+CD8+ T cells, and IL‐17A+CD4+T cells (n = 6). P values were determined by Friedman's multiple comparisons test. G, CXCL16 levels in paired PsA serum and SF samples (n = 12) as measured by enzyme‐linked immunosorbent assay. P value was determined by Wilcoxon's matched pairs signed rank test. In C and D, bars show the median and interquartile range. MFI = mean fluorescence intensity (see Figure 2 for other definitions). Color figure can be viewed in the online issue, which is available at http://onlinelibrary.wiley.com/doi/10.1002/art.41156/abstract.

References

    1. Stolwijk C, Boonen A, van Tubergen A, Reveille JD. Epidemiology of spondyloarthritis. Rheum Dis Clin North Am 2012;38:441–76. - PMC - PubMed
    1. Taams LS, Steel KJ, Srenathan U, Burns LA, Kirkham BW. IL‐17 in the immunopathogenesis of spondyloarthritis. Nat Rev Rheumatol 2018;14:453–66. - PubMed
    1. Gravallese EM, Schett G. Effects of the IL‐23‐IL‐17 pathway on bone in spondyloarthritis. Nat Rev Rheumatol 2018;14:631–40. - PubMed
    1. Mease PJ, McInnes IB, Kirkham B, Kavanaugh A, Rahman P, van der Heijde D, et al. Secukinumab inhibition of interleukin‐17A in patients with psoriatic arthritis. N Engl J Med 2015;373:1329–39. - PubMed
    1. Baeten D, Sieper J, Braun J, Baraliakos X, Dougados M, Emery P, et al. Secukinumab, an interleukin‐17A inhibitor, in ankylosing spondylitis. N Engl J Med 2015;373:2534–48. - PubMed

Publication types