. 2020 Jan;20(1):37-59.
doi: 10.1016/S1473-3099(19)30401-3. Epub 2019 Oct 31.

Quantifying risks and interventions that have affected the burden of diarrhoea among children younger than 5 years: an analysis of the Global Burden of Disease Study 2017

Collaborators

Quantifying risks and interventions that have affected the burden of diarrhoea among children younger than 5 years: an analysis of the Global Burden of Disease Study 2017

GBD 2017 Diarrhoeal Disease Collaborators. Lancet Infect Dis. 2020 Jan.

Abstract

Background: Many countries have shown marked declines in diarrhoeal disease mortality among children younger than 5 years. With this analysis, we provide updated results on diarrhoeal disease mortality among children younger than 5 years from the Global Burden of Diseases, Injuries, and Risk Factors Study 2017 (GBD 2017) and use the study's comparative risk assessment to quantify trends and effects of risk factors, interventions, and broader sociodemographic development on mortality changes in 195 countries and territories from 1990 to 2017.

Methods: This analysis for GBD 2017 had three main components. Diarrhoea mortality was modelled using vital registration data, demographic surveillance data, and verbal autopsy data in a predictive, Bayesian, ensemble modelling tool; and the attribution of risk factors and interventions for diarrhoea were modelled in a counterfactual framework that combines modelled population-level prevalence of the exposure to each risk or intervention with the relative risk of diarrhoea given exposure to that factor. We assessed the relative and absolute change in diarrhoea mortality rate between 1990 and 2017, and used the change in risk factor exposure and sociodemographic status to explain differences in the trends of diarrhoea mortality among children younger than 5 years.

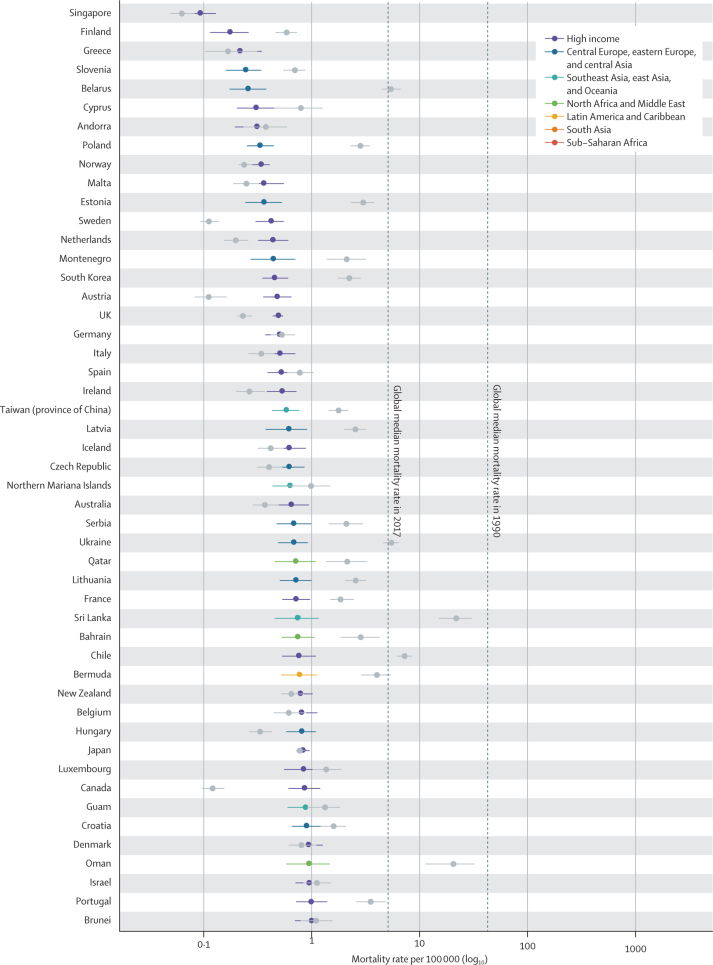
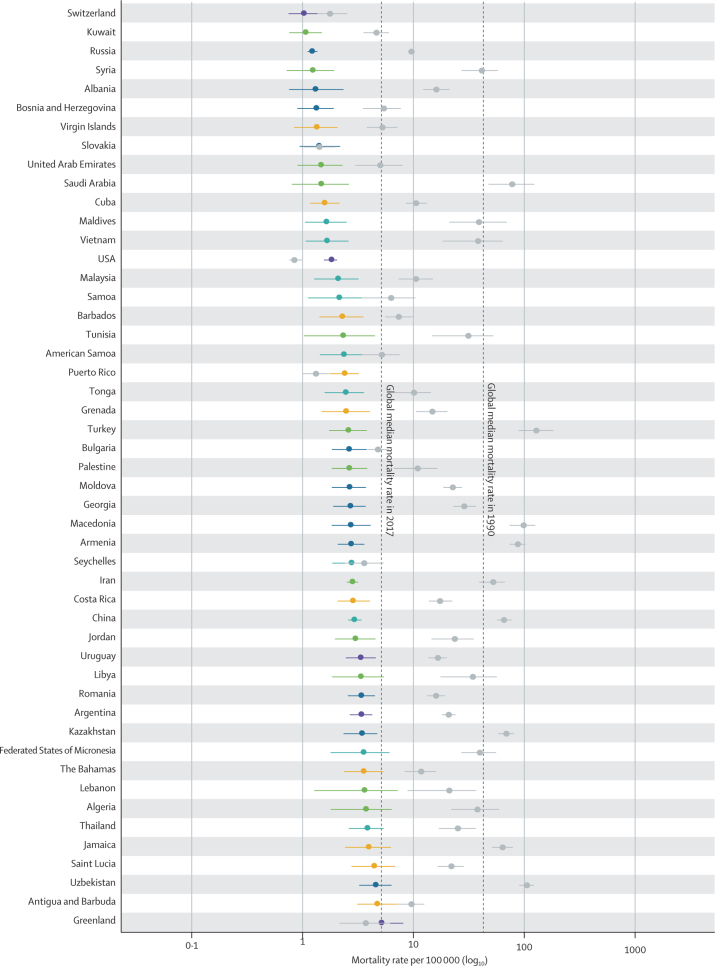
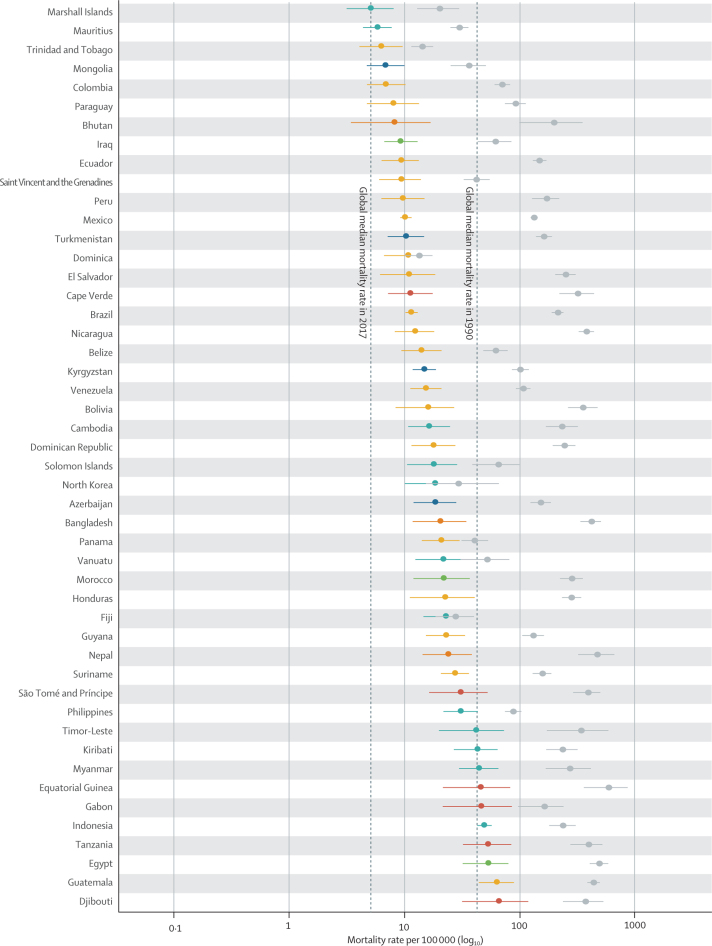
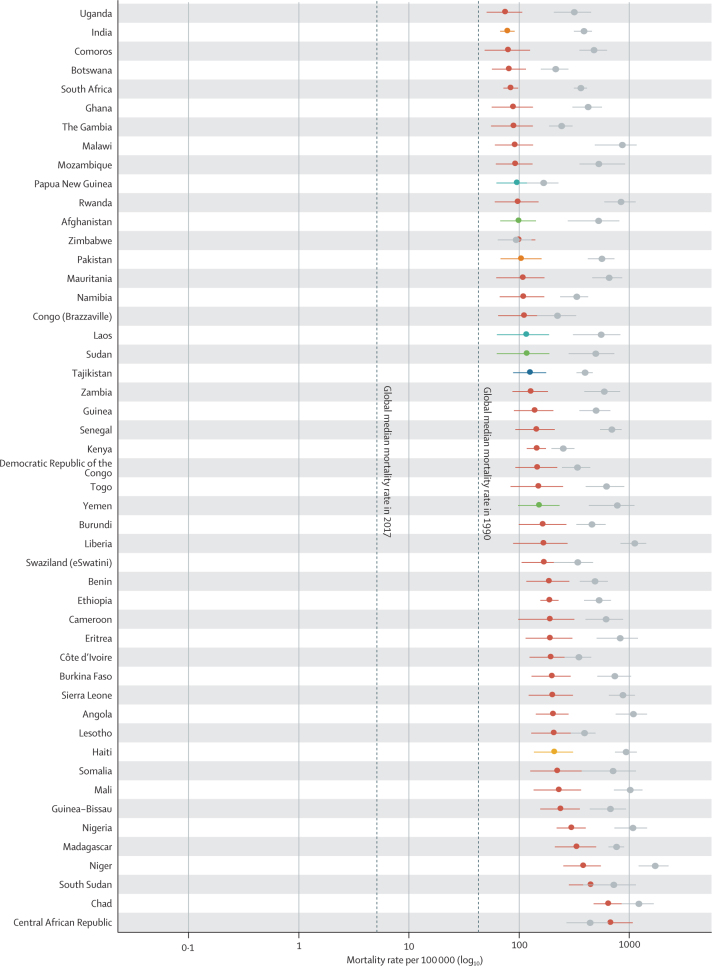
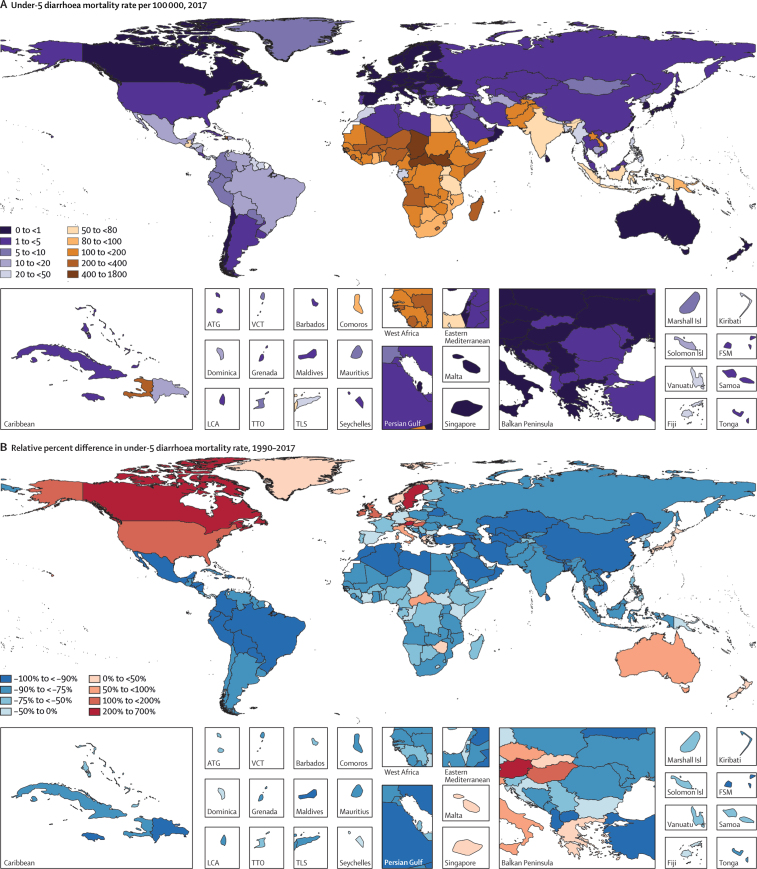
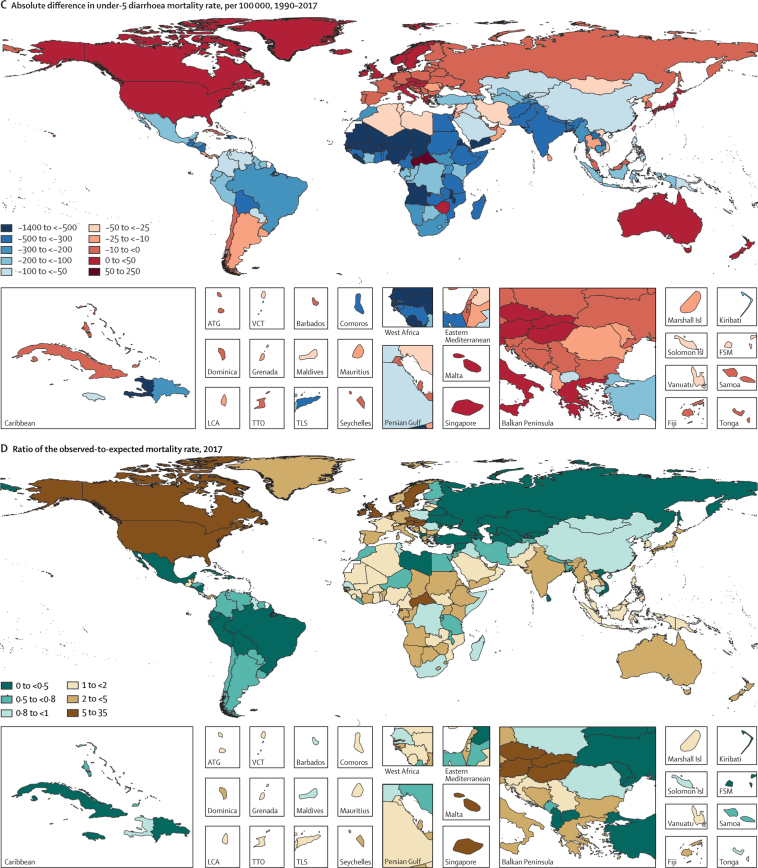
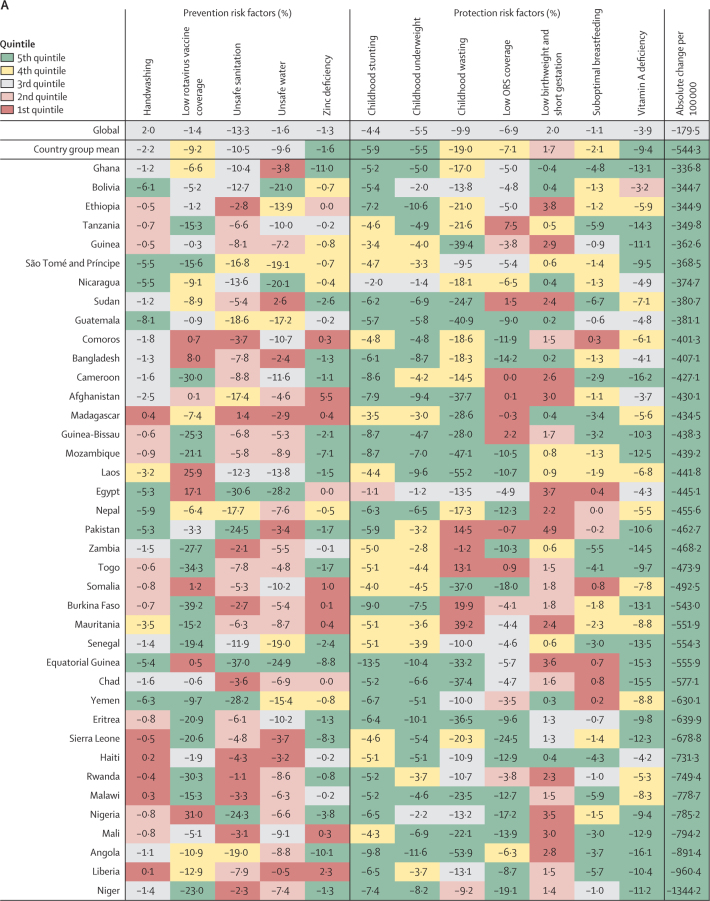
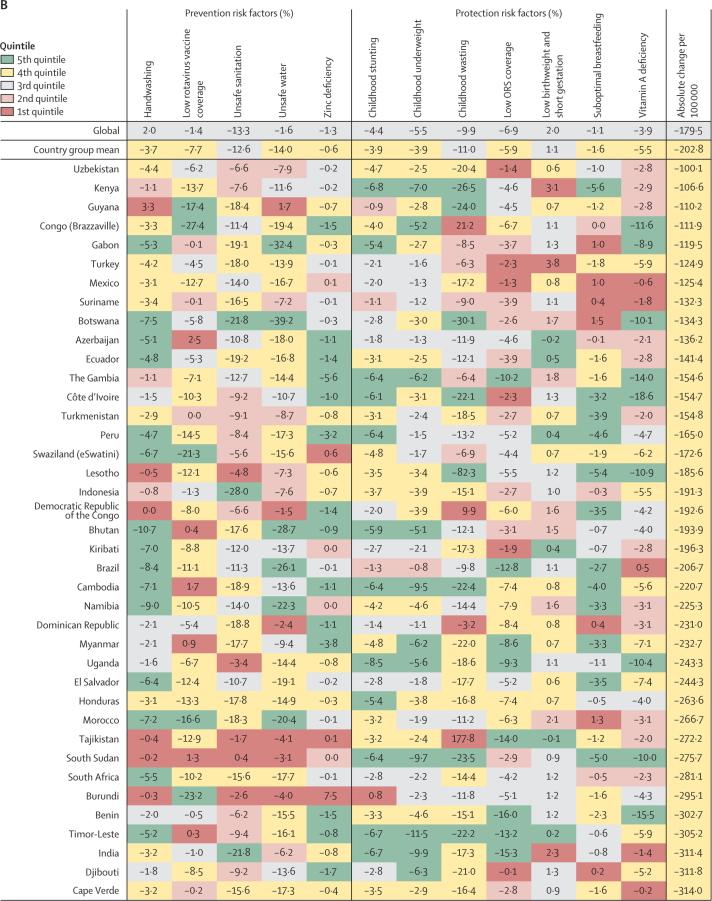
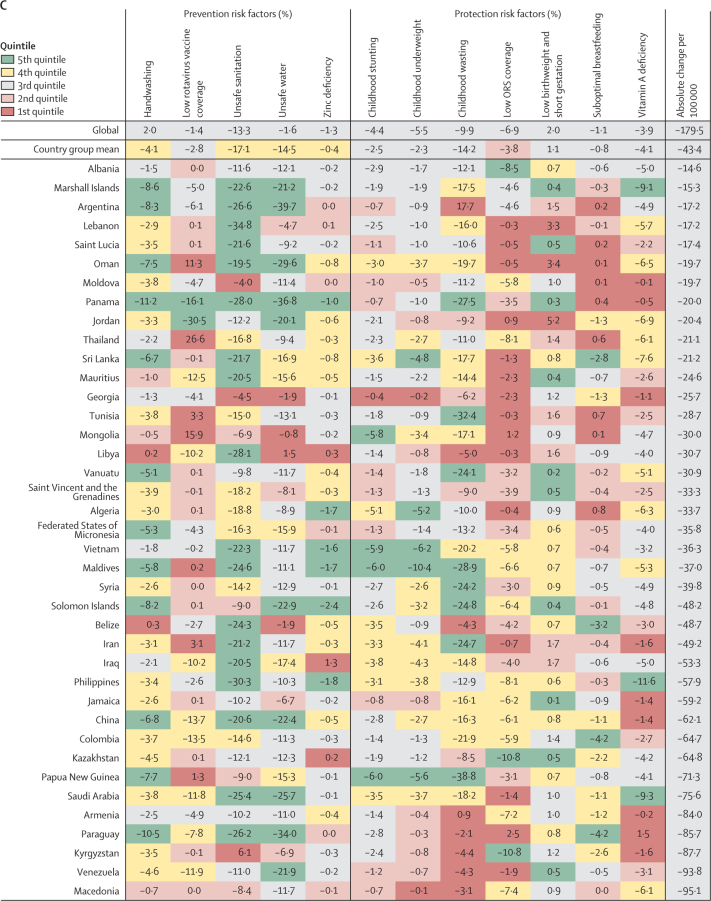
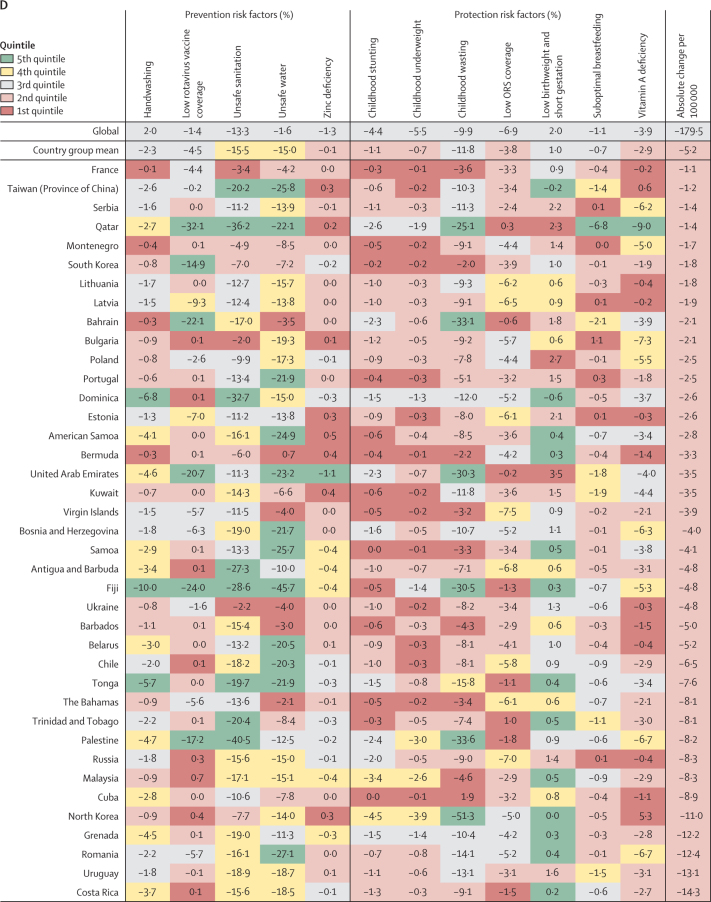
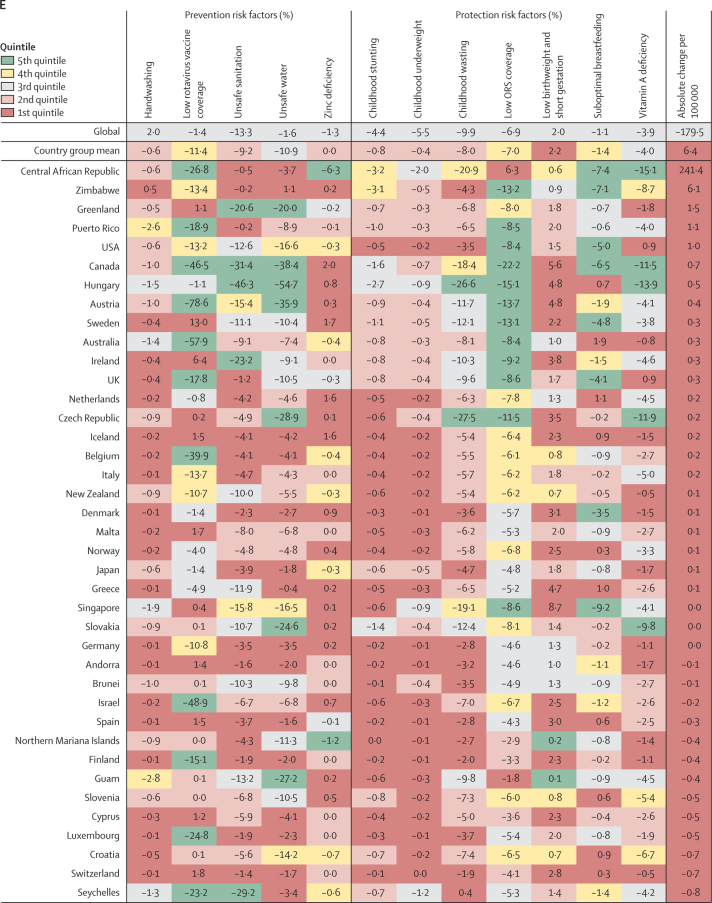
Findings: Diarrhoea was responsible for an estimated 533 768 deaths (95% uncertainty interval 477 162-593 145) among children younger than 5 years globally in 2017, a rate of 78·4 deaths (70·1-87·1) per 100 000 children. The diarrhoea mortality rate ranged between countries by over 685 deaths per 100 000 children. Diarrhoea mortality per 100 000 globally decreased by 69·6% (63·1-74·6) between 1990 and 2017. Among the risk factors considered in this study, those responsible for the largest declines in the diarrhoea mortality rate were reduction in exposure to unsafe sanitation (13·3% decrease, 11·2-15·5), childhood wasting (9·9% decrease, 9·6-10·2), and low use of oral rehydration solution (6·9% decrease, 4·8-8·4).

Interpretation: Diarrhoea mortality has declined substantially since 1990, although there are variations by country. Improvements in sociodemographic indicators might explain some of these trends, but changes in exposure to risk factors-particularly unsafe sanitation, childhood growth failure, and low use of oral rehydration solution-appear to be related to the relative and absolute rates of decline in diarrhoea mortality. Although the most effective interventions might vary by country or region, identifying and scaling up the interventions aimed at preventing and protecting against diarrhoea that have already reduced diarrhoea mortality could further avert many thousands of deaths due to this illness.

Funding: Bill & Melinda Gates Foundation.


Figures

Figure 1
Figure 1
The diarrhoea mortality rate among children younger than 5 years by country, 1990 and 2017 Data are under-5 diarrhoea mortality rate (95% uncertainty interval) in 1990 (gray points) and in 2017 (coloured points). The colours indicate the Global Burden of Diseases, Injuries, and Risk Factors Study super region. Countries are ordered by increasing mortality rate in 2017.
Figure 1
Figure 1
The diarrhoea mortality rate among children younger than 5 years by country, 1990 and 2017 Data are under-5 diarrhoea mortality rate (95% uncertainty interval) in 1990 (gray points) and in 2017 (coloured points). The colours indicate the Global Burden of Diseases, Injuries, and Risk Factors Study super region. Countries are ordered by increasing mortality rate in 2017.
Figure 2
Figure 2
Maps of diarrhoea mortality rate per 100 000 among children younger than 5 years, 1990–2017 (A) Diarrhoea mortality rate per 100 000 children younger than 5 years in 2017. (B) Relative percent difference and (C) absolute difference in diarrhoea mortality rate among children younger than 5 years between 2017 and 1990. (D) Ratio of observed-to-predicted diarrhoea mortality rate per 100 000 (predicted on the basis of the observed change in SDI between 1990 and 2017) in 2017. ATG=Antigua and Barbuda. FSM=Federated States of Micronesia. Isl=Islands. LCA=Saint Lucia. SDI=Socio-demographic Index. TLS=Timor-Leste. TTO=Trinidad and Tobago. VCT=Saint Vincent and the Grenadines.
Figure 2
Figure 2
Maps of diarrhoea mortality rate per 100 000 among children younger than 5 years, 1990–2017 (A) Diarrhoea mortality rate per 100 000 children younger than 5 years in 2017. (B) Relative percent difference and (C) absolute difference in diarrhoea mortality rate among children younger than 5 years between 2017 and 1990. (D) Ratio of observed-to-predicted diarrhoea mortality rate per 100 000 (predicted on the basis of the observed change in SDI between 1990 and 2017) in 2017. ATG=Antigua and Barbuda. FSM=Federated States of Micronesia. Isl=Islands. LCA=Saint Lucia. SDI=Socio-demographic Index. TLS=Timor-Leste. TTO=Trinidad and Tobago. VCT=Saint Vincent and the Grenadines.
Figure 3
Figure 3
Aggregated attributable fractions for diarrhoeal risk factors among children younger than 5 years by GBD super-region, 2017 In the comparative risk factors framework used in GBD 2017, risk factors are counterfactual and can overlap such that a single risk might be sufficient, but is not necessary, to cause a diarrhoea death. Therefore, although the total risk attribution cannot exceed 1, there could be overlap between the risk factors associated with rotavirus vaccine coverage, ORS treatment, nutrition, or WASH at the population level, such that eliminating exposure to one would avert a diarrhoea death. ORS=oral rehydration solution. WASH=water, sanitation, and hygiene.
Figure 4
Figure 4
Percent change in the diarrhoea mortality rate attributable to changes in risk factor exposure by country, grouped in quintiles of the absolute attributable change in mortality rate, 1990–2017 Data are percent reduction in diarrhoea mortality rate between 1990 and 2017 attributable to changes in exposure to each risk factor. The first row represents the value among all countries and the second row represents the mean value among countries in each country group: (A) 5th, (B) 4th, (C) 3rd, (D) 2nd, and (E) 1st quintile of the absolute attributable change in mortality rate between 1990 and 2017. The colours of the tiles indicate the quintile for the attributable change in mortality due to each risk factor among all countries. ORS=oral rehydration solution.
Figure 4
Figure 4
Percent change in the diarrhoea mortality rate attributable to changes in risk factor exposure by country, grouped in quintiles of the absolute attributable change in mortality rate, 1990–2017 Data are percent reduction in diarrhoea mortality rate between 1990 and 2017 attributable to changes in exposure to each risk factor. The first row represents the value among all countries and the second row represents the mean value among countries in each country group: (A) 5th, (B) 4th, (C) 3rd, (D) 2nd, and (E) 1st quintile of the absolute attributable change in mortality rate between 1990 and 2017. The colours of the tiles indicate the quintile for the attributable change in mortality due to each risk factor among all countries. ORS=oral rehydration solution.

Comment in

References

    1. GBD 2017 Causes of Death Collaborators Global, regional, and national age-sex-specific mortality for 282 causes of death in 195 countries and territories, 1980–2017: a systematic analysis for the Global Burden of Disease Study 2017. Lancet. 2018;392:1736–1788. - PMC - PubMed
    1. GBD Diarrhoeal Diseases Collaborators Estimates of global, regional, and national morbidity, mortality, and aetiologies of diarrhoeal diseases: a systematic analysis for the Global Burden of Disease Study 2015. Lancet Infect Dis. 2017;17:909–948. - PMC - PubMed
    1. GBD 2016 Diarrhoeal Disease Collaborators Estimates of the global, regional, and national morbidity, mortality, and aetiologies of diarrhoea in 195 countries: a systematic analysis for the Global Burden of Disease Study 2016. Lancet Infect Dis. 2018;18:1211–1228. - PMC - PubMed
    1. Golding N, Burstein R, Longbottom J. Mapping under-5 and neonatal mortality in Africa, 2000–15: a baseline analysis for the Sustainable Development Goals. Lancet. 2017;390:2171–2182. - PMC - PubMed
    1. Reiner RC, Jr, Graetz N, Casey DC. Variation in childhood diarrheal morbidity and mortality in Africa, 2000–2015. N Engl J Med. 2018;379:1128–1138. - PMC - PubMed

Publication types