. 2020 Feb:210:48-58.
doi: 10.1016/j.ajo.2019.10.022. Epub 2019 Nov 1.

Diagnostic Performance of Three-Dimensional Endothelium/Descemet Membrane Complex Thickness Maps in Active Corneal Graft Rejection

Affiliations

Diagnostic Performance of Three-Dimensional Endothelium/Descemet Membrane Complex Thickness Maps in Active Corneal Graft Rejection

Taher K Eleiwa et al. Am J Ophthalmol. 2020 Feb.

Abstract

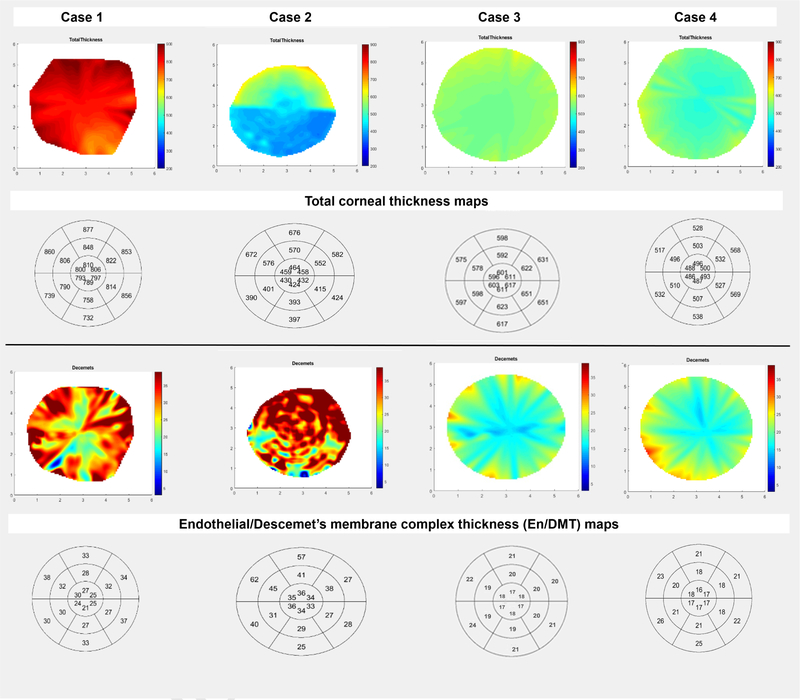
Purpose: To evaluate the performance of 3-dimensional (3D) endothelium/Descemet membrane complex thickness (En/DMT) maps vs total corneal thickness (TCT) maps in the diagnosis of active corneal graft rejection.

Design: Cross-sectional study.

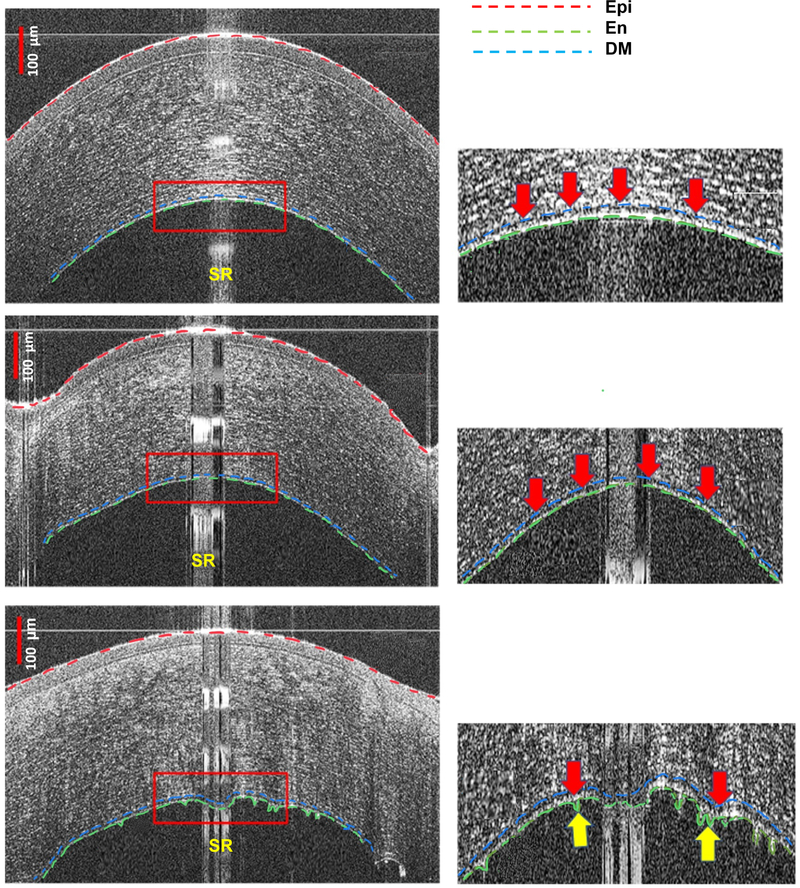
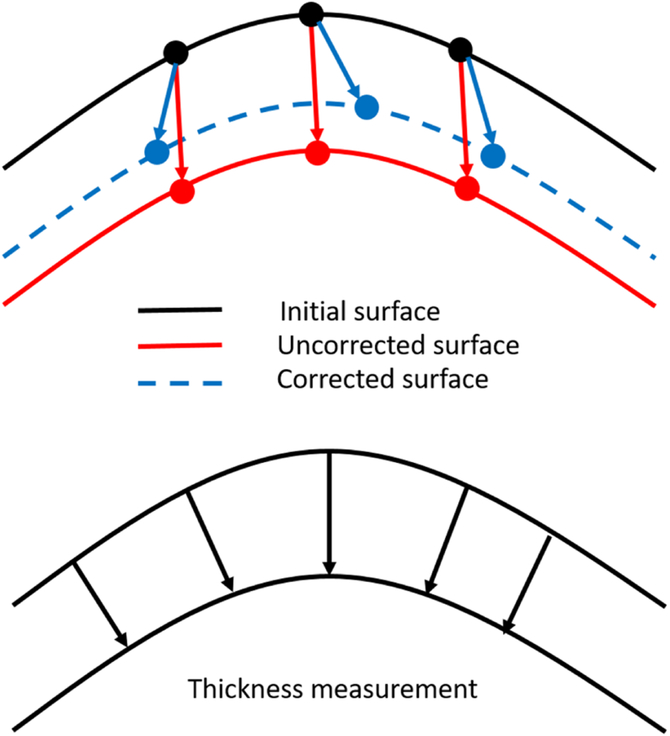
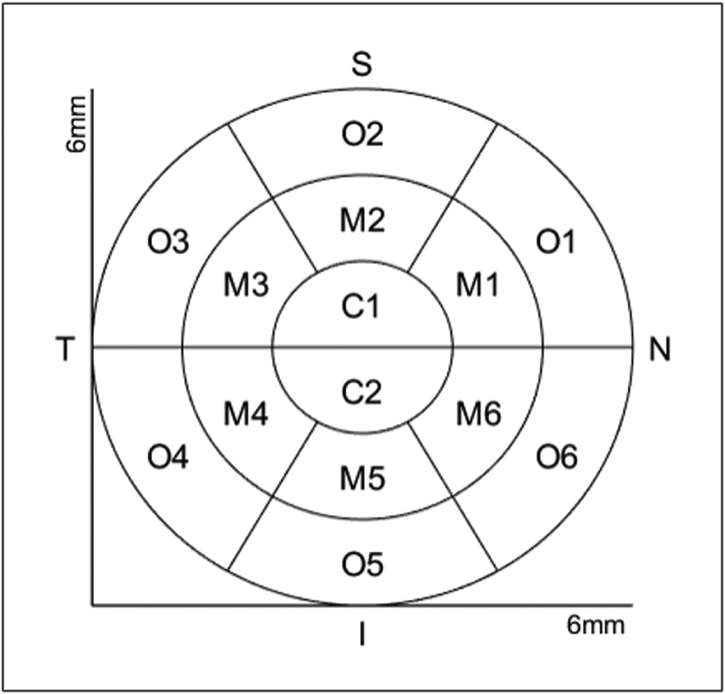
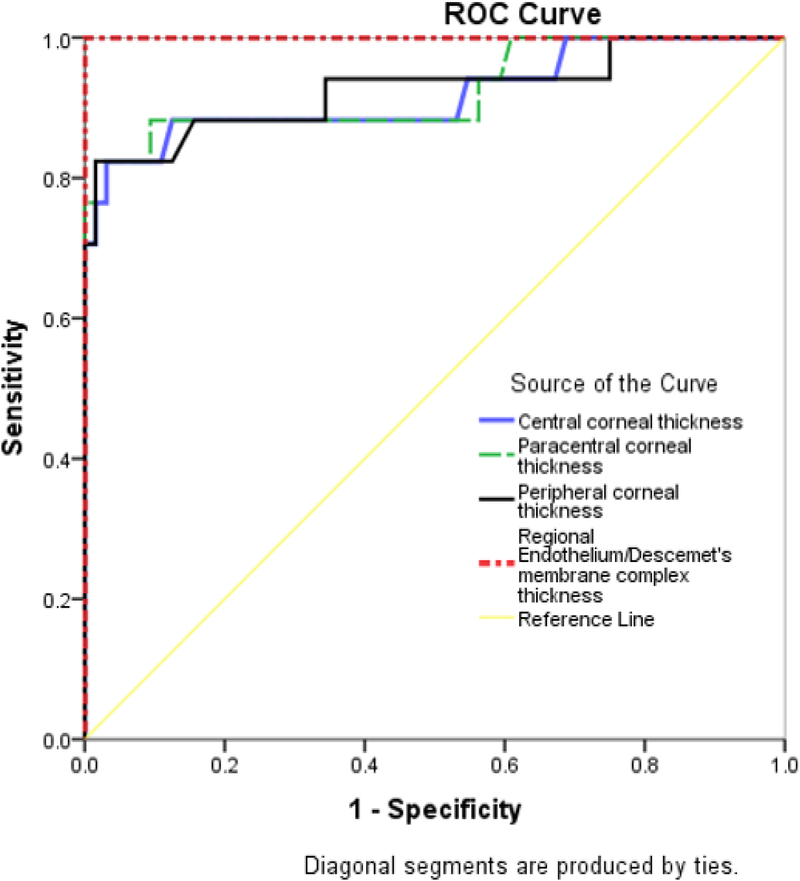
Methods: Eighty-one eyes (32 clear grafts and 17 with active rejection, along with 32 age-matched control eyes) were imaged using high-definition optical coherence tomography (HD-OCT), and a custom-built segmentation algorithm was used to generate 3D color-coded maps of TCT and En/DMT of the central 6-mm cornea. Regional En/DMT and TCT were analyzed and compared between the studied groups. Receiver operating characteristic curves were used to determine the accuracy of En/DMT and TCT maps in differentiating between studied groups. Main outcome measures were regional En/DMT and TCT.

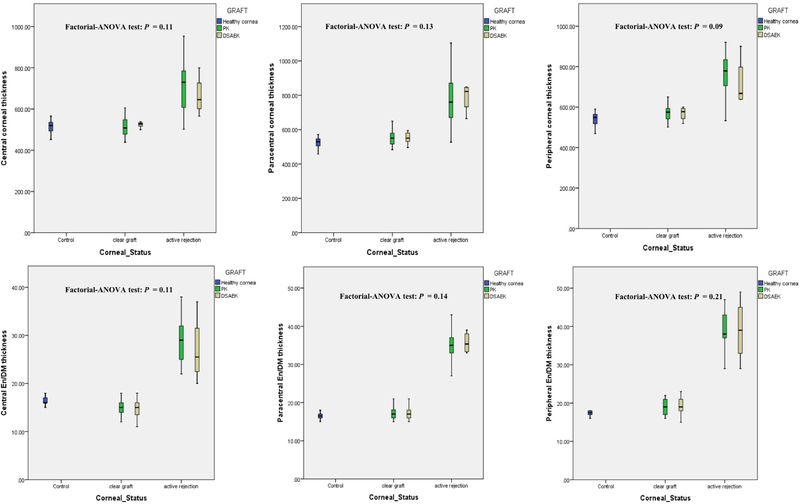
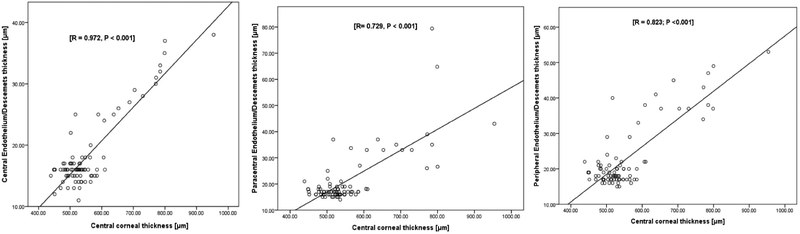
Results: Both regional TCT and En/DMT were significantly greater in actively rejecting grafts compared to both healthy corneas and clear grafts (P < .001). Using 3D thickness maps, central, paracentral, and peripheral En/DMT achieved 100% sensitivity and 100% specificity in diagnosing actively rejecting grafts (optimal cut-off value [OCV] of 19 μm, 24 μm, and 26 μm, respectively), vs only 82% sensitivity and 96% specificity for central TCT, OCV of 587 μm. Moreover, central, paracentral, and peripheral En/DMT correlated significantly with graft rejection severity (r = 0.972, r = 0.729, and r = 0.823, respectively; P < .001).

Conclusion: 3D En/DMT maps can diagnose active corneal graft rejection with excellent accuracy, sensitivity, and specificity. Future longitudinal studies are required to evaluate the predictive and prognostic role of 3D En/DMT maps in corneal graft rejection.


Figures

Figure 1:
Figure 1:
High-definition optical coherence tomography (HD-OCT) images of a healthy unoperated cornea (First row, left), clear corneal graft (Second row, left) and an actively rejecting graft (Third row, left). Presets (Right column) show magnified images of the posterior part of the corresponding cornea on the left. The red dashed line represents the anterior boundary of the corneal epithelium (Epi), the green dashed line indicates the corneal endothelium (En), and the blue dashed line for Descemet’s membrane (DM). In the presets, the thick arrows indicate the segmentation of the endothelium/Descemet’s membrane complex (En/DM). Endothelium/Descemet’s membrane complex thickness (En/DMT) is measured as the inter-surface distance between the segmented En and DM layers. The specular reflection (SR) confirmed optimal centration, however, the segmentation method is robust, as each boundary is fitted to a polynomial model, and thus does not get affected that much. In both healthy corneas and clear grafts, corneal En and DM were visualized as a band formed by 2 smooth hyper-reflective lines with a translucent space in between (First and second rows, right). In actively rejecting grafts (third row), En/DM appeared as a thickened band bounded by 2 hyper-reflective lines. The anterior line and the translucent space in between the lines were like those of the healthy corneas and clear grafts, while the posterior line had a broader hyper-reflectivity (third row, right) and occasional nodular excrescences (third row, right, yellow arrows). Bars are 100 μm.
Figure 2-a:
Figure 2-a:
A diagram showing the concept of thickness measurement using three-dimensional ray tracing. The axial distances between the uncorrected surfaces (red arrows) represent the optical path length and it is converted to geometric distance (blue arrows) using the layer refractive index. Three-dimensional ray tracing is applied iteratively at each surface to correct for the refraction in the OCT imaging light by applying the vector form of Snell’s law at the refractive interface between each 2 successive layers. Then, the thickness is measured as the shortest distance (black arrows) between each consecutive surfaces.
Figure 2-b:
Figure 2-b:
The scheme of arrangement of the corneal regions for quantitative evaluation of the layer thickness: Central region (C1, C2) lies within a 1 mm radius, surrounded by 2 concentric paracentral (M1, M2, M3, M4, M5, M6) and outer (O1, O2, O3, O4, O5, O6) rings, each with a 2 mm width. N: Nasal; S: Superior; T: Temporal; I: Inferior.
Figure 3:
Figure 3:
Box-plot distributions showing that there was no statistically significant effect of the type of graft-Penetrating keratoplasty (PK) versus Descemet Stripping Automated Endothelial Keratoplasty (DSAEK)-on the changes in the mean central, paracentral and peripheral total corneal thickness (upper raw), and central, paracentral and peripheral endothelium/Descemet’s membrane complex (En/DM) thickness (lower raw) values between the studied groups.
Figure 4:
Figure 4:
Graph showing the discrimination between two actively rejecting corneal grafts (case 1 and case 2), a clear corneal graft (case 3) and healthy unoperated cornea (case 4) using color-coded and bulls-eye three-dimensional thickness maps of the total corneal thickness (TCT, 1st and 2nd raws) and endothelial/Descemet’s membrane complex thickness (En/DMT, 3rd and 4th raws). En/DMT was higher in case 1 and 2 compared to case 3 and 4. Interestingly, case 2 showed an active rejection in a thin corneal graft with high En/DMT compared to a healthy thicker graft (case 3) with normal En/DMT. Note the striking difference between the presented cases using the self-explanatory color-coded En/DMT maps.
Figure 5:
Figure 5:
Combined receiver operating characteristics (ROC) graphs of central, paracentral and peripheral corneal thickness; regional endothelial/Descemet’s membrane complex thickness (En/DMT) in differentiating clear corneas from actively rejecting grafts. Regional En/DMT provided excellent discrimination (area under the curve, AUC, 1), whereas the central, paracentral and peripheral corneal thickness achieved an AUC of 0.922, 0.926 and 0.926, respectively.
Figure 6:
Figure 6:
Scatter plots showing a significant linear correlation between central corneal thickness and regional endothelial/Descemet’s membrane complex thickness (En/DMT) values in actively rejecting grafts.

References

    1. Gain P, Jullienne R, He Z et al. Global Survey of Corneal Transplantation and Eye Banking. JAMA Ophthalmol 2016; 134(2):167–173. - PubMed
    1. Wilson SE, Kaufman HE, Graft failure after penetrating keratoplasty. Surv Ophthalmol 1990; 34(5): 325–356. - PubMed
    1. Musch DC, Schwartz AE, Fitzgerald-Shelton K, Sugar A, Meyer RF. The effect of allograft rejection after penetrating keratoplasty on central endothelial cell density. 1991; 111(6): 739–742. - PubMed
    1. Alldredge OC, Krachmer JH. Clinical types of corneal transplant rejection. Their manifestations, frequency, preoperative correlates, and treatment. Arch Ophthalmol 1981; 99(4): 599–604. - PubMed
    1. Williams KA, Muehlberg SM, Lewis RF et al. How successful is corneal transplantation? A report from the Australian Corneal Graft Register. Eye 1995; 9 (2): 219–227. - PubMed

Publication types