. 2019 Nov 18;29(22):3749-3765.e7.
doi: 10.1016/j.cub.2019.09.006. Epub 2019 Oct 31.

Meiotic Kinetochores Fragment into Multiple Lobes upon Cohesin Loss in Aging Eggs

Affiliations

Meiotic Kinetochores Fragment into Multiple Lobes upon Cohesin Loss in Aging Eggs

Agata P Zielinska et al. Curr Biol. .

Abstract

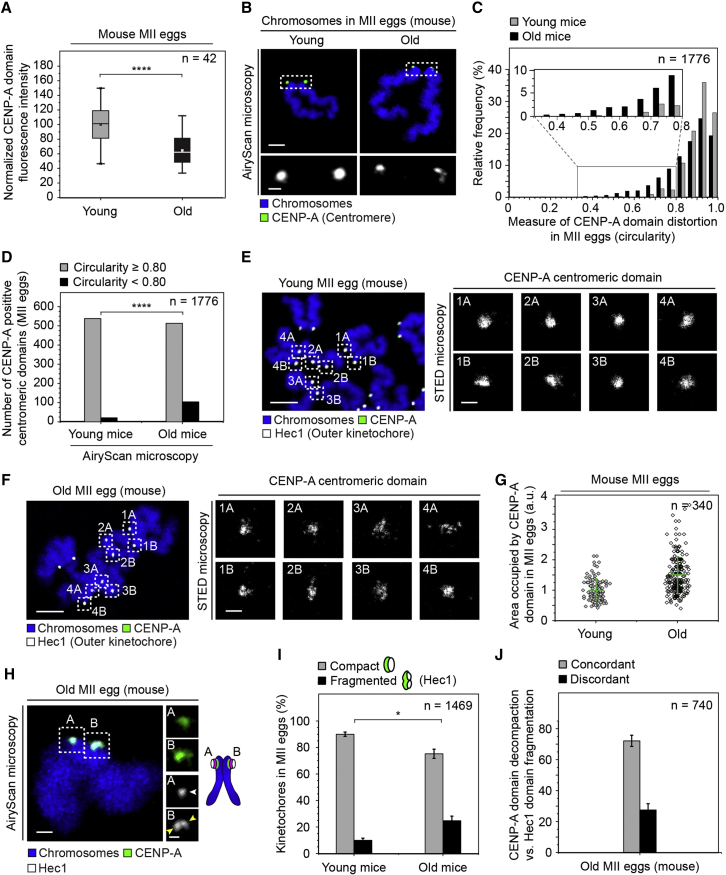
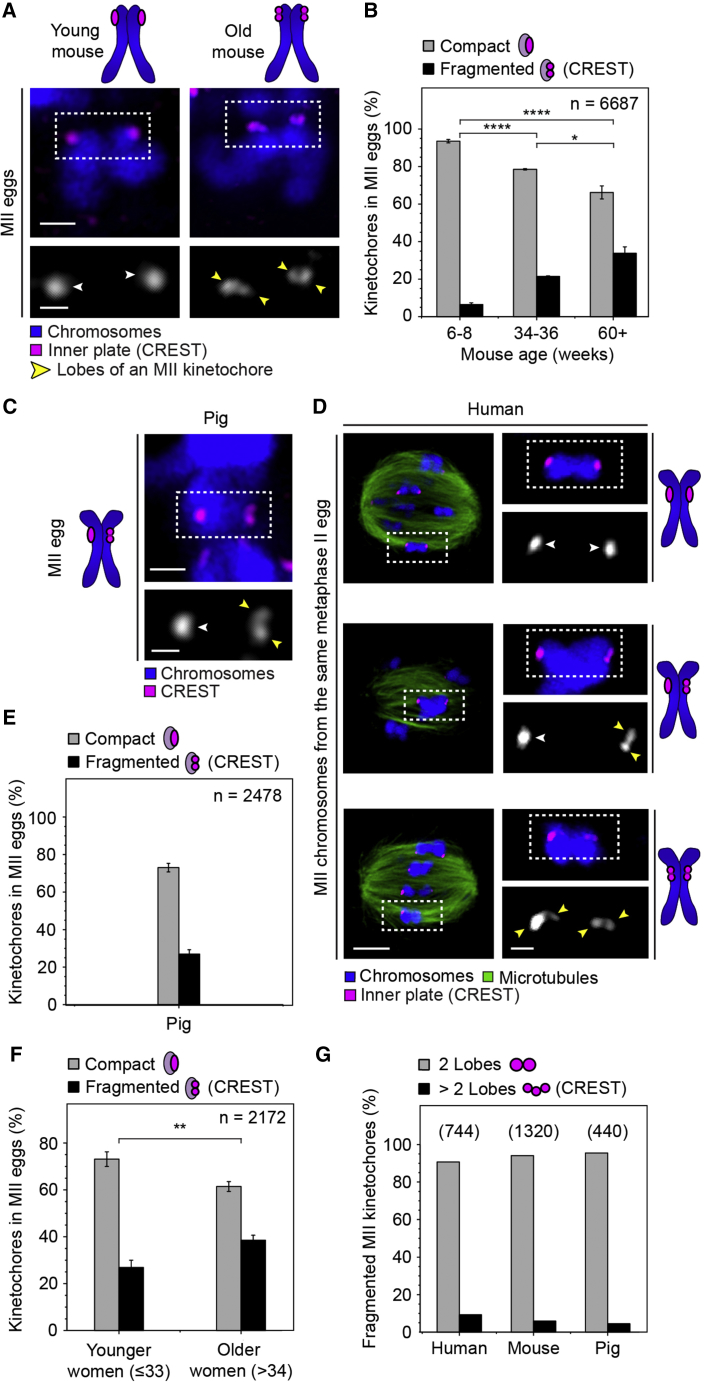
Chromosome segregation errors during female meiosis are a leading cause of pregnancy loss and human infertility. The segregation of chromosomes is driven by interactions between spindle microtubules and kinetochores. Kinetochores in mammalian oocytes are subjected to special challenges: they need to withstand microtubule pulling forces over multiple hours and are built on centromeric chromatin that in humans is decades old. In meiosis I, sister kinetochores are paired and oriented toward the same spindle pole. It is well established that they progressively separate from each other with advancing female age. However, whether aging also affects the internal architecture of centromeres and kinetochores is currently unclear. Here, we used super-resolution microscopy to study meiotic centromere and kinetochore organization in metaphase-II-arrested eggs from three mammalian species, including humans. We found that centromeric chromatin decompacts with advancing maternal age. Kinetochores built on decompacted centromeres frequently lost their integrity and fragmented into multiple lobes. Fragmentation extended across inner and outer kinetochore regions and affected over 30% of metaphase-II-arrested (MII) kinetochores in aged women and mice, making the lobular architecture a prominent feature of the female meiotic kinetochore. We demonstrate that a partial cohesin loss, as is known to occur in oocytes with advancing maternal age, is sufficient to trigger centromere decompaction and kinetochore fragmentation. Microtubule pulling forces further enhanced the fragmentation and shaped the arrangement of kinetochore lobes. Fragmented kinetochores were frequently abnormally attached to spindle microtubules, suggesting that kinetochore fragmentation could contribute to the maternal age effect in mammalian eggs.

Keywords: Trim-Away; aging; aneuploidy; centromere; cohesion; human; kinetochore; maternal age effect; meiosis; oocyte.


Conflict of interest statement

The authors declare no competing interests.

Figures

None
Graphical abstract
Figure 1
Figure 1
The Centromeric CENP-A Domain Decompacts as Oocytes Age and MII Kinetochores Built upon It Fragment into Lobes (A) Centromeric CENP-A fluorescence intensity (integrated density of the centromeric region of interest [ROI] − mean background fluorescence × ROI) in 42 mouse MII eggs (3 independent experiments). 100% was assigned to the mean intensity of young groups. Box plots show median (horizontal white lines), mean (small white squares), 25th and 75th percentiles (boxes), and 5th and 95th percentiles (whiskers). (B) Representative metaphase-II chromosomes from a young and an old mouse egg (8- and 62-week-old females, respectively) visualized with Airyscan microscopy (z projections of 14–16 sections, acquired every 0.18 μm). Centromeres (green, CENP-A) and DNA (blue, Hoechst) are shown. Scale bars represent 2 μm in overviews, and 0.5 μm in insets. (C) Quantification of MII centromere circularity across the two age groups. A circularity value of 1.0 indicates a perfect circle. 1,776 measurements from 14 young and 17 aged MII eggs, imaged as in (B). (D) Age-related increase in centromere distortion (circularity < 0.80) in MII eggs from young and old mice, imaged as in (B). (E) Representative chromosome spread of a young MII mouse egg. DNA signal (blue, Picogreen, confocal mode), outer kinetochore region (white, Hec1, confocal mode), and the centromeric signal (green, CENP-A, STED mode) are shown. Right: one centromere in each panel (STED microscopy, grayscale; A and B, sister centromeres). (F) Representative chromosome spread of an MII egg from an old mouse (63 weeks), labeled as in (E). (G) Surface area of CENP-A centromeric domains in MII eggs from young and aged mice, acquired as in (E) and (F). Distortion of the centromeric domain was measured as the surface area of the smallest circle encompassing the CENP-A signal (119 young and 221 aged centromeres analyzed). Mean and SD are shown. (H) Representative Airyscan-imaged metaphase-II chromosome from an aged mouse egg (61-week-old female). Outer kinetochores (white, Hec1), centromeres (green, CENP-A), and DNA (blue, Hoechst) are shown. Scale bars represent 1 μm in overview, and 0.5 μm in insets. (I) Quantification of kinetochore configurations visualized with Airyscan microscopy, based on the outer Hec1 signal in 37 MII mouse eggs (3 experiments), labeled as in (H). (J) Quantification of how frequently the MII outer kinetochore pattern follows changes in the underlying centromeric domain. Concordant indicates centromere/outer kinetochore pairs where the CENP-A/Hec1 signals were both either compact or fragmented. 740 centromeres and their corresponding kinetochores from 19 old MII mouse eggs (3 experiments), labeled as in (B) and (H). Young MII eggs: 8-week-old females; aged eggs (12 animals): 60- to 64-week-old females. Scale bars represent 4 μm in overviews, and 0.5 μm in insets in (E) and (F). p values are designated as p < 0.05 and ∗∗∗∗p < 0.0001. p values were calculated with Student’s t test (I) and Fisher’s exact test (D). In (A), mean fluorescence measurements per egg were compared by one-way ANOVA followed by Tukey’s test. Error bars show SEM. White arrows point to compact kinetochores, and yellow arrows point to lobes within a fragmented MII kinetochore. See also Figure S1.
Figure 2
Figure 2
Kinetochore Fragmentation Is Conserved across Various Mammalian Species (A) Examples of kinetochores in MII eggs from young (8 week) and aged (≥60 week) mice. (B) Kinetochore configurations shown in (A) and their occurrence in 176 MII eggs from mice of different ages (6 experiments; aged eggs originated from 29 mice). (C) Representative pig metaphase-MII chromosome and its corresponding kinetochores. (D) Three representative human MII chromosomes from the same egg (33-year-old donor). Scale bars represent 4 μm in overview, and 0.5 μm in insets. (E) Kinetochore configurations shown in (C) and their occurrence in 63 pig MII eggs (8 experiments). (F) Kinetochore configurations shown in (D) and their occurrence in 17 MII eggs from young (≤33 years old) and 32 MII eggs from older (>34 years old) women. (G) Multi-lobular kinetochore configurations (2 or >2 distinct lobes) and their occurrence in MII eggs from humans, pigs, and aged mice. Kinetochores (magenta, CREST) and DNA (blue, Hoechst) are shown in (A), (C), and (D). In (D), microtubules are additionally labeled (green, α-tubulin). Chromosomes were fixed on intact spindles at the metaphase-II stage and imaged with Airyscan microscopy. Scale bars represent 1 μm in overview, and 0.5 μm in insets in (A) and (C) p values are designated as p < 0.05, ∗∗p < 0.01, and ∗∗∗∗p < 0.0001. All p values were calculated with Student’s t test. Error bars show SEM. White arrows point to compact kinetochores, and yellow arrows point to lobes within a fragmented MII kinetochore. See also Figure S2.
Figure 3
Figure 3
Cohesin Loss Causes Decompaction of Centromeric Chromatin and Fragmentation of Meiotic Kinetochores (A) Scheme of Trim-Away experiments to acutely degrade cohesins in mouse metaphase-II eggs. Trim-Away is a protein depletion tool, which uses antibodies to rapidly remove unmodified, native proteins via the antibody receptor/E3 ubiquitin ligase TRIM21 and the endogenous protein degradation machinery. (B) Immunolabeled young TRIM21 overexpressing metaphase-II mouse eggs, microinjected with either a control IgG antibody (top) or an anti-Rec8 antibody provided in excess (bottom), as in (A). Images are z projections of 63–69 sections, acquired every 0.19 μm. Microtubules (green, α-tubulin) and chromosomes (blue, Hoechst). The scale bar represents 5 μm. (C) Representative chromosome spreads from young metaphase-II mouse eggs depleted of Smc3. Insets: a chromosome (control, left panel) or individual single chromatids (all other panels). Outer kinetochores (white, Hec1), centromeres (green, CENP-A), and chromosomes (blue, Hoechst) are shown. (D) Normalized diameter of the CENP-A centromeric domain in control and young mouse MII eggs depleted for Smc3, as in (C). CENP-A domains were divided into three groups, based on the fragmentation status of the overlying Hec1 kinetochore. 723 centromeres from 20 MII eggs were evaluated (2 experiments). (E) Occurrence of different kinetochore architectures based on outer kinetochore Hec1 signal in cells treated as in (C). Data are from 35 MII eggs (young mice; 2 experiments). (F) Normalized diameter of the Hec1 kinetochore domain in control and young mouse eggs depleted for Smc3. Both the fragmentation status and the diameter measurements were based on Hec1 labeling. 755 kinetochores from 20 MII eggs were evaluated (2 experiments). (G) The diameter of the CENP-A centromeric domain (a.u.) plotted against the Hec1 outer kinetochore diameter (a.u.) for each of the 565 MII kinetochores following a full depletion of Smc3/control MII eggs as in (C). Pearson’s correlation coefficients: r = 0.402 (controls) and r = 0.495 (experimental group). (H) Inner plates of MII kinetochores in metaphase-arrested eggs from young mice in a control chromosome (left panel; two sister kinetochores) and in single chromatids induced by a full depletion of Rec8 (other panels), achieved as in (B). Chromosomes (blue, Hoechst) and kinetochore inner plates (magenta, CREST) are shown. (I) Occurrence of MII kinetochore configurations in young eggs following the targeting of distinct cohesin subunits (Rec8, Smc3) by Trim-Away (full depletion) and in control eggs. Data are from 79 MII eggs from young mice (3 experiments). (J) Young metaphase-II eggs labeled with the inner kinetochore protein CENP-C. Images show a control chromosome (left panel; two sister kinetochores) and single chromatids induced by a full depletion of Rec8 (other panels), obtained as in (A). Chromosomes (blue, Hoechst) and kinetochore inner plates (yellow, CENP-C) are shown. (K) Occurrence of different kinetochore architectures based on the inner kinetochore CENP-C signal in cells treated as in (J). Data from 36 MII eggs (young mice; 2 experiments). Scale bars represent 2 μm in overviews, and 0.5 μm in insets in (C), (H), and (J). p values are designated as p < 0.05, ∗∗p < 0.01, ∗∗∗p < 0.001, and ∗∗∗∗p < 0.0001. p values were calculated with Student’s t test in (I) and Fisher’s exact test in (E) and (K); in (D) and (F), mean measurements per egg were compared by one-way ANOVA followed by Tukey’s test. Error bars show SEM. Box plots show median (horizontal lines), mean (small squares), 25th and 75th percentiles (boxes), and 5th and 95th percentiles (whiskers). Arrows: white point to compact kinetochores, and yellow point to lobes within a fragmented MII kinetochore. See also Figures S3–S5 and Videos S1 and S2.
Figure 4
Figure 4
The Extent of Kinetochore Fragmentation Correlates with the Degree of Cohesion Loss (A) Scheme of the partial Trim-Away method in metaphase-II eggs. The degree of cohesin loss is fine-tuned by varying the amount of microinjected antibody. (B) Representative live spindles from TRIM21-overexpressing young MII eggs microinjected with either a control IgG antibody or various concentrations of the anti-Smc3 antibody. Chromosomes (red, H2B-mRFP) and microtubules (blue, MAP4-MTBD-Snap647). The scale bar represents 10 μm. (C) Representative examples of the three chromosome categories aligned at the equator of the same metaphase-II spindle following partial depletion of Smc3 by Trim-Away, as in Figure S5E. (D) Occurrence of different MII kinetochore architectures based on CREST signal in the three chromosome categories defined by Hoechst signal, as in (C), following partial depletion of Smc3 (41 young MII eggs, 4 experiments). (E) Representative kinetochores in chromosomes (left panels) and single chromatids (all other panels) in MII eggs from aged mice (≥60 weeks) or women of all ages. (F) Kinetochore architectures shown in (E) and their occurrence on intact chromosomes and single chromatids (50 metaphase-II eggs from aged mice, 5 experiments). (G) Kinetochore architectures shown in (E) and their occurrence on intact chromosomes and single chromatids in 29 human MII eggs. Scale bars, 2 μm in overview, and 0.5 μm in insets. Chromosomes (blue, Hoechst) and kinetochores (magenta, CREST) are shown in (C) and (E). In (C), microtubules are additionally labeled (green, α-tubulin). p values are designated as p < 0.05 and ∗∗∗∗p < 0.0001. p values were calculated with Fisher’s exact test. Error bars show SEM. Arrows: white point to compact kinetochores, and yellow point to lobes within a fragmented MII kinetochore. See also Figure S5 and Video S3.
Figure 5
Figure 5
Kinetochore Fragmentation Is Also Evident during Meiosis I (A) Scheme of the partial Trim-Away method in metaphase I, where cohesin levels are reduced by microinjecting an anti-Smc3 antibody at a limiting concentration. (B) Representative Trim-Away spindles at late metaphase I, in young mouse oocytes microinjected with a control antibody (left panel) or with an anti-Smc3 antibody at a limiting concentration (right panel). Images are z projections of 82 sections acquired every 0.18 μm. The scale bar represents 5 μm. (C) Occurrence of different chromosome architectures assessed based on the Hoechst signal in MI oocytes treated as in (B). Data are from 42 young MI oocytes (2 experiments). (D) Distance between the two sister kinetochores of a bivalent in metaphase-I oocytes from young mice treated as in (B). Data are from 42 young MI oocytes (2 experiments). Box plots show median (horizontal white lines), mean (small white squares), 25th and 75th percentiles (boxes), and 5th and 95th percentiles (whiskers). (E) Representative Trim-Away spindles treated as in (B). Insets: chromosome and kinetochore architectures in MI bivalents under these conditions. Scale bars represent 10 μm in overview, and 2 μm or 0.5 μm in insets. (F) Kinetochore architectures shown in (E) and their occurrence in MI oocytes treated as in (B). Data are from 55 metaphase-I oocytes (2 experiments). Error bars show SEM. (G) Representative two sister kinetochores of a bivalent in control oocytes (left panel) or anti-Smc3 microinjected Trim-Away oocytes (other panels). Scale bars represent 0.5 μm. Chromosomes (blue, Hoechst) and kinetochores (magenta, CREST) are shown in (B), (E), and (G). In (B) and (E), microtubules are additionally labeled (green, α-tubulin). p values are designated as ∗∗p < 0.01 and ∗∗∗∗p < 0.0001. p values were calculated with one-way ANOVA followed by Tukey’s test in (D) and Student’s t test in (F). Arrows: white point to compact kinetochores, and yellow point to lobes within a fragmented MI kinetochore. Numbers in insets refer to sister kinetochores shown (as in the E schematic). See also Figure S6.
Figure 6
Figure 6
Fragmented Kinetochores Are More Likely to Be Abnormally Attached to Spindle Microtubules (A) Quantification of the number of distinct k fibers attaching to compact/fragmented kinetochores at metaphase II (28 aged mouse MII eggs, 3 experiments) is shown. (B) Representative kinetochore-microtubule attachment types, relative to the kinetochore fragmentation status. The scale bar represents 1 μm. (C) Quantification of the microtubule attachment types shown in (B) across the specified MII kinetochore categories on intact chromosomes (28 aged mouse MII eggs, 3 experiments). (D) Representative merotelically attached single chromatid and its respective kinetochore, aligned at the equator of a metaphase-II spindle in an aged mouse egg. Scale bars represent 5 μm in overview, and 1 μm in insets. (E) Quantification of the subtypes of merotelic attachments on fragmented kinetochores, relative to the chromosome architecture and the site of microtubule attachment. (F) Occurrence of kinetochore architectures following Trim-Away of Smc3 in mouse MII eggs subjected to either DMSO or low-dose nocodazole (62 young MII eggs, 3 experiments). (G) Representative chromosome spreads of control and Smc3 partially depleted MI oocytes from young mice subjected to monastrol/control DMSO drug treatments. Each inset shows two sister kinetochores/centromeres only. Outer kinetochores (white, Hec1), centromeres (green, CENP-A), and chromosomes (blue, Hoechst) are shown. Scale bars represent 5 μm in overview, and 1 μm in insets. (H) Occurrence of kinetochore architectures in MI oocytes from young mice treated as in (G). Quantifications are based on Hec1 labeling in 80 MI oocytes (2 experiments). DNA (blue, Hoechst), microtubules (green, α-tubulin), and kinetochores (magenta, CREST) are shown in (B) and (D). p values are designated as p < 0.05, ∗∗p < 0.01, ∗∗∗p < 0.001, and ∗∗∗∗p < 0.0001. p values in (F) were calculated with Student’s t test and in (A), (C), and (E) with Fisher’s exact test. In (H), mean measurements per oocyte were compared by one-way ANOVA followed by Tukey’s test. Error bars show SEM. Arrows: white point to compact kinetochores, and yellow/blue to lobes within fragmented kinetochores/centromeres, respectively. See also Figure S7.
Figure 7
Figure 7
Age-Related Cohesin Loss Alters Chromosome Architecture and Fragments Mammalian Meiotic Kinetochores into Distinct Lobes Scheme summarizing how cohesin loss affects not only sister kinetochore pairing but also the internal kinetochore architecture in meiosis-I oocytes and meiosis-II eggs (A), and a model proposing how cohesin-dependent changes in centromeric architecture may promote the fragmentation of a meiotic kinetochore into lobes (B).

References

    1. Black B.E., Bassett E.A. The histone variant CENP-A and centromere specification. Curr. Opin. Cell Biol. 2008;20:91–100. - PubMed
    1. Cheeseman I.M. The kinetochore. Cold Spring Harb. Perspect. Biol. 2014;6:a015826. - PMC - PubMed
    1. Pesenti M.E., Weir J.R., Musacchio A. Progress in the structural and functional characterization of kinetochores. Curr. Opin. Struct. Biol. 2016;37:152–163. - PubMed
    1. Pereira A.J., Maiato H. Maturation of the kinetochore-microtubule interface and the meaning of metaphase. Chromosome Res. 2012;20:563–577. - PubMed
    1. Auckland P., McAinsh A.D. Building an integrated model of chromosome congression. J. Cell Sci. 2015;128:3363–3374. - PubMed

Publication types

MeSH terms