. 2019 Nov 12;13(5):803-816.
doi: 10.1016/j.stemcr.2019.10.005. Epub 2019 Oct 31.

Closing the Mitochondrial Permeability Transition Pore in hiPSC-Derived Endothelial Cells Induces Glycocalyx Formation and Functional Maturation

Affiliations

Closing the Mitochondrial Permeability Transition Pore in hiPSC-Derived Endothelial Cells Induces Glycocalyx Formation and Functional Maturation

Gesa L Tiemeier et al. Stem Cell Reports. .

Abstract

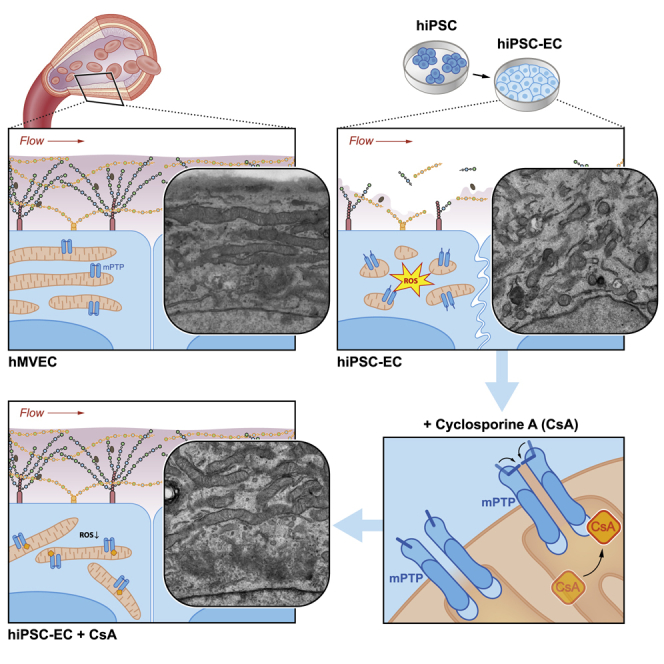
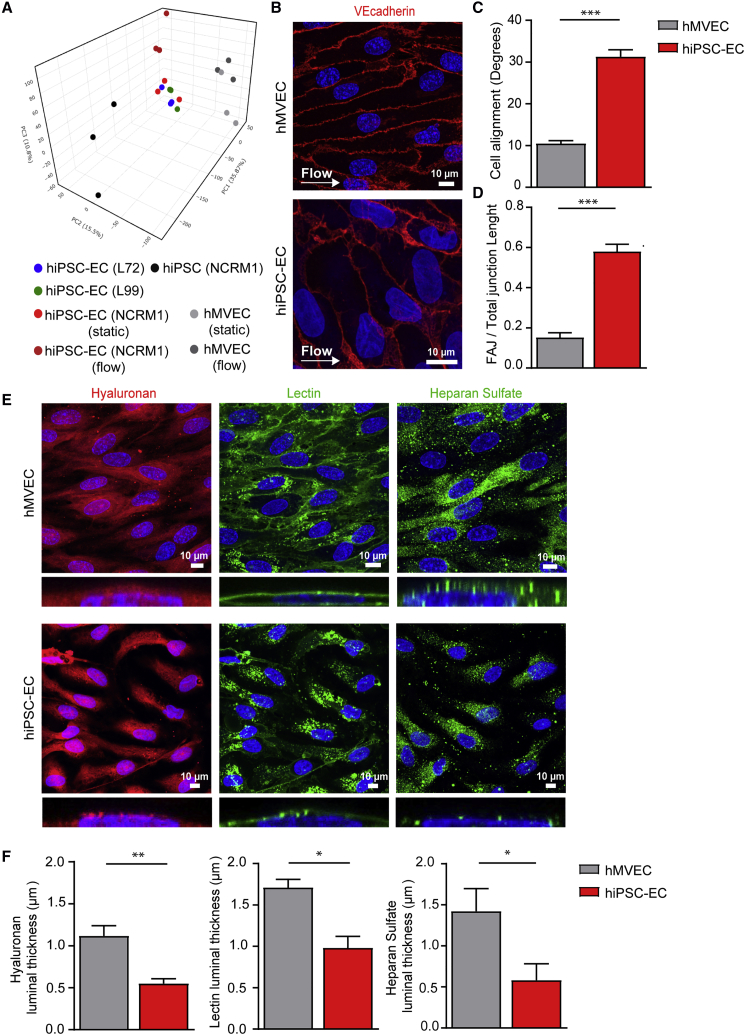
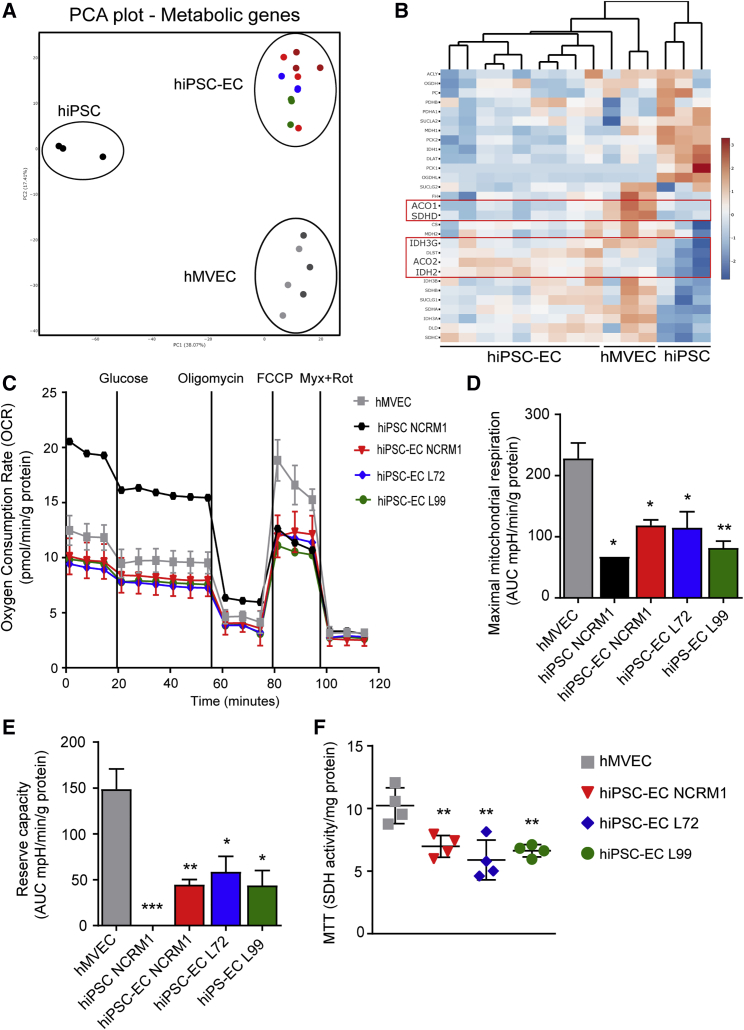
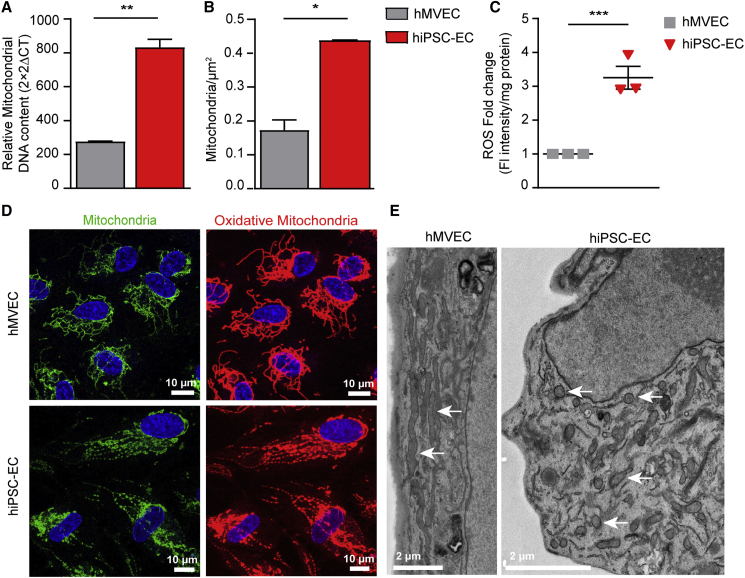
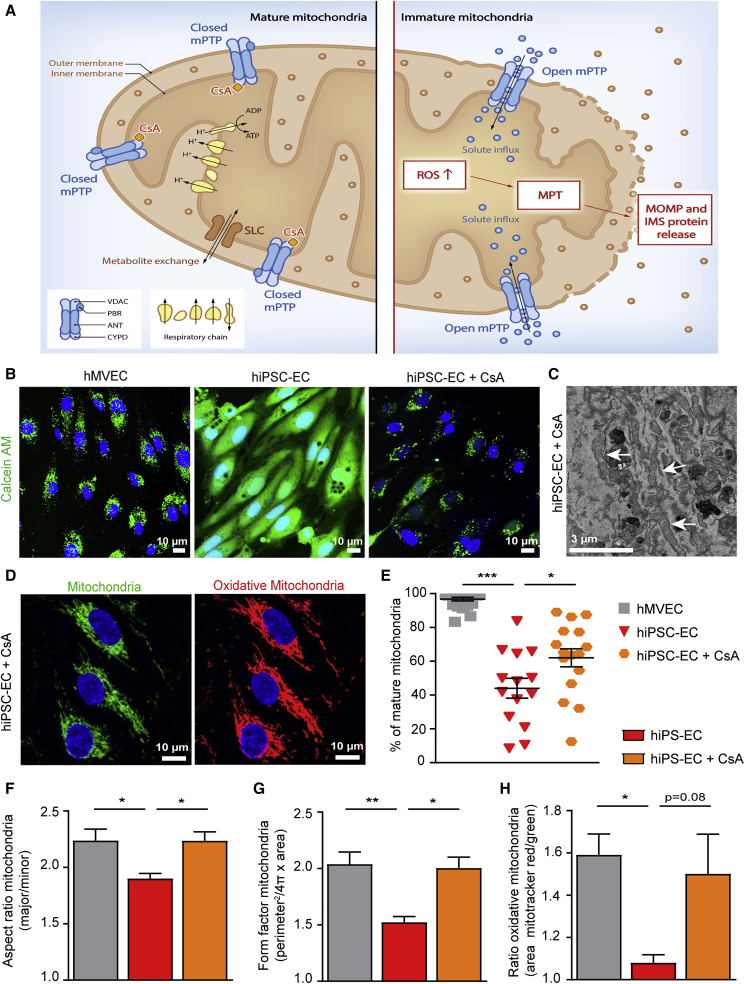
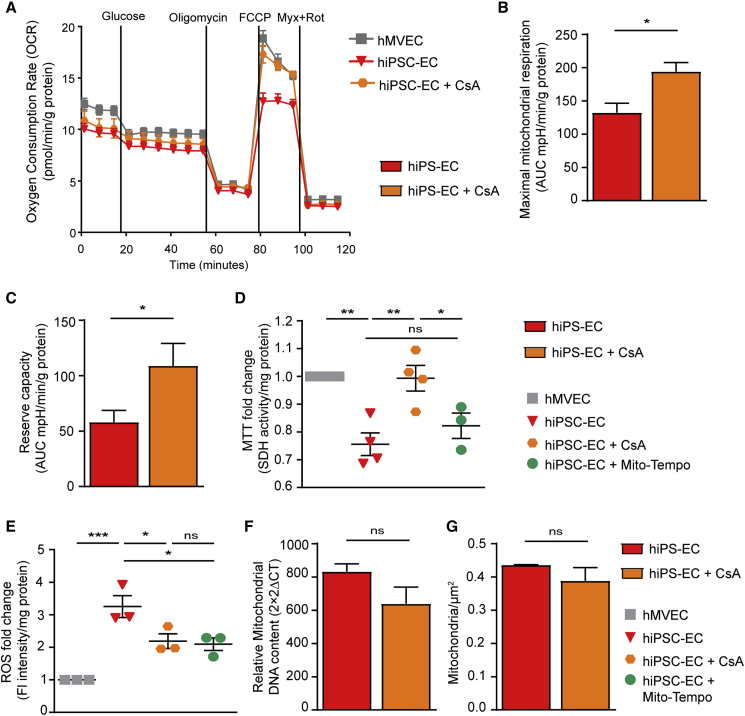
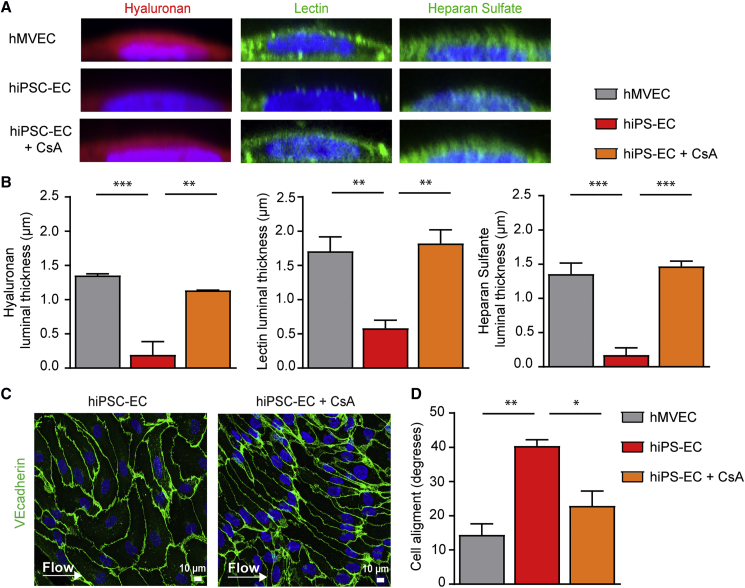
Human induced pluripotent stem cells (hiPSCs) are used to study organogenesis and model disease as well as being developed for regenerative medicine. Endothelial cells are among the many cell types differentiated from hiPSCs, but their maturation and stabilization fall short of that in adult endothelium. We examined whether shear stress alone or in combination with pericyte co-culture would induce flow alignment and maturation of hiPSC-derived endothelial cells (hiPSC-ECs) but found no effects comparable with those in primary microvascular ECs. In addition, hiPSC-ECs lacked a luminal glycocalyx, critical for vasculature homeostasis, shear stress sensing, and signaling. We noted, however, that hiPSC-ECs have dysfunctional mitochondrial permeability transition pores, resulting in reduced mitochondrial function and increased reactive oxygen species. Closure of these pores by cyclosporine A improved EC mitochondrial function but also restored the glycocalyx such that alignment to flow took place. These results indicated that mitochondrial maturation is required for proper hiPSC-EC functionality.

Keywords: cyclosporine A; endothelial cell differentiation; glycocalyx; hiPSC-ECs; hiPSC-derived endothelial cells; maturation; mitochondrial dysfunction; mitochondrial permeability transition pore; reactive oxygen species; shear stress.


Figures

None
Graphical abstract
Figure 1
Figure 1
hiPSC-Derived Endothelial Cells Do Not Show a Functional Response to Shear Stress Accompanied by an Insufficient Glycocalyx (A) PCA plot of expression of all genes acquired from RNA sequencing of hiPSC NCRM1, mature ECs (hMVECs), and hiPSC-ECs NCRM1/L72/L99 in static conditions and after exposure to flow. (B–D) Representative cross-sectional confocal images stained for VE-cadherin (red) and Hoechst (blue) after 4 days of laminar flow (5 dyne/cm2) culture of hMVECs and hiPSC-EC NCRM1 show the alignment of cells to flow (B). Quantification of cell alignment after 4 days of laminar flow culture of hMVECs and hiPSC-ECs (100 cells/group) (C). Quantification of adherence junction remodeling as the ratio of unstable focal adherence junction (FAJ) over total adherence junction length after 4 days of laminar flow culture of hMVECs and hiPSC-ECs (50 cells/group) (D). (E and F) Representative cross-sectional and side-view confocal images stained for components of the glycocalyx (E). Hyaluronan (Neurocan, red), lectin (LEA, green) and heparan sulfate (JM403, green) after 4 days of laminar flow (5 dyne/cm2) culture of hMVECs and hiPSC-EC NCRM1 (E). Quantification of luminal thickness of hyaluronan, lectin Lycopersicon esculentum, and heparan sulfates after 4 days of laminar flow of hMVECs and hiPSC-ECs (8–16 cells/group) (F). Values are presented as mean ± SEM of n = 3–6 independent experiments. Non-paired two-tailed Student's t test was performed; p < 0.05, ∗∗p < 0.001, ∗∗∗p < 0.0001.
Figure 2
Figure 2
hiPSC-ECs Have Dysfunctional Mitochondria (A) PCA plot of expression of all metabolic genes acquired from RNA sequencing of hiPSC NCRM1, hiPSC-ECs NCRM1/L72/L99, and mature ECs (hMVECs). (B) Heatmap of RNA-sequencing results of metabolic genes involved in the mitochondrial metabolism. Scale bar represents Z scores: blue indicates lower gene expression and red a higher gene expression. (C–E) Using a Seahorse XF flux analyzer, the oxygen consumption rate (OCR), an indicator of metabolic function, revealed mitochondrial dysfunction in three different hiPSC-EC cell lines (C). Both maximal mitochondrial respiration (D) and mitochondrial reserve capacity (E) were decreased (n = 4). (F) Mitochondrial activity was also tested by MTT (n = 4). Values are presented as mean ± SEM of n = 3–5 independent experiments. One-way ANOVA was performed; p < 0.05, ∗∗p < 0.001, ∗∗∗p < 0.0001.
Figure 3
Figure 3
hiPSC-ECs Have an Increased Amount of Immature Mitochondria (A) Mitochondrial DNA measured by qPCR. (B) Mitochondrial density quantified on transmission electron microscopy (TEM) stitches (21 cells/group). (C) Fold change of fluorescent intensity/mg protein of ROS dye. (D) Representative cross-sectional confocal images stained for MitoTracker red (oxidative mitochondria) and MitoTracker green (mitochondria). (E) TEM images show the ultrastructure of mitochondria of hMVECs and hiPSC-EC NCRM1. Values are presented as mean ± SEM of n = 3 independent experiments. Non-paired two-tailed Student's t test was performed; p < 0.05, ∗∗p < 0.001, ∗∗∗p < 0.0001.
Figure 4
Figure 4
Treatment with Cyclosporine A Results in Closure of the mPTP and Subsequent Maturation of the Mitochondria (A) Schematic overview of mature and immature mitochondria. Cyclosporine A (CsA) binds to cyclophilin D (CYPD) and thereby closes the mitochondrial permeability transition pore (mPTP). This prevents leakage of ROS and intermembrane space (IMS) proteins due to mitochondrial outer membrane permeabilization during the opening of mPTP. (B) To determine the state of the mPTP in hiPSC-ECs, the cobalt/calcein AM (green) quenching method was used. hiPSC-EC NCRM1 treated with CsA for 30 min prevented calcein leakage, indicating that CsA closed the mPTP. (C) TEM image shows the ultrastructure of mitochondria of hiPSC-ECs treated with 500 nM CsA during differentiation. (D) Representative cross-sectional confocal images stained for MitoTracker red (oxidative mitochondria) and MitoTracker green (mitochondria) of hiPSC-ECs NCRM1 treated with CsA. (E) Quantification of percentage of mature mitochondria on TEM stitches (21 cells/group). (F and G) Quantitative analysis of mitochondrial morphology by analyzing MitoTracker confocal images. Individual particles (mitochondria) were analyzed for circularity and lengths of major and minor axes. From these values, aspect ratio (AR; major/minor) (F) and form factor (FF; perimeter2/4π × area) (G) were calculated. Both FF and AR have a minimal value of 1 when a particle is a small perfect circle, and the values increase as the shape becomes elongated. AR is a measure of mitochondrial length, and an increase of FF represents increase in length and branching (10 cells/group). (H) Quantitative analysis of the area stained by MitoTracker red (oxidative mitochondria) divided by the area stained for MitoTracker green (mitochondria) (10 cells/group). Values are presented as mean ± SEM of n = 3–5 independent experiments. One-way ANOVA was performed; p < 0.05, ∗∗p < 0.001, ∗∗∗p < 0.0001.
Figure 5
Figure 5
Treatment with Cyclosporine A Results in Improved Mitochondrial Function in hiPSC-ECs (A–C) The OCR revealed increased mitochondrial function in hiPSC-EC NCRM1 treated with 500nM CsA during differentiation (A). Both maximal mitochondrial respiration (B) and mitochondrial reserve capacity (C) were increased in hiPSC-ECs treated with CsA (n = 3). (D) Mitochondrial activity was also tested by MTT after addition of 500 nM CsA or 10 mM MitoTEMPO during differentiation. CsA results in an increased mitochondrial activity, whereas MitoTEMPO did not increase mitochondrial activity. (E) Fold change of fluorescent intensity per mg of protein of ROS staining shows reduced ROS of CsA-treated cells. The same effect was obtained by addition of 10 mM MitoTEMPO. (F and G) Mitochondrial DNA measured with qPCR (F) and mitochondrial density quantified on TEM stitches (21 cells/group) (G) after treatment of CsA during differentiation. Values are presented as mean ± SEM of n = 3–4 independent experiments. One-way ANOVA or non-paired two-tailed Student's t test was performed; p < 0.05, ∗∗p < 0.001, ∗∗∗p < 0.0001; ns, not significant.
Figure 6
Figure 6
Treatment with Cyclosporine A Restores the Glycocalyx and Improves Alignment to Flow (A) Representative side-view confocal images stained for hyaluronan (Neurocan, red), lectin (LEA, green), and heparan sulfate (JM403, green) after 4 days of laminar flow culture of hMVECs, hiPSC-ECs control, and hiPSC-EC NCRM1 treated with 500 nM CsA during differentiation. (B) Quantification of luminal thickness of hyaluronan, lectin Lycopersicon esculentum, and heparan sulfates after 4 days of laminar flow of hMVECs, hiPSC-ECs, and hiPSC-ECs treated with CsA (8–16 cells/group). (C) Representative cross-sectional confocal images of VE-cadherin (green) and Hoechst (blue) show the alignment of cells to flow. (D) Quantification of cell alignment after 4 days of laminar flow culture of hMVECs, hiPSC-ECs, and hiPSC-ECs treated with CsA (100 cells/group). Values are presented as mean ± SEM of n = 3 independent experiments. One-way ANOVA was performed; p < 0.05, ∗∗p < 0.001, ∗∗∗p < 0.0001.

References

    1. Arisaka T., Mitsumata M., Kawasumi M., Tohjima T., Hirose S., Yoshida Y. Effects of shear stress on glycosaminoglycan synthesis in vascular endothelial cells. Ann. N. Y Acad. Sci. 1995;748:543–554. - PubMed
    1. Bekkering S., Arts R.J.W., Novakovic B., Kourtzelis I., van der Heijden C., Li Y., Popa C.D., Ter Horst R., van Tuijl J., Netea-Maier R.T. Metabolic induction of trained immunity through the mevalonate pathway. Cell. 2018;172:135–146.e9. - PubMed
    1. Bierhansl L., Conradi L.C., Treps L., Dewerchin M., Carmeliet P. Central role of metabolism in endothelial cell function and vascular disease. Physiology. 2017;32:126–140. - PMC - PubMed
    1. Boels M.G., Avramut M.C., Koudijs A., Dane M.J., Lee D.H., van der Vlag J., Koster A.J., van Zonneveld A.J., van Faassen E., Grone H.J. Atrasentan reduces albuminuria by restoring the glomerular endothelial glycocalyx barrier in diabetic nephropathy. Diabetes. 2016;65:2429–2439. - PubMed
    1. Boels M.G.S., Koudijs A., Avramut M.C., Sol W., Wang G., van Oeveren-Rietdijk A.M., van Zonneveld A.J., de Boer H.C., van der Vlag J., van Kooten C. Systemic monocyte chemotactic protein-1 inhibition modifies renal macrophages and restores glomerular endothelial glycocalyx and barrier function in diabetic nephropathy. Am. J. Pathol. 2017;187:2430–2440. - PubMed

Publication types

MeSH terms

Substances

LinkOut - more resources