

Mip6 binds directly to the Mex67 UBA domain to maintain low levels of Msn2/4 stress-dependent mRNAs
- PMID: 31680439
- PMCID: PMC6893359
- DOI: 10.15252/embr.201947964
Mip6 binds directly to the Mex67 UBA domain to maintain low levels of Msn2/4 stress-dependent mRNAs
Abstract
RNA-binding proteins (RBPs) participate in all steps of gene expression, underscoring their potential as regulators of RNA homeostasis. We structurally and functionally characterize Mip6, a four-RNA recognition motif (RRM)-containing RBP, as a functional and physical interactor of the export factor Mex67. Mip6-RRM4 directly interacts with the ubiquitin-associated (UBA) domain of Mex67 through a loop containing tryptophan 442. Mip6 shuttles between the nucleus and the cytoplasm in a Mex67-dependent manner and concentrates in cytoplasmic foci under stress. Photoactivatable ribonucleoside-enhanced crosslinking and immunoprecipitation experiments show preferential binding of Mip6 to mRNAs regulated by the stress-response Msn2/4 transcription factors. Consistent with this binding, MIP6 deletion affects their export and expression levels. Additionally, Mip6 interacts physically and/or functionally with proteins with a role in mRNA metabolism and transcription such as Rrp6, Xrn1, Sgf73, and Rpb1. These results reveal a novel role for Mip6 in the homeostasis of Msn2/4-dependent transcripts through its direct interaction with the Mex67 UBA domain.
Keywords: Mex67; Mip6; Msn2/4; RNA-binding protein; mRNA export.
© 2019 The Authors.
Conflict of interest statement
The authors declare that they have no conflict of interest.
Figures

Sus1‐TAP precipitation from WT and ubp8∆ strains. Sus1‐TAP and co‐precipitating proteins were analyzed on an SDS 4–12% gradient polyacrylamide gel and stained with Coomassie Blue. Bands corresponding to Sus1‐TAP and Mip6, identified by mass spectrometry, are indicated.
Immunoprecipitation with the TAP antibody using no‐tag or Mip6‐TAP‐expressing cells. Mip6‐TAP and Mex67 were detected in INPUT and IP samples by Western blotting.
As in (B) in the mip6Δ strain transformed with Mip6‐GFP‐expressing plasmid with and without RNase A treatment at the indicated concentrations.
Growth of WT, and of mip6Δ, mex67‐5, and mip6Δmex67‐5 mutants. Precultures were diluted in liquid YPD medium. The 10‐fold dilutions of cells were then spotted onto YPD plates and incubated for 2 days at the indicated temperatures.
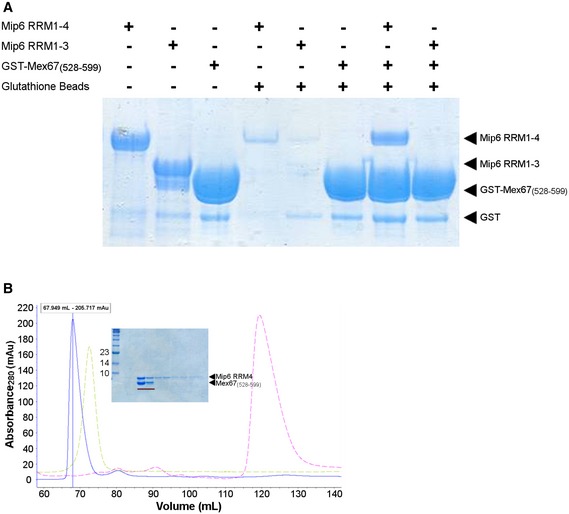
Mip6 RRM4 mediates the interaction of Mip6 with Mex67(528–599). Purified recombinant GST‐tagged Mex67(528–599) was bound to pre‐equilibrated Glutathione‐Agarose beads as indicated. After washing, the beads were incubated with purified untagged recombinant Mip6 RRM1‐4 or RRM1‐3 as indicated, were washed again, and were then loaded onto a 10% SDS–PAGE gel that was subsequently stained with Coomassie Blue.
Stable complex of Mex67(528–599) and Mip6 RRM4(401–480) during gel filtration. Superposition of the chromatogram representing the size‐exclusion elution profile of the complex formed between Mex67(528–599) and Mip6 RRM4(401–480), obtained from a 16/60 Superdex 75 gel filtration column at a volume of 67.9 ml, onto the elution profile previously obtained for each of the proteins separately. The elution peak of the complex is shown in blue, and the corresponding fractions visualized by Coomassie staining of a 10% SDS–PAGE gel are marked with a red bar (inset). The light green peak corresponds to the separate elution peak of Mex67(528–599), while the pink peak corresponds to that of the truncated Mip6 RRM4(401–480) construct.

Ribbon depiction of the crystal structure of Mex67 N+UBA (PDB: 6EXZ). The UBA domain (helices H1–H4) is folded as in previously reported structures (PDB ID: 1OAI). The new N‐terminus (shaded light blue) is formed by two short alpha helices (N1 and N2 that fold back into helices H1 and H2). The red bars in the histogram below summarize the analysis of Mip6 RRM4‐Mex67 N+UBA binding by NMR titration experiments monitored on the Mex67 N+UBA 1H‐15N HSQC spectrum. Peak intensity ratios between free Mex67 N+UBA and a mixture containing Mip6 RRM4 and Mex67 N+UBA (at 15% saturation on Mip6) were plotted against the Mex67 sequence (red bars). The green bars in the histogram are the results of equivalent analysis of the Mip6 RRM4 W442A/Mex67 N+UBA mixture (also at 15% saturation on the Mip6 mutant), and show that W442A abolished the interaction. The signal intensity decreases in the red histogram are mapped on the structure of Mex67 N+UBA. The level of red color saturation directly corresponds to the decrease in signal intensity and reveals the putative Mex67 N+UBA binding site of Mip6 RRM4.
Biophysical characterization of the interaction between Mex67(528–599) and Mip6. The upper panel shows the ITC binding isotherms of Mex67(528–599) (N+UBA) titrated into Mip6 RRM1‐4(111–480) (green) or Mip6 RRM4(401–480) (red). The lower panel shows the ITC binding isotherms of Mex67 N+UBA titrated into Mip6 RRM4 (red), using the same data as the upper panel, or the Mip6W442A mutant (blue).
Immunoprecipitation of the empty plasmid pADH1pr‐GFP, Mip6‐GFP, or Mip6‐ΔRRM4‐GFP (left) and of pADH1pr‐GFP, Mip6‐GFP, or Mip6W442A‐GFP mutant (right) expressed from the indicated plasmids in an mip6Δ strain. Mip6‐GFP and an empty plasmid were used as positive and negative controls, respectively, in both panels. Mip6‐GFP, including its mutant constructions, and Mex67 were detected by Western blotting using the indicated antibodies. The bar graphs at right indicate the quantification of Mex67 IP signal intensity normalized to Mip6. Mean ± SEM from 2 to 5 biological replicates was represented; significant differences from unpaired Student's t‐test with Welch's correlations and one‐tailed were represented (*P‐value < 0.05; ***P‐value < 0.001).
Growth of WT, Mip6‐GFP, and Mip6W442A‐GFP strains. Precultures were diluted in liquid YPD medium, and 10‐fold dilutions of cells were spotted onto YPD plates. Plates were incubated for 2 days at the indicated temperatures.

Left panel: Superposition of 1H‐15N HSQC spectra of the titration of unlabeled Mex67 N+UBA onto the Mip6 RRM4: black (free protein), dark red (50% saturated with unlabeled Mex67 N+UBA), and red (100% saturated). Signals corresponding to the side chain crosspeaks of tryptophans have been marked to show their differential behavior upon Mex67 interaction. Many signals disappear upon titration, most of which were not assigned and likely belong to loops. Right panel: the chemical shift mapping and their representation over the structure of the Mip6 RRM4 model: Shades of blue show non‐interacting residues, shades of red show interacting residues, and unassigned residues are shown in gray.
Superposition of the 1H‐15N HSQC spectra of Mip6 RRM4 (purple) and the Mip6 RRM4 W442A mutant (green). Note the disappearance of the W442 side chain crosspeak in the mutant. The majority of the peaks remain at the same position in the mutant, showing that the structures are very similar. Crosspeaks in the mutant are sharper than those in the WT, showing that it is less prone to aggregation.
NMR‐monitored experiments of the titration of unlabeled Mip6 RRM4 W442A into 15N‐labeled Mex67 N+UBA. There are almost no changes upon the addition of equimolecular amounts of the Mip6 mutant in contrast to the WT case (Appendix Fig S3).

Purified recombinant Mip6 constructs were bound to pre‐equilibrated poly(U) agarose beads. After washing, beads were boiled with SDS sample loading buffer and loaded onto a 10% SDS–PAGE gel that was subsequently stained with Coomassie Blue Input (I), wash (W), and eluate (E), which are shown for each pull‐down. BSA was used as a negative control. The asterisk indicates GST from the purification.
As in (A) using preincubated complex of Mex67(528–599) with Mip6 RRM4 (left) or Mip6 RRM1/4 construct (right). Mex67(528–599) shows no poly(U) binding when preincubated with Mip6.

- A
Western blotting of whole‐cell extracts obtained from strains expressing Mip6‐GFP under the control of the ADH1 promoter from a plasmid (1) or at the MIP6 genomic locus (2). A WT strain was used as negative control, and Pgk1 levels were used as loading control.
- B
Dot spot growth assay of WT‐ and mip6∆‐transformed strains. Culture dilutions were done in SC‐URA plates and were incubated for 3 days at 30°C.
- C
A confocal image of GFP‐Mip6‐expressing yeast cells from a plasmid (1) growing at 30°C. Scale bar: 5 μm.
- D, E
Confocal images of Mip6‐GFP localization in the following strains co‐expressing p‐ADH1pr‐Mip6‐GFP: (D) the shuffle mex67Δ strain transformed with Mex67‐HA or Mex67∆UBA‐HA and grown at 30°C; (E) the double mutant mip6∆mex67‐5 strain grown at 30°C or at 30°C followed by incubation at 39°C for 120 min;
- F
Confocal images of Mip6‐GFP localization in mip6∆ cells expressing p‐ADH1pr‐Mip6W442A‐GFP or p‐ADH1pr‐Mip6‐ΔRRM4‐GFP and grown at 30°C.

Confocal images of Mip6‐GFP localization in yeast cells incubated at 30°C or after incubation at 39°C for 20 min. DAPI was used to stain nuclei. Scale bar: 5 μm (left panel). Growth assay of WT and mip6∆ cells expressing p‐ADH1pr‐GFP or p‐ADH1pr‐Mip6‐GFP plasmids (right panel). SC‐URA plates were incubated for 3 days at 37°C.
Mip6‐GFP localization in mip6∆ cells grown under the different stress conditions indicated in the figure. Scale bar: 5 μm.
As in (B) but analyzed at different time points of growth at 39°C. Scale bar: 5 μm.
Confocal analysis of the colocalization of Mip6‐GFP with Pab1‐RFP (upper) or Pbp1‐mCherry (lower) after incubation at 42°C for 30 min or at 39°C for 20 min, respectively. Scale bar: 5 μm. Merge shows the composite images of the two colors. Arrowheads indicate colocalization events.
Effect of cycloheximide (CHX) on Mip6 granule formation when added during heat shock at 39°C for 20 min (CHX + 39°C 20′) or when incubated for 10 min after 20 min of heat shock (39°C 20′ + CHX 10′). Scale bar: 5 μm.

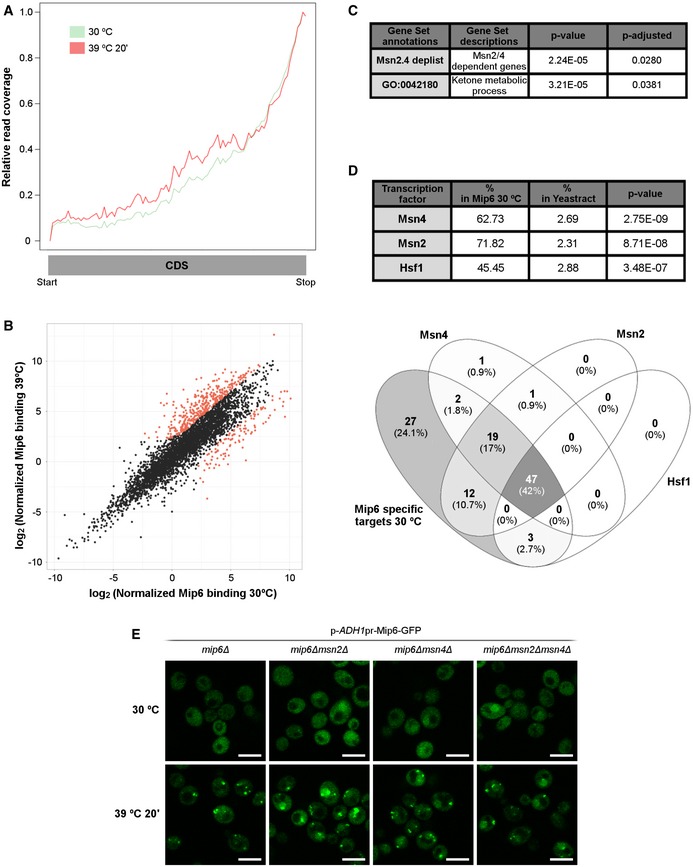
Read coverage profiles throughout the CoDing Sequence (CDS) of Mip6 RNA binding at 30°C (green) and after heat‐shock induction for 20 min (red).
Scatter plot describing the relationship between Mip6 RNA binding at 30°C and that after incubation at 39°C for 20 min. Red points indicate genes (488 from 4,121) showing statistically significant differences (diffNoiseq_rna_prob > 0.9; Dataset EV2).
Significative GSEA results obtained from 110 genes that showed preferential binding at 30°C (P‐adjusted < 0.05).
Upper panel: Table obtained using YEASTRACT 87 showing the percentages of Mip6 targets significantly enriched at 30°C, ranked by dependence on the transcription factors Msn2, Msn4, and Hsf1. Lower panel: a Venn diagram representing the intersection of Mip6‐specific targets at 30°C controlled by Msn2, Msn4, and Hsf1 transcription factors.
Confocal images of Mip6‐GFP localization in mip6∆, mip6∆msn2∆, mip6∆msn4∆, and mip6∆msn2∆msn4∆ cells incubated at 30°C or after incubation at 39°C for 20 min. Scale bar: 5 μm.

- A
HSP12, CTT1, and SSA4 expression, measured using qRT–PCR in WT and mip6∆ strains.
- B
Expression of Msn2/4‐dependent targets in WT and mip6∆ strains, using data obtained in RNA‐seq experiments.
- C, D
As in (A), in cells expressing Mip6‐GFP or Mip6W442A‐GFP (C) or in WT, mip6∆, rrp6∆, or mip6∆rrp6∆ cells (D).
- E
Growth of WT, and of mip6Δ, rrp6Δ, and mip6Δrrp6Δ mutants. Precultures were diluted in liquid YPD medium. The 10‐fold dilutions of cells were then spotted onto YPD plates and incubated for 3 days at 30°C or 7 days at 37°C.
- F
Immunoprecipitation with the TAP antibody using Sgf73‐MYC, Mip6‐TAP, or Mip6‐TAP/Sgf73‐MYC expressing cells. Mip6‐TAP and Sgf73‐MYC were detected in INPUT and IP by Western blotting with the mentioned antibodies. Asterisk indicates an unspecific band from the TAP antibody.
- G
FISH analysis using a Cy3‐labeled specific oligo targeting SSA4 expression in mip6∆ and mex67‐5 cells after incubation at 42°C for 30 min. DAPI was used to stain nuclei. Scale bar: 5 μm. Quantification is shown in Appendix Fig S7.

HSP12, CTT1, and SSA4 expression profiles measured using qRT–PCR in WT and mip6∆ strains incubated at 39°C. Mean values normalized to WT from two biological replicates were shown.
Transcription rate (TR) and mRNA amount (RA) of HSP12, CTT1, and SSA4 transcripts in WT cells incubated at 37°C 45.

HSP12, CTT1, and SSA4 expression measured using qRT–PCR in rpb1‐1 and mip6∆rpb1‐1 strains after incubation at 37°C for 20, 60, and 120 min. Mean values normalized to rpb1‐1 ± SEM from three biological replicates were indicated. Significant differences from one‐tailed unpaired Student's t‐test with Welch's corrections were represented (*P‐value < 0.05; **P‐value < 0.01).
Growth of WT, mip6Δ, rpb1‐1, and mip6Δrpb1‐1 strains (upper panel) and of WT, mip6Δ, xrn1Δ, and mip6Δxrn1Δ strains (lower panel). Precultures were diluted in liquid YPD medium. The 10‐fold dilutions of cells were then spotted onto YPD plates and incubated for 4 days (30°C) and 6 days (35°C) for rpb1‐1 mutants and for 2 days (30°C) or 5 days (37°C) for xrn1Δ mutants.
Confocal images of Mip6‐GFP localization in mip6Δ (left), mip6Δrpb1‐1 (middle), and mip6Δxrn1Δ (right) cells incubated at 30°C (upper panel) or after incubation at 39°C for 20 min (lower panel). Scale bar: 5 μm.
Immunoprecipitation of the empty plasmid pADH1pr‐GFP or Mip6‐GFP expressed from the indicated plasmids in a mip6Δ strain. Mip6‐GFP and Rpb1 were detected in INPUT and IP by Western blotting using the indicated antibodies. Signal intensity was quantified and set to 1 for INPUT and IP of the empty plasmid pADH1pr‐GFP. The relative levels of Rpb1 to the negative control are indicated below.
References
-
- Garcia‐Oliver E, Garcia‐Molinero V, Rodriguez‐Navarro S (2012) mRNA export and gene expression: the SAGA‐TREX‐2 connection. Biochem Biophys Acta 1819: 555–565 - PubMed
-
- Reed R (2003) Coupling transcription, splicing and mRNA export. Curr Opin Cell Biol 15: 326–331 - PubMed
-
- Rodriguez‐Navarro S, Hurt E (2011) Linking gene regulation to mRNA production and export. Curr Opin Cell Biol 23: 302–309 - PubMed
-
- Rondon AG, Jimeno S, Aguilera A (2010) The interface between transcription and mRNP export: from THO to THSC/TREX‐2. Biochem Biophys Acta 1799: 533–538 - PubMed
Publication types
MeSH terms
Substances
Associated data
- Actions
Grants and funding
- BFU2014-57636/Ministerio de Economía, Industria y Competitividad, Gobierno de España (MINECO)/International
- BFU2015-71978/Ministerio de Economía, Industria y Competitividad, Gobierno de España (MINECO)/International
- SAF2015-67077-R/Ministerio de Economía, Industria y Competitividad, Gobierno de España (MINECO)/International
- SAF2017-89901-R/Ministerio de Economía, Industria y Competitividad, Gobierno de España (MINECO)/International
- CTQ2018-84371/Ministerio de Economía, Industria y Competitividad, Gobierno de España (MINECO)/International
- PGC2018-099872-B-I00/Ministerio de Ciencia, Innovación y Universidades (Ministry of Science, Innovation and Universities)/International
- PROM/2012/061/Generalitat Valenciana (Regional Government of Valencia)/International
- PROMETEO 2016/093/Generalitat Valenciana (Regional Government of Valencia)/International
- ACOMP2014/061/Generalitat Valenciana (Regional Government of Valencia)/International
- B2017/BMD-3770/Comunidad de Madrid (Madrid Autonomous Community)/International
