. 2019 Oct 11:13:460.
doi: 10.3389/fncel.2019.00460. eCollection 2019.

The Opening of Connexin 43 Hemichannels Alters Hippocampal Astrocyte Function and Neuronal Survival in Prenatally LPS-Exposed Adult Offspring

Affiliations

The Opening of Connexin 43 Hemichannels Alters Hippocampal Astrocyte Function and Neuronal Survival in Prenatally LPS-Exposed Adult Offspring

Carolina E Chávez et al. Front Cell Neurosci. .

Abstract

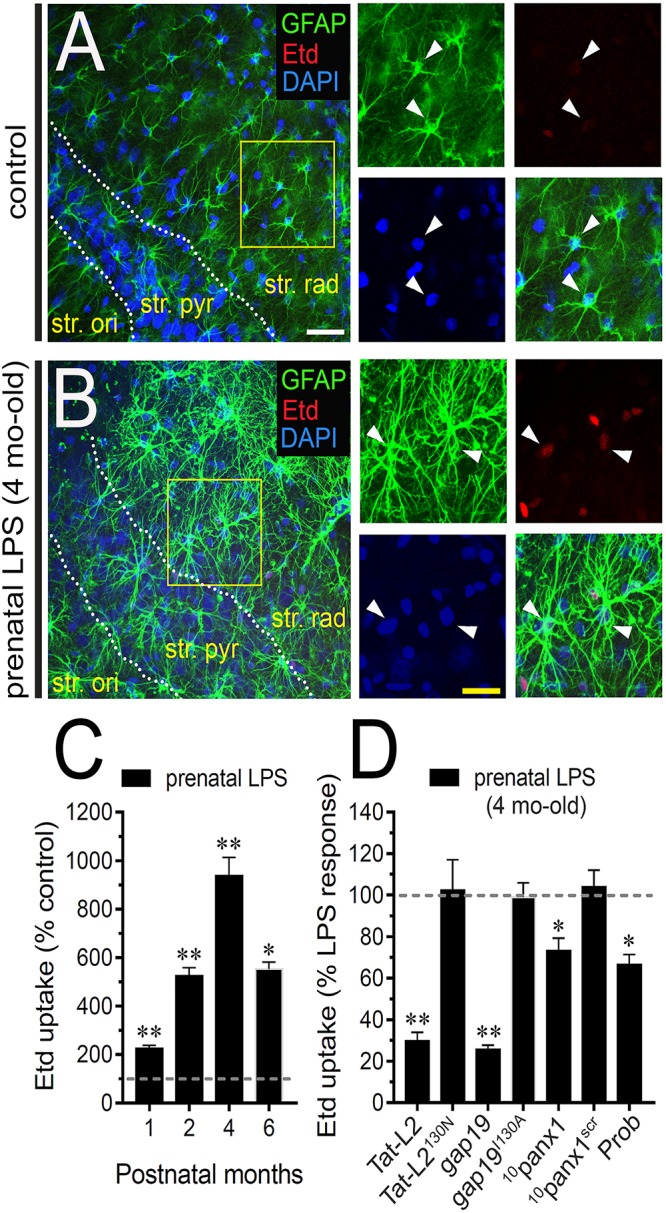
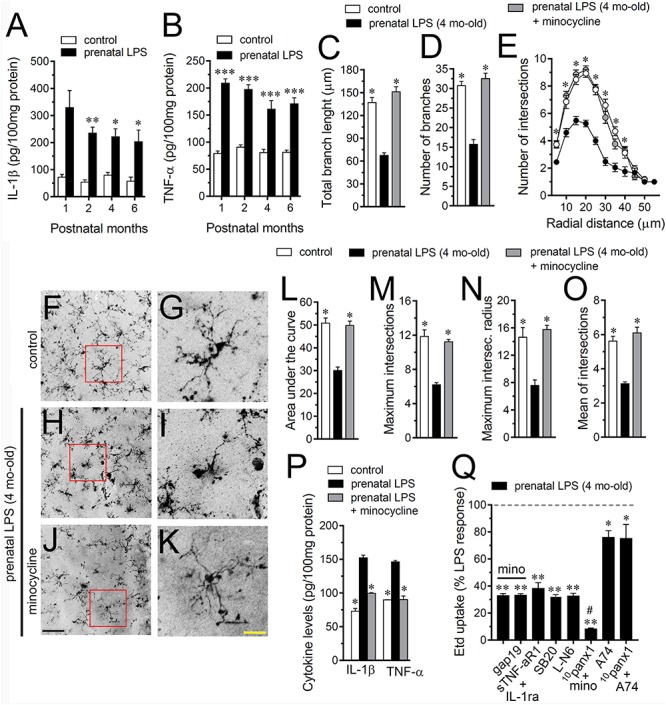
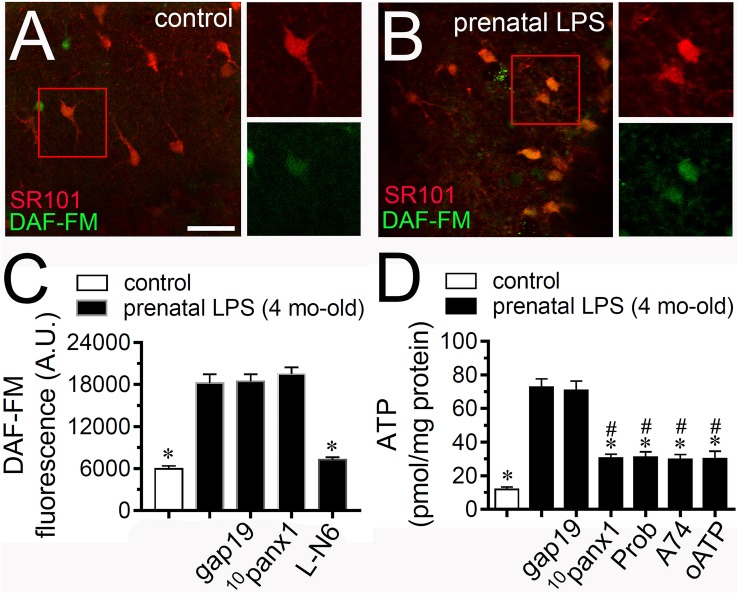
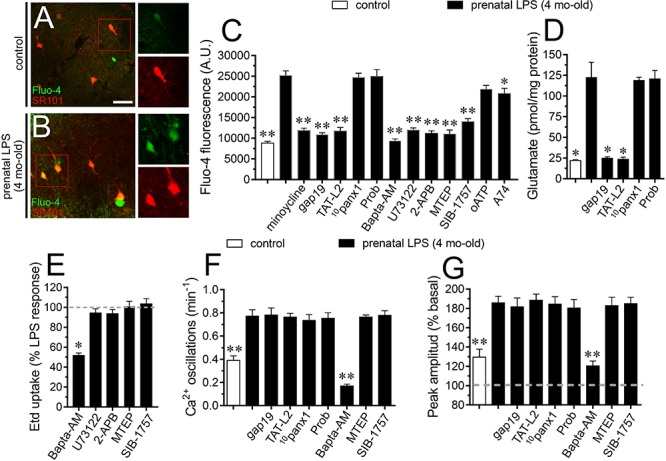
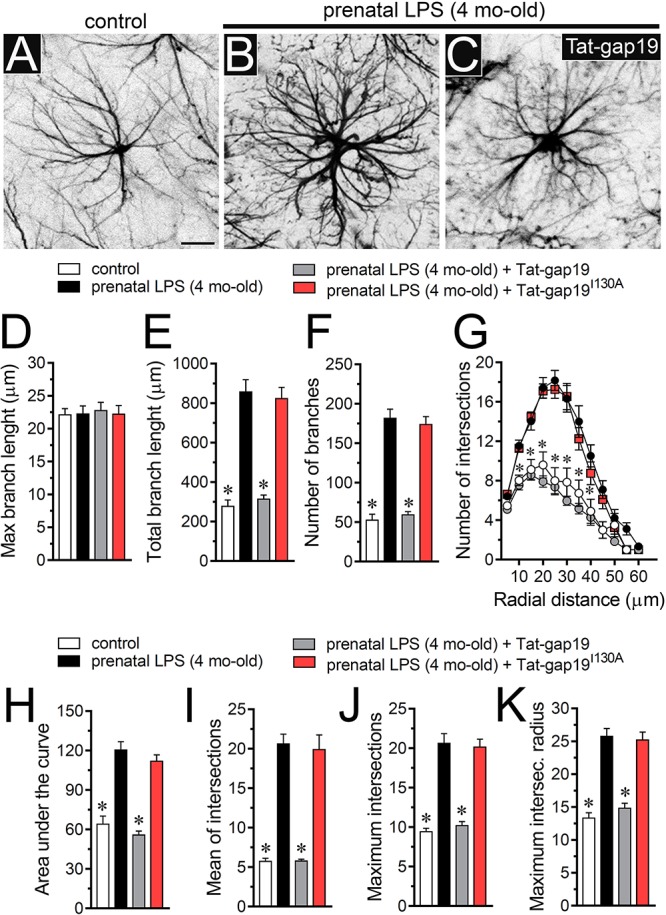
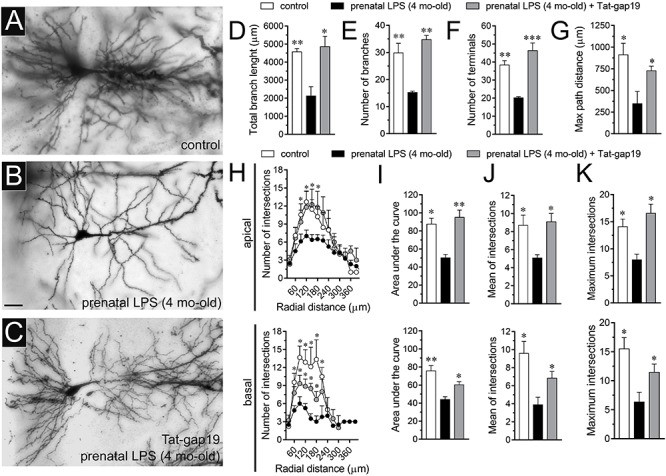
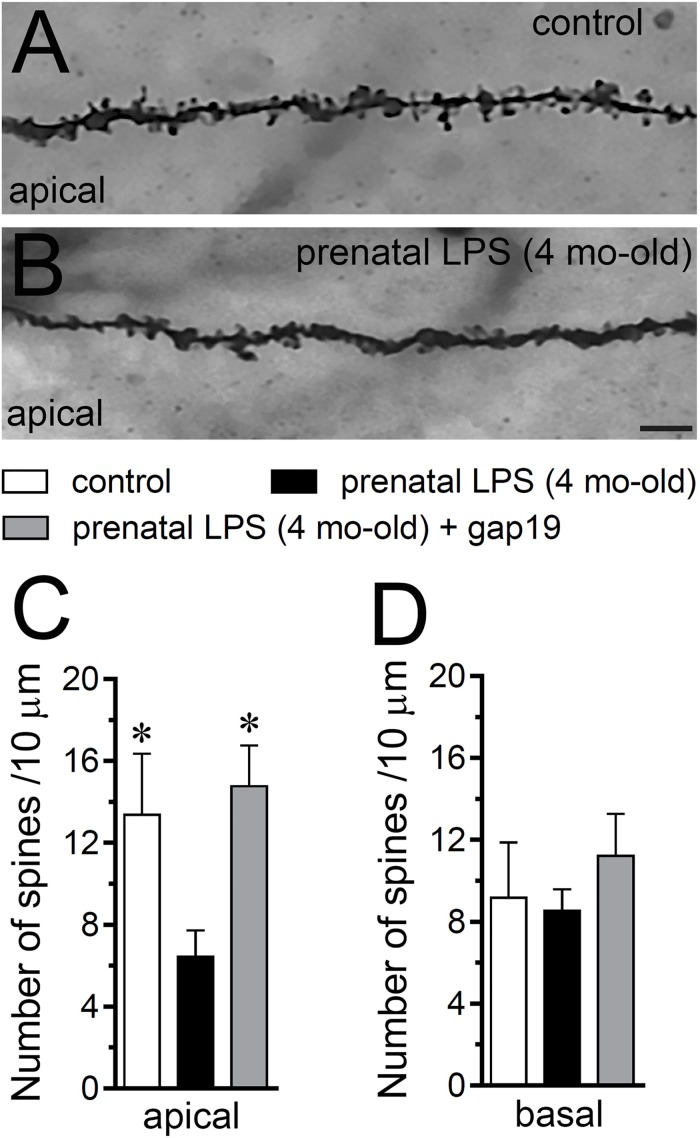
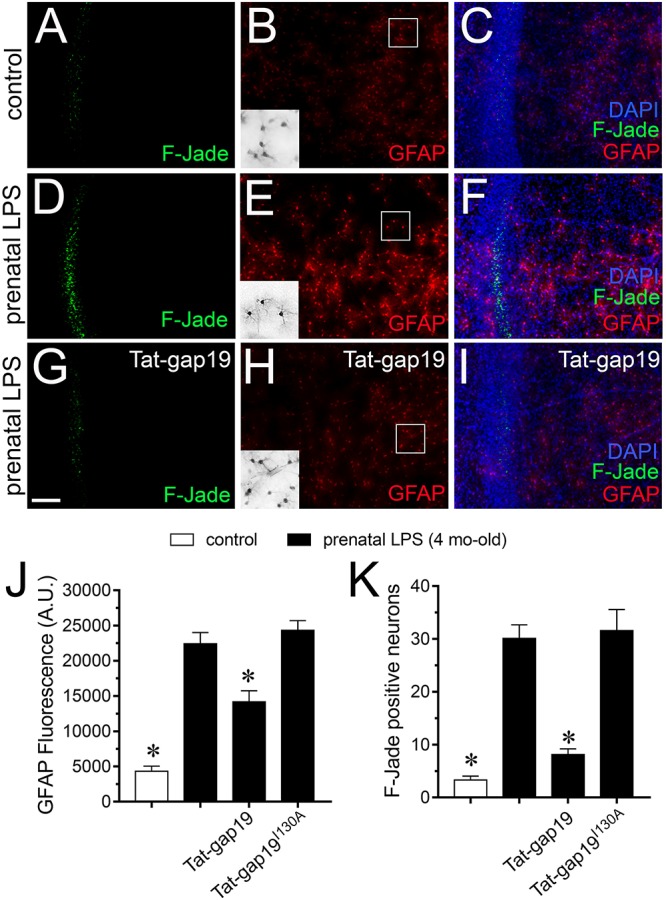
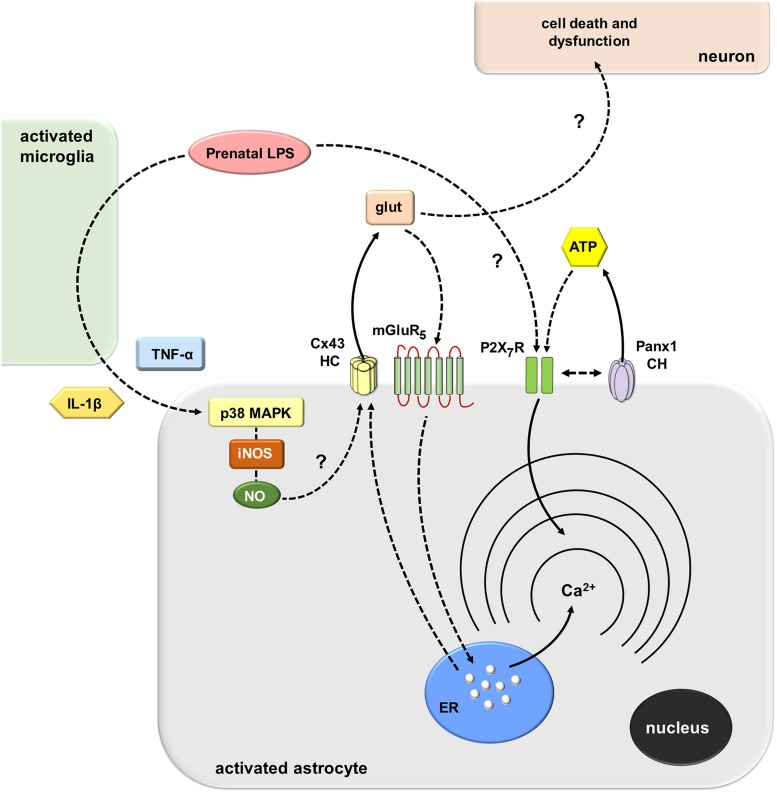
Clinical evidence has revealed that children born from mothers exposed to viral and bacterial pathogens during pregnancy are more likely to suffer various neurological disorders including schizophrenia, autism bipolar disorder, major depression, epilepsy, and cerebral palsy. Despite that most research has centered on the impact of prenatal inflammation in neurons and microglia, the potential modifications of astrocytes and neuron-astrocyte communication have received less scrutiny. Here, we evaluated whether prenatally LPS-exposed offspring display alterations in the opening of astrocyte hemichannels and pannexons in the hippocampus, together with changes in neuroinflammation, intracellular Ca2+ and nitric oxide (NO) signaling, gliotransmitter release, cell arborization, and neuronal survival. Ethidium uptake recordings revealed that prenatal LPS exposure enhances the opening of astrocyte Cx43 hemichannels and Panx1 channels in the hippocampus of adult offspring mice. This enhanced channel activity occurred by a mechanism involving a microglia-dependent production of IL-1β/TNF-α and the stimulation of p38 MAP kinase/iNOS/[Ca2+]i-mediated signaling and purinergic/glutamatergic pathways. Noteworthy, the activity of Cx43 hemichannels affected the release of glutamate, [Ca2+]i handling, and morphology of astrocytes, whereas also disturbed neuronal function, including the dendritic arbor and spine density, as well as survival. We speculate that excitotoxic levels of glutamate triggered by the activation of Cx43 hemichannels may contribute to hippocampal neurotoxicity and damage in prenatally LPS-exposed offspring. Therefore, the understanding of how astrocyte-neuron crosstalk is an auspicious avenue toward the development of broad treatments for several neurological disorders observed in children born to women who had a severe infection during gestation.

Keywords: connexin; glia; hemichannel; neuroinflammation; pannexin.


Figures

FIGURE 1
FIGURE 1
Prenatal LPS exposure augments the activity of Cx43 hemichannels and Panx1 channels by astrocytes on offspring hippocampus. Representative images showing GFAP (green), Etd (red) and DAPI (blue) staining in the hippocampus of control offspring (A) or prenatally LPS-exposed offspring (B) of 4 months old. Insets of astrocytes were taken from the area depicted within the yellow squares in (A,B). (C) Averaged data of Etd uptake normalized to control conditions (dashed line) by hippocampal astrocytes in acute slices from prenatally LPS-exposed offspring after following different postnatal periods. ∗∗p < 0.0001, p < 0.001 versus control, one-way ANOVA Tukey’s post hoc test, mean ± S.E.M., n = 3. (D) Averaged data normalized to the maximal effect (dashed line) induced by prenatal LPS exposure on Etd uptake by hippocampal astrocytes in acute slices from 4 months old offspring exposed to the following pharmacological agents: 100 μM Tat-L2, 100 μM Tat-L2H126K/I130N, 100 μM gap19, 100 μM gap19I130A, 100 μM 10panx1, 100 μM 10panx1scrb and 500 μM Probenecid (Prob). ∗∗p < 0.0001, p < 0.05 versus LPS, one-way ANOVA Tukey’s post hoc test, mean ± S.E.M., n = 3. Calibration bars: white bar = 180 μm; yellow bar: 100 μm.
FIGURE 2
FIGURE 2
Microglia and IL-1β/TNF-α/p38 MAP kinase/iNOS signaling participate in the prenatal LPS-induced opening of astrocyte Cx43 hemichannels on offspring hippocampus. Averaged data of hippocampal levels of IL-1β (A) and TNF-α (B) from control offspring (white bars) or prenatally LPS-exposed offspring (black bars) following different postnatal periods. ∗∗∗p < 0.0001, ∗∗p < 0.005, p < 0.05 versus control, two-way ANOVA Bonferroni’s post hoc test, mean ± S.E.M., n = 3. (C,D) Averaged data of total branch length (C) and number of branches (D) by hippocampal microglia in acute slices from control offspring (white bars) or prenatally LPS-exposed offspring (black bars) of 4 months old. Also shown are the effects of treatment with 50 nM minocycline for 2 h in acute slices prenatally LPS-exposed offspring of 4 months old (gray bars). p < 0.0001 versus LPS, one-way ANOVA Dunnett’s post hoc test, mean ± S.E.M., n = 3. (E) Averaged data of Sholl analysis by hippocampal microglia from control offspring (white circles) or prenatally LPS-exposed offspring of 4 months old alone (black circles) or plus treatment with 50 nM minocycline (gray circles). p < 0.001 versus LPS, two-way ANOVA Tukey’s post hoc test, mean ± S.E.M., n = 3. (F–K) Representative Iba-1 (black) positive hippocampal microglia in acute slices from control offspring (F,G) or prenatally LPS-exposed offspring of 4 months old alone (H,I) or plus treatment with 50 nM minocycline (J,K). Insets of microglia (G,I,K) were taken from the area depicted within the red squares in (F,H,J). (L–O) Averaged data of area under the curve of Sholl analysis (L), maximum intersection (M), maximum intersection radius (N), and mean of intersections (O) by hippocampal microglia from control offspring (white bars) or prenatally LPS-exposed offspring of 4 months old alone (black bars) or plus treatment with 50 nM minocycline (gray bars). p < 0.0001 versus LPS, one-way ANOVA Dunnett’s post hoc test, mean ± S.E.M., n = 3. (P) Averaged data of hippocampal levels of IL-1β and TNF-α from control offspring (white bars) or prenatally LPS-exposed offspring of 4 months old alone (black bars) or plus treatment with 50 nM minocycline (gray bars). ∗∗∗p < 0.0001, versus control, two-way ANOVA Bonferroni’s post hoc test, mean ± S.E.M., n = 3. (Q) Averaged data normalized to the maximal effect (dashed line) induced by prenatal LPS exposure on Etd uptake by hippocampal astrocytes in acute slices from 4 months old offspring exposed to the following pharmacological agents: 50 nM minocycline, 50 nM minocycline + 100 μM gap19, sTNF-αR1 + IL-1ra (300 ng/ml each), 1 μM SB203580, 1 μM L-N6, 50 nM minocycline + 100 μM 10panx1, 200 nM A740003 or 100 μM 10panx1 + 200 nM A740003. ∗∗p < 0.0001, p < 0.005 versus LPS, #p < 0.0001 versus minocycline, one-way ANOVA Dunnett’s post hoc test, mean ± S.E.M., n = 3. Calibration bars: black bar = 180 μm; yellow bar: 80 μm.
FIGURE 3
FIGURE 3
Prenatal LPS exposure increases the production of NO by astrocytes and the Panx1 channel-dependent release of ATP on offspring hippocampus. Representative images showing SR101 (red) and DAF-FM (green) staining by hippocampal astrocytes in acute slices from control offspring (A) or prenatally LPS-exposed offspring (B) of 4 months old. Insets of astrocytes were taken from the area depicted within the red squares in (A,B). (C) Averaged of DAF-FM signal fluorescence by astrocytes in acute slices from control offspring (white bar) or prenatally LPS-exposed offspring of 4 months old alone (black bars) or in combination with the following pharmacological agents: 100 μM gap19, 100 μM 10panx1 and 1 μM L-N6. p < 0.0001 versus LPS, one-way ANOVA Tukey’s post hoc test, mean ± S.E.M., n = 3. (D) Averaged data of ATP release by acute hippocampal slices from control offspring (white bar) or prenatally LPS-exposed offspring of 4 months old alone (black bars) or in combination with the following blockers: 100 μM gap19, 100 μM 10panx1 and 1 μM L-N6. p < 0.0001 versus LPS, #p < 0.0001 versus control, one-way ANOVA Tukey’s post hoc test, mean ± S.E.M., n = 3. Calibration bar = 85 μm.
FIGURE 4
FIGURE 4
Prenatal LPS-induced opening of Cx43 hemichannels increases [Ca2+]i and glutamatergic signaling on offspring hippocampus. Representative images showing SR101 (red) and Fluo-3 (green) staining by hippocampal astrocytes in acute slices from control offspring (A) or prenatally LPS-exposed offspring (B) of 4 months old. Insets of astrocytes were taken from the area depicted within the red squares in (A,B). (C) Averaged of basal Fluo-4 signal fluorescence by hippocampal astrocytes in acute slices from control offspring (white bar) or prenatally LPS-exposed offspring of 4 months old alone (black bars) or in combination with the following pharmacological agents: 50 nM minocycline, 100 μM gap19, 100 μM Tat-L2, 100 μM 10panx1, 500 μM Probenecid (Prob), 10 μM Bapta-AM, 5 μM U-73122, 50 μM 2-APB, 50 nM MTEP, 5 μM SIB-1757, 200 μM oATP and 200 nM A740003. ∗∗p < 0.0001, p < 0.005 versus LPS, one-way ANOVA Tukey’s post hoc test, mean ± S.E.M., n = 3. (D) Averaged data of glutamate release by acute hippocampal slices from control offspring (white bar) or prenatally LPS-exposed offspring of 4 months old alone (black bars) or in combination with the following blockers: 100 μM gap19, 100 μM Tat-L2, 100 μM 10panx1, 500 μM Probenecid (Prob). p < 0.0001 versus LPS, one-way ANOVA Tukey’s post hoc test, mean ± S.E.M., n = 3. (E) Averaged data normalized to the maximal effect (dashed line) induced by prenatal LPS exposure on Etd uptake by hippocampal astrocytes in acute slices from 4 months old offspring exposed to the following pharmacological agents: 10 μM Bapta-AM, 5 μM U-73122, 50 μM 2-APB, 50 nM MTEP, and 5 μM SIB-1757. p < 0.0001 versus LPS, one-way ANOVA Tukey’s post hoc test, mean ± S.E.M., n = 3. (F) Averaged of spontaneous [Ca2+]i oscillations by hippocampal astrocytes in acute slices from control offspring (white bar) or prenatally LPS-exposed offspring of 4 months old alone (black bars) or in combination with the following pharmacological agents: 100 μM gap19, 100 μM Tat-L2, 100 μM 10panx1, 500 μM Probenecid (Prob), 10 μM Bapta-AM, 50 nM MTEP or 5 μM SIB-1757. ∗∗p < 0.005 versus LPS, one-way ANOVA Tukey’s post hoc test, mean ± S.E.M., n = 3. (G) Averaged of peak amplitude of spontaneous [Ca2+]i oscillations by hippocampal astrocytes in acute slices from control offspring (white bar) or prenatally LPS-exposed offspring of 4 months old alone (black bars) or in combination with the following pharmacological agents: 100 μM gap19, 100 μM Tat-L2, 100 μM 10panx1, 500 μM Probenecid (Prob), 10 μM Bapta-AM, 50 nM MTEP or 5 μM SIB-1757. ∗∗p < 0.005 versus LPS, one-way ANOVA Tukey’s post hoc test, mean ± S.E.M., n = 3. Calibration bar = 85 μm.
FIGURE 5
FIGURE 5
Prenatal LPS exposure increases the arborization of hippocampal astrocytes in the offspring by a mechanism involving the activation of Cx43 hemichannels. (A–C) Representative GFAP (black) positive hippocampal astrocytes from control offspring (A) or prenatally LPS-exposed offspring of 4 months old alone (B) or plus the in vivo administration of 23 mg/kg Tat-gap19 (C). (D–F) Averaged data of maximum branch length (D), total branch length (E) and number of branches (F) by hippocampal astrocytes in acute slices from control offspring (white bars) or prenatally LPS-exposed offspring (black bars) of 4 months old. Also shown are the effects of in vivo administration of 23 mg/kg Tat-gap19 (gray bars) or its inactive form: 23 mg/kg Tat-gap19I130A (red bars). p < 0.0001 versus LPS, one-way ANOVA Dunnett’s post hoc test, mean ± S.E.M., n = 3. (G) Averaged data of Sholl analysis by hippocampal astrocytes from control offspring (white circles) or prenatally LPS-exposed offspring of 4 months old alone (black circles) or plus the in vivo administration of 23 mg/kg Tat-gap19 (gray circles) or 23 mg/kg Tat-gap19I130A (red circles). p < 0.001 versus LPS, two-way ANOVA Tukey’s post hoc test, mean ± S.E.M., n = 3. (H–K) Averaged data of area under the curve of Sholl analysis (H), maximum intersection (I), maximum intersection radius (J), and mean of intersections (K) by hippocampal astrocytes from control offspring (white bars) or prenatally LPS-exposed offspring of 4 months old alone (black bars) or plus the in vivo administration of 23 mg/kg Tat-gap19 (gray bars) or 23 mg/kg Tat-gap19I130A (red bars). p < 0.0001 versus LPS, one-way ANOVA Dunnett’s post hoc test, mean ± S.E.M., n = 3. Calibration bar = 40 μm.
FIGURE 6
FIGURE 6
Prenatal LPS exposure increases the arborization of CA1 pyramidal neurons in the offspring by a mechanism involving the activation of Cx43 hemichannels. (A–C) Representative golgi (black) staining by CA1 pyramidal neurons from control offspring (A), prenatally LPS-exposed offspring of 4 month old alone (B) or in combination with the in vivo administration of 23 mg/kg Tat-gap19 (C). (D–G) Averaged data of total branch length (D), number of branches (E), number of terminals (F), and maximum path distance (G) by CA1 pyramidal neurons from control offspring (white bars) or prenatally LPS-exposed offspring of 4 months old alone (black bars) or in combination with the in vivo administration of 23 mg/kg Tat-gap19 (gray bars). p < 0.05, ∗∗p < 0.01, ∗∗∗p < 0.005 versus LPS, one-way ANOVA Dunnett’s post hoc test, mean ± S.E.M., n = 3. (H) Averaged data of Sholl analysis by apical (upper panel) and basal (bottom panel) dendritic arbor of CA1 pyramidal neurons from control offspring (white circles) or prenatally LPS-exposed offspring of 4 months old alone (black circles) or plus the in vivo administration of 23 mg/kg Tat-gap19 (gray circles). p < 0.05 versus LPS, two-way ANOVA Tukey’s post hoc test, mean ± S.E.M., n = 3. (I–K) Averaged data of area under the curve of Sholl analysis (I), mean of intersections (J) and maximum intersection (K) by apical (upper panel) and basal (bottom panel) dendritic arbor of CA1 pyramidal neurons from control offspring (white bars) or prenatally LPS-exposed offspring of 4 months old alone (black bars) or plus the in vivo administration of 23 mg/kg Tat-gap19 (gray bars). p < 0.05, ∗∗p < 0.01 versus LPS, one-way ANOVA Tukey’s post hoc test, mean ± S.E.M., n = 3. Calibration bar = 45 μm.
FIGURE 7
FIGURE 7
Prenatal LPS exposure increases spine density in apical but not basal dendrites of CA1 pyramidal neurons, a response based on the activation of Cx43 hemichannels. (A,B) Representative golgi (black) staining by apical dendrites of CA1 pyramidal neurons from control offspring (A) or prenatally LPS-exposed offspring of 4 months old (B). (C,D) Averaged data of the number of apical (A) or basal (B) dendritic spines by CA1 pyramidal neurons from control offspring (white bars) or prenatally LPS-exposed offspring of 4 months old alone (black bars) or in combination with the in vivo administration of 23 mg/kg Tat-gap19 (gray bars). p < 0.05 versus LPS, one-way ANOVA Tukey’s post hoc test, mean ± S.E.M., n = 3. Calibration bar = 3 μm.
FIGURE 8
FIGURE 8
Cx43 hemichannel contributes to neuronal death evoked by prenatal LPS exposure on offspring hippocampus. (A–I) Representative images depicting Fluoro-Jade (F-Jade, green), GFAP (red) and DAPI (blue) staining in acute slices from control offspring (A–C) or prenatally LPS-exposed offspring of 4 months old alone (D–F) or in combination with the in vivo administration of 23 mg/kg Tat-gap19 (G–I). Insets of gray scale GFAP staining for astrocytes are shown from the area depicted within the white squares in (B,E,H). (J) Averaged data of GFAP fluorescence per field in acute slices from control offspring (white bars) or prenatally LPS-exposed offspring of 4 months old alone (black bars) or in combination with the in vivo administration of 23 mg/kg Tat-gap19 (gray bars). p < 0.01 versus LPS, one-way ANOVA Tukey’s post hoc test, mean ± S.E.M., n = 3. (K) Averaged number of F-Jade-positive CA1 pyramidal neurons per field in acute slices from control offspring (white bars) or prenatally LPS-exposed offspring of 4 months old alone (black bars) or in combination with the in vivo administration of 23 mg/kg Tat-gap19 (gray bars). p < 0.001 versus LPS, one-way ANOVA Tukey’s post hoc test, mean ± S.E.M., n = 3. Calibration bar = 100 μm.
FIGURE 9
FIGURE 9
Schematic diagram showing the possible pathways involved in the prenatal LPS-induced activation of Cx43 hemichannels/Panx1 channels and its consequences for astroglial function and neuronal survival. Prenatal LPS exposure activates microglia, resulting in the release of IL-1β and TNF-α. Both cytokines stimulate astrocytes, leading to the activation of a p38MAPK/iNOS-dependent pathway and further production of NO. The latter likely induces unknown mechanisms that cause opening of Cx43 hemichannels enabling the release of glutamate. Glutamate released via Cx43 hemichannels activates mGluR5 receptors resulting in the stimulation of IP3 receptors and further release of Ca2+ stored in the endoplasmic reticulum. In parallel, the activation of astroglial P2X7 receptors lead to the opening of Panx1 channels and further release of ATP, possibly through direct protein-to-protein interactions. Relevantly, the modulation of [Ca2+]i dynamics evoked by Cx43 hemichannels may alter astroglial morphology (not depicted), whereas the excitotoxic release of glutamate through Cx43 hemichannels may affect neuronal arborization and survival by unknown mechanisms.

References

    1. Abudara V., Bechberger J., Freitas-Andrade M., De Bock M., Wang N., Bultynck G., et al. (2014). The connexin43 mimetic peptide Gap19 inhibits hemichannels without altering gap junctional communication in astrocytes. Front. Cell. Neurosci. 8:306. 10.3389/fncel.2014.00306 - DOI - PMC - PubMed
    1. Abudara V., Retamal M. A., Del Rio R., Orellana J. A. (2018). Synaptic functions of hemichannels and pannexons: a double-edged sword. Front. Mol. Neurosci. 11:435. 10.3389/fnmol.2018.00435 - DOI - PMC - PubMed
    1. Abudara V., Roux L., Dallerac G., Matias I., Dulong J., Mothet J. P., et al. (2015). Activated microglia impairs neuroglial interaction by opening Cx43 hemichannels in hippocampal astrocytes. Glia 63 795–811. 10.1002/glia.22785 - DOI - PubMed
    1. Agulhon C., Sun M. Y., Murphy T., Myers T., Lauderdale K., Fiacco T. A. (2012). Calcium signaling and gliotransmission in normal vs. reactive astrocytes. Front. Pharmacol. 3:139. 10.3389/fphar.2012.00139 - DOI - PMC - PubMed
    1. Ardiles A. O., Flores-Munoz C., Toro-Ayala G., Cardenas A. M., Palacios A. G., Munoz P., et al. (2014). Pannexin 1 regulates bidirectional hippocampal synaptic plasticity in adult mice. Front. Cell. Neurosci. 8:326. 10.3389/fncel.2014.00326 - DOI - PMC - PubMed