. 2019 Oct 15:11:29.
doi: 10.3389/fnsyn.2019.00029. eCollection 2019.

Estimating the Readily-Releasable Vesicle Pool Size at Synaptic Connections in the Neocortex

Affiliations

Estimating the Readily-Releasable Vesicle Pool Size at Synaptic Connections in the Neocortex

Natalí Barros-Zulaica et al. Front Synaptic Neurosci. .

Abstract

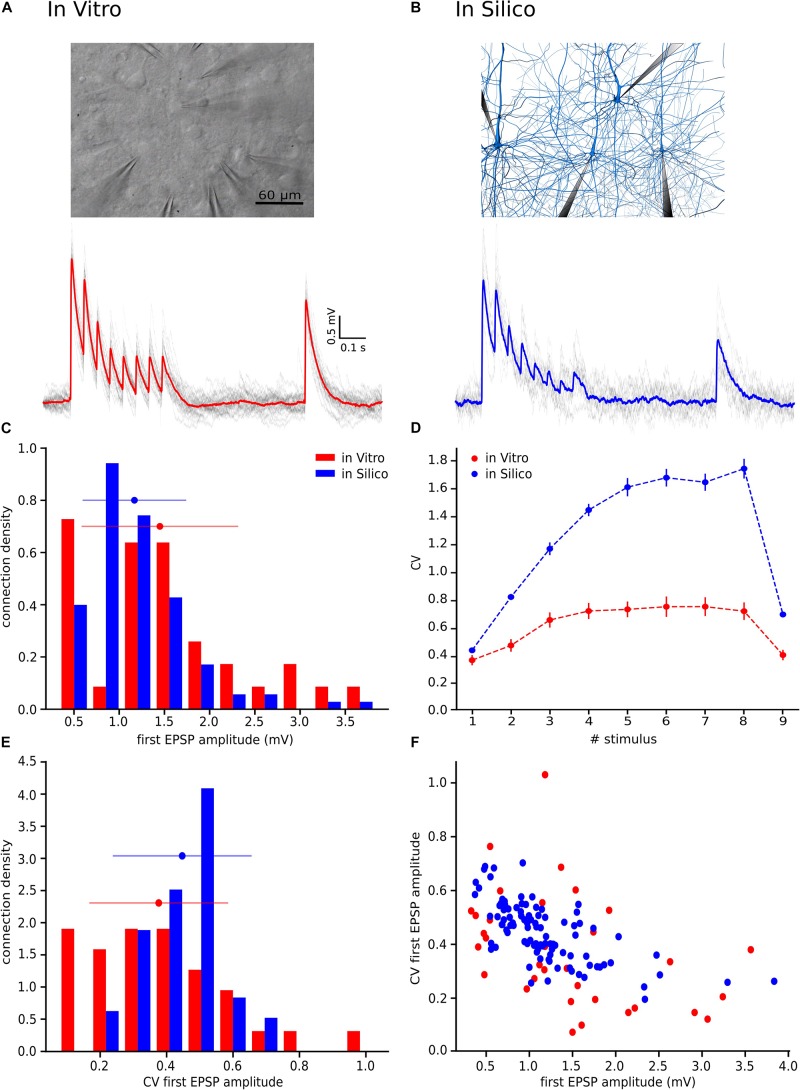
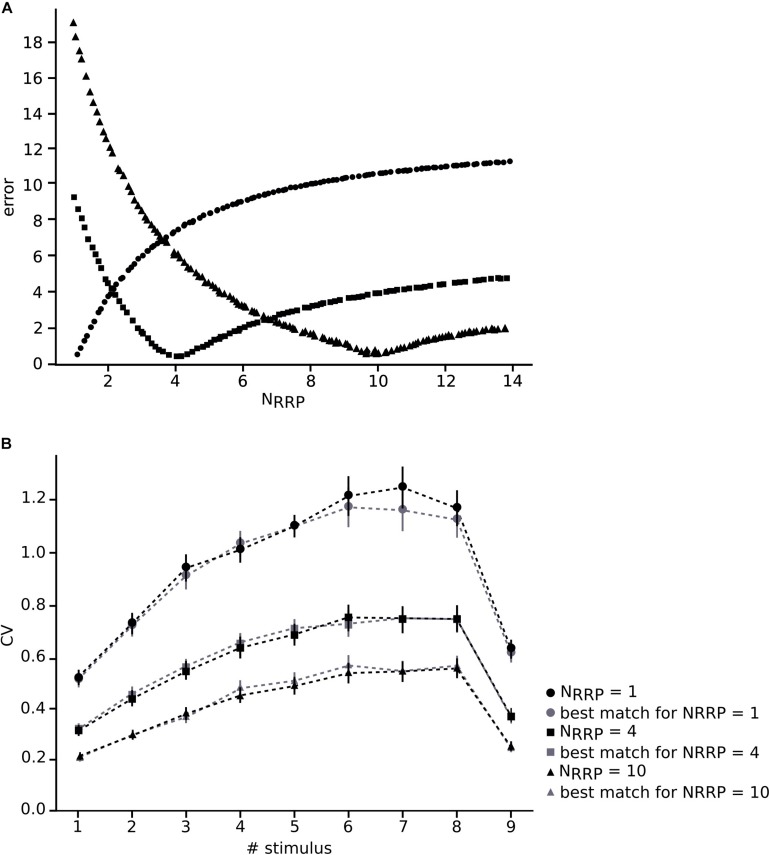
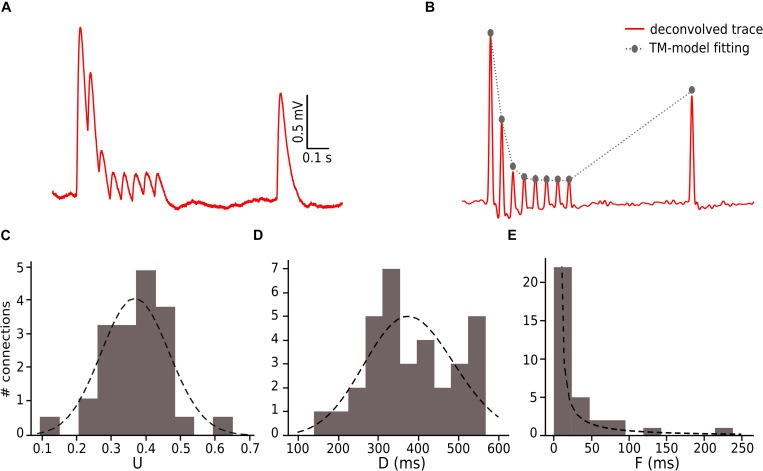
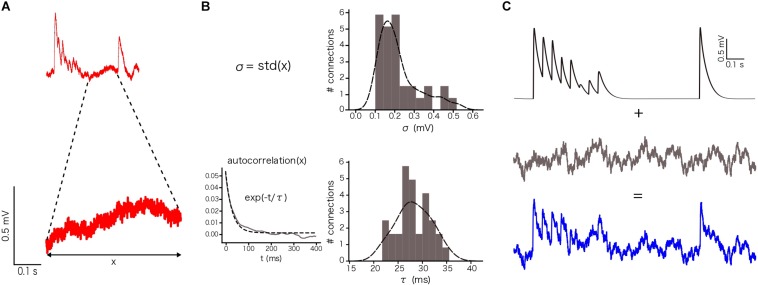
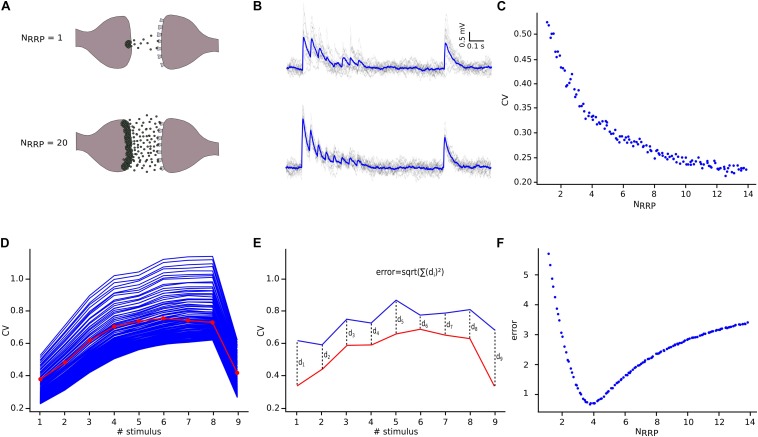
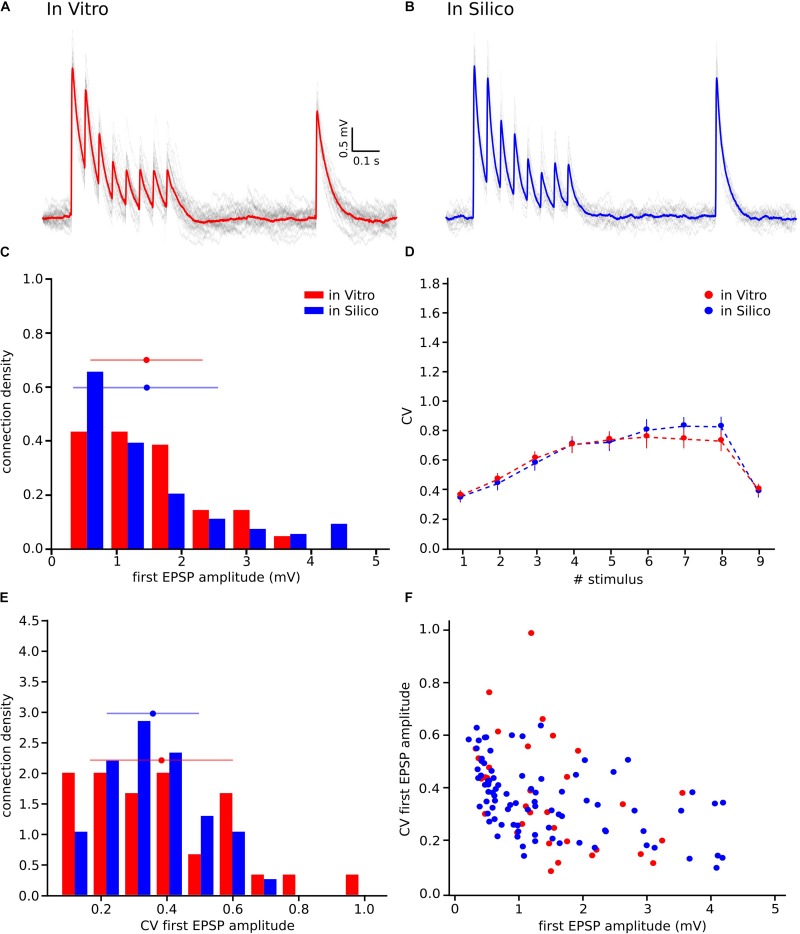
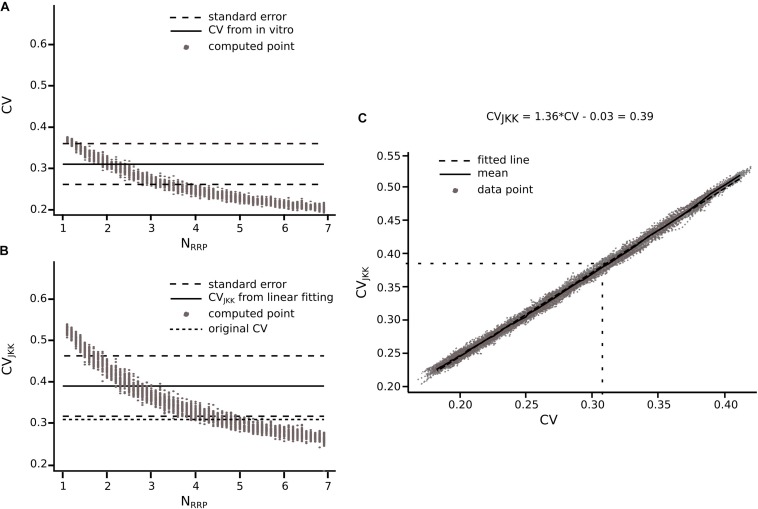
Previous studies based on the 'Quantal Model' for synaptic transmission suggest that neurotransmitter release is mediated by a single release site at individual synaptic contacts in the neocortex. However, recent studies seem to contradict this hypothesis and indicate that multi-vesicular release (MVR) could better explain the synaptic response variability observed in vitro. In this study we present a novel method to estimate the number of release sites per synapse, also known as the size of the readily releasable pool (NRRP), from paired whole-cell recordings of connections between layer 5 thick tufted pyramidal cell (L5_TTPC) in the juvenile rat somatosensory cortex. Our approach extends the work of Loebel et al. (2009) by leveraging a recently published data-driven biophysical model of neocortical tissue. Using this approach, we estimated NRRP to be between two to three for synaptic connections between L5_TTPCs. To constrain NRRP values for other connections in the microcircuit, we developed and validated a generalization approach using published data on the coefficient of variation (CV) of the amplitudes of post-synaptic potentials (PSPs) from literature and comparing them against in silico experiments. Our study predicts that transmitter release at synaptic connections in the neocortex could be mediated by MVR and provides a data-driven approach to constrain the MVR model parameters in the microcircuit.

Keywords: mathematical model; multi vesicular release; neocortex; quantal analysis; short-term depression; synaptic transmission.


Figures

FIGURE 1
FIGURE 1
With the UVR hypothesis it was not possible to reproduce the variability observed in vitro. (A) Example of a multiple whole cell patch-clamp recording in L5_TTPC connections (top). In vitro mean voltage trace (bottom; red) of 20 protocol repetitions (gray). (B) Illustration of an in silico patch-clamp experiment performed on L5_TTPC connections from the data-driven model of the rat cortex microcolumn. In silico mean voltage trace (bottom; blue) of 20 protocol repetitions (gray). (C) Histogram showing the distribution of the first EPSP amplitude for in vitro (red) and for in silico (blue) experiments. (D) Mean CV profiles for the in vitro (red) and the in silico (blue) experiments. (E) CV distribution of the first EPSP amplitude for in vitro (red) and in silico (blue) data sets. (F) Raster plot of the first EPSP amplitude against the CV of the first EPSP amplitude for in vitro (red) and in silico (blue) experiments. In the distributions and the CV profile, dots represent the mean and vertical and horizontal bars represent the standard deviation of all the experiments respectively.
FIGURE 2
FIGURE 2
Validating the method. (A) Varying NRRP against error for the different in silico data sets around the appropriate corresponding NRRP (dots, NRRP = 1; squares, NRRP = 4; triangles, NRRP = 10). (B) Mean CV profiles of the three different in silico data sets (black) and the simulations (gray). Dots, squares and triangles represent the mean while the error bars show the standard deviation.
FIGURE 3
FIGURE 3
Fitting in vitro data to the TM-model. (A) Example of an in vitro mean voltage trace of L5_TTPC connection. (B) Corresponding deconvolved voltage trace (red) with the fit to the deterministic TM-model (gray). (C) Distribution of the probability of release parameter (U), (D) distribution of the time to recovery from depression (D) and (E) distribution of the time to recovery from facilitation (F). Values obtained from the fitting to the TM-model of 33 in vitro connections.
FIGURE 4
FIGURE 4
Noise calibration. (A) Example of an in vitro single protocol repetition (top). Zoom over 400 ms segment used to compute the parameters for noise calibration (bottom). (B) Distribution of σ (up) and τ (bottom). σ was computed as the standard deviation of the voltage segment. τ was computed by fitting the voltage segment autocorrelation to an exponential. The distributions show the mean values for the 33 in vitro connections. (C) (up) Single in silico trace without noise, (middle) OU-process generated to be added to the single in silico trace and (bottom) the noisy single protocol repetition that is the result of adding the previous two traces.
FIGURE 5
FIGURE 5
NRRP computation. (A) Illustration showing one synaptic connection releasing neuro transmitters from only one vesicle (top) and the same synaptic connection releasing neurotransmitters from twenty vesicles (bottom). (B) The corresponding effect of releasing neurotransmitters from one (top) or from twenty (bottom) vesicles reflected on the variability and shape of the in silico traces. The mean voltage traces are painted in blue while each protocol repetition is represented in gray. (C) Diagram showing the effect of NRRP over the CV. (D) Mean CV profile for the in vitro (red) and all the in silico connections with different NRRP values. (E) Diagram explaining the mean square distance computation. (F) NRRP against error, showed a clear minimum around the value obtained for this specific connection.
FIGURE 6
FIGURE 6
Releasing multiple vesicles improved the variability of the model. (A) In vitro mean voltage trace (red) of 20 protocol repetitions (gray) (same as in Figure 1A). (B) In silico mean voltage trace (blue) of 20 protocol repetitions (gray). (C) Distribution of the first EPSP amplitude for in vitro (red) and for the in silico (blue) experiments. (D) Mean CV profiles for the in vitro (red) and the in silico (blue) experiments. (E) CV Distribution of the first EPSP amplitude for in vitro (red) and the in silico (blue) data sets. (F) Raster plot of the first EPSP amplitude against the CV of the first EPSP amplitude for in vitro (red) and in silico (blue) experiments. All the in silico experiments are done with the NRRP value that produces the minimum error. In the distributions and the CV profile, dots represent the mean and vertical and horizontal bars represent the standard deviation of all the experiments.
FIGURE 7
FIGURE 7
Extension of the method for connections reported in literature. Transformation from CV to CVJKK using L5_TTPC connection as example (A) CV computed for different NRRP. Solid black line represents the CV computed for the in vitro data. Dotted black lines represent the standard error of the CV. (B) CVJKK computed for different NRRP. Solid black line represents the CVJKK obtained from the lineal fitting on C. Dotted black lines represent the standard error for this CVJKK. Short dotted black line represents the original CV found in literature. (C) CV to CVJKK transformation. Solid black line represents the mean of the 50 iterations and dotted black line represent the linear fitting which equation is at the top of the plot. In (A,B) the gray dots show the 50 iterations from which we extract the best NRRP as the one corresponding with the closest CV.

References

    1. Auger C., Kondo S., Marty A. (1998). Multivesicular release at single functional synaptic sites in cerebellar stellate and basket cells. J. Neurosci. 18 4532–4547. 10.1523/jneurosci.18-12-04532.1998 - DOI - PMC - PubMed
    1. Auger C., Marty A. (2000). Quantal currents at single-site central synapses. J. Physiol. 526(Pt 1), 3–11. 10.1111/j.1469-7793.2000.t01-3-00003.x - DOI - PMC - PubMed
    1. Azouz R., Gray C. M. (1999). Cellular mechanisms contributing to response variability of cortical neurons in vivo. J. Neurosci. 19 2209–2223. 10.1523/jneurosci.19-06-02209.1999 - DOI - PMC - PubMed
    1. Betz W. J. (1970). Depression of transmitter release at the neuromuscular junction of the frog. J. Physiol. 206 629–644. 10.1113/jphysiol.1970.sp009034 - DOI - PMC - PubMed
    1. Bibbona E. (2008). The Ornstein-Uhlenbeck process as a model of a low-pass filtered white noise. Metrologia 45 S117–S126.

LinkOut - more resources