

Atypical Temporal Dynamics of Resting State Shapes Stimulus-Evoked Activity in Depression-An EEG Study on Rest-Stimulus Interaction
- PMID: 31681034
- PMCID: PMC6803442
- DOI: 10.3389/fpsyt.2019.00719
Atypical Temporal Dynamics of Resting State Shapes Stimulus-Evoked Activity in Depression-An EEG Study on Rest-Stimulus Interaction
Abstract
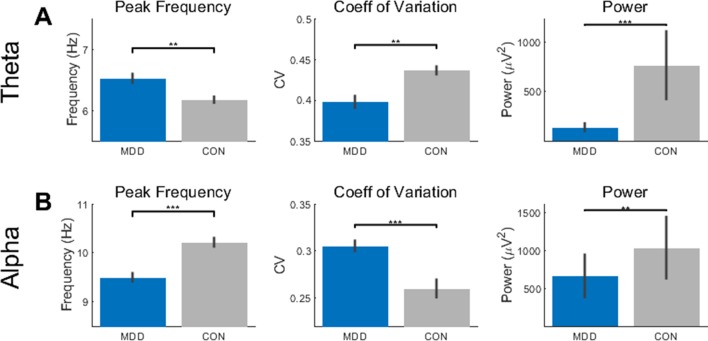
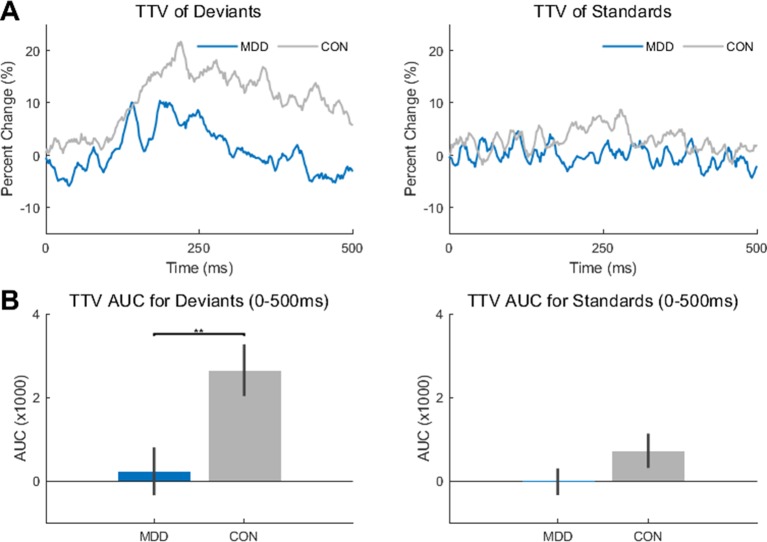
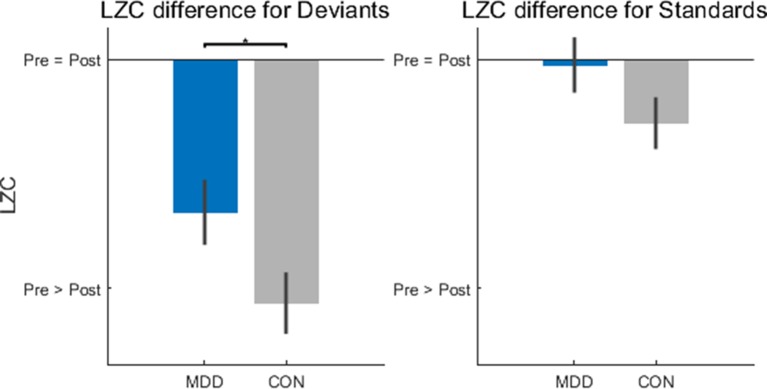
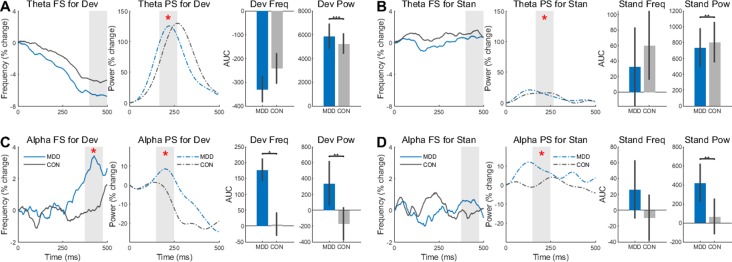
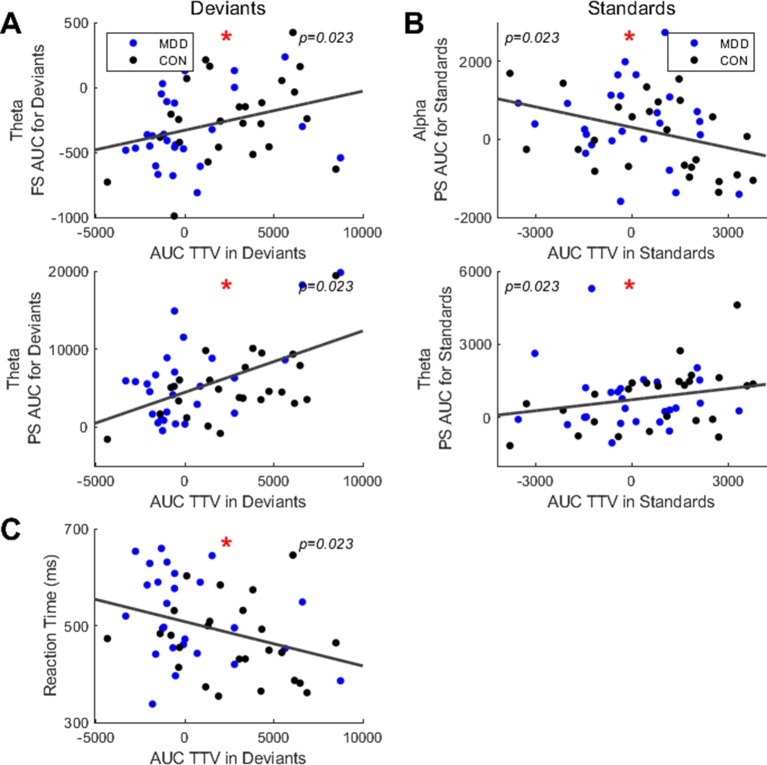
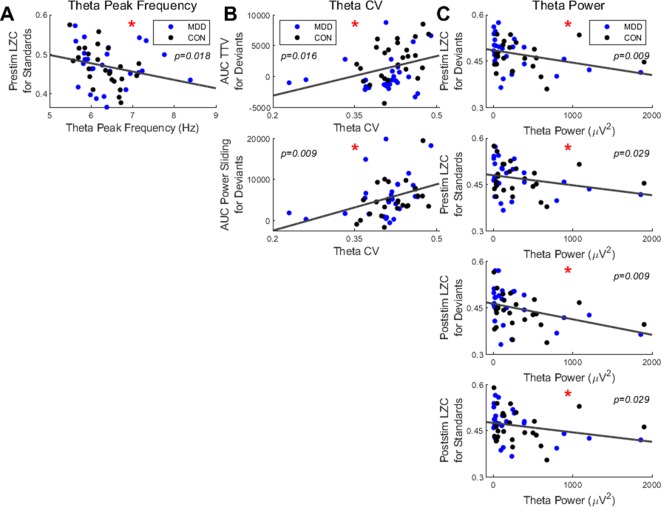
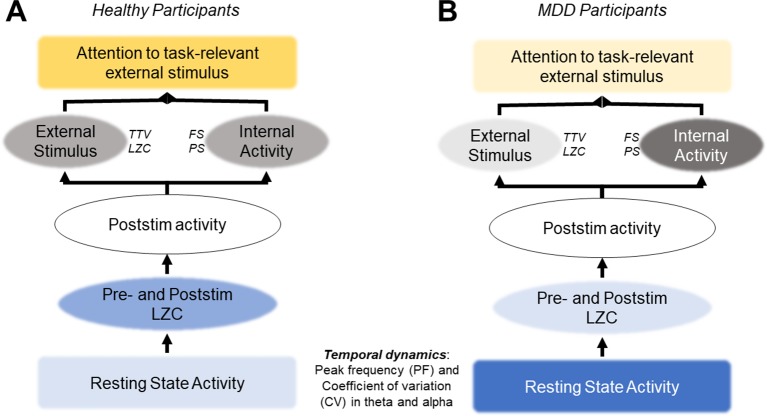
Major depressive disorder (MDD) is a complex psychiatric disorder characterized by changes in both resting state and stimulus-evoked activity. Whether resting state changes are carried over to stimulus-evoked activity, however, is unclear. We conducted a combined rest (3 min) and task (three-stimulus auditory oddball paradigm) EEG study in n=28 acute depressed MDD patients, comparing them with n=25 healthy participants. Our focus was on the temporal dynamics of both resting state and stimulus-evoked activity for which reason we measured peak frequency (PF), coefficient of variation (CV), Lempel-Ziv complexity (LZC), and trial-to-trial variability (TTV). Our main findings are: i) atypical temporal dynamics in resting state, specifically in the alpha and theta bands as measured by peak frequency (PF), coefficient of variation (CV) and power; ii) decreased reactivity to external deviant stimuli as measured by decreased changes in stimulus-evoked variance and complexity-TTV, LZC, and power and frequency sliding (FS and PS); iii) correlation of stimulus related measures (TTV, LZC, PS, and FS) with resting state measures. Together, our findings show that resting state dynamics alone are atypical in MDD and, even more important, strongly shapes the dynamics of subsequent stimulus-evoked activity. We thus conclude that MDD can be characterized by an atypical temporal dynamic of its rest-stimulus interaction; that, in turn, makes it difficult for depressed patients to react to relevant stimuli such as the deviant tone in our paradigm.
Keywords: Depression; EEG; Peak frequency; alpha oscillations; resting state; theta oscillations.
Copyright © 2019 Wolff, de la Salle, Sorgini, Lynn, Blier, Knott and Northoff.
Figures
Similar articles
-
Neural variability quenching during decision-making: Neural individuality and its prestimulus complexity.Neuroimage. 2019 May 15;192:1-14. doi: 10.1016/j.neuroimage.2019.02.070. Epub 2019 Mar 4. Neuroimage. 2019. PMID: 30844503
-
Extending the "resting state hypothesis of depression" - dynamics and topography of abnormal rest-task modulation.Psychiatry Res Neuroimaging. 2021 Nov 30;317:111367. doi: 10.1016/j.pscychresns.2021.111367. Epub 2021 Aug 20. Psychiatry Res Neuroimaging. 2021. PMID: 34555652 Review.
-
Neural complexity in patients with poststroke depression: A resting EEG study.J Affect Disord. 2015 Dec 1;188:310-8. doi: 10.1016/j.jad.2015.09.017. Epub 2015 Sep 11. J Affect Disord. 2015. PMID: 26402253
-
Nonlinear analysis of EEGs of patients with major depression during different emotional states.Comput Biol Med. 2015 Dec 1;67:49-60. doi: 10.1016/j.compbiomed.2015.09.019. Epub 2015 Oct 9. Comput Biol Med. 2015. PMID: 26496702 Clinical Trial.
-
Spatiotemporal psychopathology I: No rest for the brain's resting state activity in depression? Spatiotemporal psychopathology of depressive symptoms.J Affect Disord. 2016 Jan 15;190:854-866. doi: 10.1016/j.jad.2015.05.007. Epub 2015 May 14. J Affect Disord. 2016. PMID: 26048657 Review.
Cited by
-
Toward naturalistic neuroscience: Mechanisms underlying the flattening of brain hierarchy in movie-watching compared to rest and task.Sci Adv. 2023 Jan 13;9(2):eade6049. doi: 10.1126/sciadv.ade6049. Epub 2023 Jan 13. Sci Adv. 2023. PMID: 36638163 Free PMC article.
-
The Role of Alpha Oscillations among the Main Neuropsychiatric Disorders in the Adult and Developing Human Brain: Evidence from the Last 10 Years of Research.Biomedicines. 2022 Dec 8;10(12):3189. doi: 10.3390/biomedicines10123189. Biomedicines. 2022. PMID: 36551945 Free PMC article. Review.
-
From the brain's encoding of input dynamics to its behavior: neural dynamics shape bias in decision making.Commun Biol. 2024 Nov 19;7(1):1538. doi: 10.1038/s42003-024-07235-w. Commun Biol. 2024. PMID: 39562707 Free PMC article.
-
Reduced signal propagation elicited by frontal transcranial magnetic stimulation is associated with oligodendrocyte abnormalities in treatment-resistant depression.J Psychiatry Neurosci. 2022 Sep 14;47(5):E325-E335. doi: 10.1503/jpn.220102. Print 2022 Sep-Oct. J Psychiatry Neurosci. 2022. PMID: 36104082 Free PMC article.
-
Differences in resting state and task-based EEG measures between patients with major depressive disorder and healthy controls.Clin Neurophysiol. 2025 May;173:190-198. doi: 10.1016/j.clinph.2025.03.022. Epub 2025 Mar 24. Clin Neurophysiol. 2025. PMID: 40153921 Free PMC article.
References
-
- Beck AT, Alford BA. Depression: Causes and treatment. 2nd ed University of Pennsylvania Press; (2009). Vol. xxi p. 405.
LinkOut - more resources
Full Text Sources