. 2019 Oct 15:10:1069.
doi: 10.3389/fneur.2019.01069. eCollection 2019.

Acute MR-Guided High-Intensity Focused Ultrasound Lesion Assessment Using Diffusion-Weighted Imaging and Histological Analysis

Affiliations

Acute MR-Guided High-Intensity Focused Ultrasound Lesion Assessment Using Diffusion-Weighted Imaging and Histological Analysis

Matthew R Walker et al. Front Neurol. .

Abstract

Objectives: The application of magnetic resonance-guided focused ultrasound (MRgFUS) for the treatment of neurological conditions has been of increasing interest. Conventional MR imaging can provide structural information about the effect of MRgFUS, where differences in ablated tissue can be seen, but it lacks information about the status of the cellular environment or neural microstructure. We investigate in vivo acute changes in water diffusion and white matter tracts in the brain of a piglet model after MRgFUS treatment using diffusion-weighted imaging (DWI) with histological verification of treatment-related changes. Methods: MRgFUS was used to treat the anterior body of the fornix in four piglets. T1 and diffusion-weighted images were collected before and after treatment. Mean diffusion-weighted imaging (MDWI) images were generated to measure lesion volumes via signal intensity thresholds. Histological data were collected for volume comparison and assessment of treatment effect. DWI metric maps of fractional anisotropy (FA), apparent diffusion coefficient (ADC), axial diffusivity (AD), radial diffusivity (RD), and mean diffusivity (MD) were generated for quantitative assessment. Fornix-related fiber tracts were generated before and after treatment for qualitative assessment. Results: The volume of treated tissue measured via MDWI did not differ significantly from histological measurements, and both were significantly larger than the treatment cell volume. Diffusion metrics in the treatment region were significantly decreased following MRgFUS treatment, with the peak change seen at the lesion core and decreasing radially. Histological analysis confirmed an area of coagulative necrosis in the targeted region with sharp demarcation zone with surrounding brain. Tractography from the lesion core and the fornix revealed fiber disruptions following treatment. Conclusions: Diffusion maps and fiber tractography are an effective method for assessing lesion volumes and microstructural changes in vivo following MRgFUS treatment. This study demonstrates that DWI has the potential to advance MRgFUS by providing convenient in vivo microstructural lesion and fiber tractography assessment after treatment.

Keywords: diffusion tensor imaging (DTI); diffusion weighted imaging (DWI); focused ultrasound; magnetic resonance-guided focused ultrasound (MRgFUS); tractography.


Figures

Figure 1
Figure 1
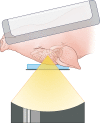
Schematic illustration of animal positioning during MRgFUS treatment.
Figure 2
Figure 2
Temperature map during MRgFUS treatment for a single subject in the sagittal view (Top), axial view (Middle), and coronal view (Bottom). Column 1 shows the treatment cell on the fornix. Columns 2–4 show the temperature maps after treatment with 40, 60, and 80W, respectively. In Row 1 of columns 2–4, skull-base heat deposition was present in the far-field region inferior to the target area, close to optic chiasm.
Figure 3
Figure 3
Mid-sagittal (A,B) T1-weighted and (C,D) MDWI images before and after MRgFUS treatment for a single subject. The target area appeared hypointense in the T1w image and hyperintense in the MDWI image after treatment.
Figure 4
Figure 4
(A) Whole mount view of a coronal section of a representative MRgFUS treated piglet brain stained with H&E and (B) the same section after computer-based lesion segmentation (see methods). (C) A similar coronal view MDWI image of the brain overlaid with the lesion mask in red. (D) Medium magnification image showing the zone between destroyed tissue, vacuolated tissue, and preserved tissue (scale bar represents 600 μm). (E) High-magnification image of the treated region. Tissue is disrupted centrally and at the margins shows coarse parenchymal and perivascular vacuolation and vascular distention (scale bar represents 200 μm). (F) High magnification of untreated tissue showing preserved white matter (scale bar represents 200 μm).
Figure 5
Figure 5
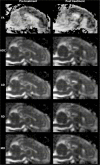
DWI metric maps (FA, ADC, AD, RD, and MD) before and after MRgFUS treatment for one subject. Hypointensity was present in all five metric maps after treatment.
Figure 6
Figure 6
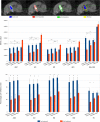
DWI metrics including ADC, AD, RD, MD, and FA in the lesion core, lesion boundary, outer boundary, and the reference region are shown pre- and post-treatment. (Top) Mid-sagittal slice of locations for different regions of interest (ROI). (Middle) Mean values within the ROIs for pre- and post-treatment. Asterisks represent the significant difference between the metric values in the lesion core, lesion boundary, and outer boundary after treatment, where *P < 0.05; **P < 0.01, ***P < 0.001. (Bottom) DWI metric values normalized over the value in the corresponding reference region, shown as percentage. Asterisks represent the significant difference between the metric values before and after treatment, where *P < 0.05; **P < 0.01, ***P < 0.001, FDR corrected.
Figure 7
Figure 7
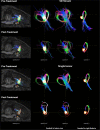
DWI tractography seeded in the lesion core and right fimbria is presented with both the FOD model using SD-Stream and the single tensor model. Left: mid-sagittal T1w image overlaid with the lesion core (seed region) and the tracts generated based on that seed (with opacity of 0.4). Middle: tracts seeded in the lesion core in 3D space with opacity of 0.5 and 1, respectively. Right: tracts seeded in the right fimbria (yellow circle) in 3D space. Tracts are colored by orientation (red, right–left; green, superior–inferior; blue, anterior–posterior).

References

    1. Jagannathan J, Sanghvi NK, Crum LA, Yen C-P, Medel R, Dumont AS, et al. High intensity focused ultrasound surgery (HIFU) of the brain: a historical perspective, with modern applications. Neurosurgery. (2009) 64:201–11. 10.1227/01.NEU.0000336766.18197.8E - DOI - PMC - PubMed
    1. Schlesinger D, Benedict S, Diederich C, Gedroyc W, Klibanov A, Larner J. MR-guided focused ultrasound surgery, present and future. Med Phys. (2013) 40:080901. 10.1118/1.4811136 - DOI - PMC - PubMed
    1. Chang WS, Jung HH, Kweon EJ, Zadicario E, Rachmilevitch I, Chang JW. Unilateral magnetic resonance guided focused ultrasound thalamotomy for essential tremor: practices and clinicoradiological outcomes. J Neurol Neurosurg Psychiatry. (2014) 86:257–64. 10.1136/jnnp-2014-307642 - DOI - PubMed
    1. Elias WJ, Lipsman N, Ondo WG, Ghanouni P, Kim YG, Lee W, et al. . A randomized trial of focused ultrasound thalamotomy for essential tremor. N Engl J Med. (2016) 375:730–9. 10.1056/NEJMoa1600159 - DOI - PubMed
    1. Zaaroor M, Sinai A, Goldsher D, Eran A, Nassar M, Schlesinger I. Magnetic resonance–guided focused ultrasound thalamotomy for tremor: a report of 30 Parkinson's disease and essential tremor cases. J Neurosurg. (2018) 128:202–10. 10.3171/2016.10.JNS16758 - DOI - PubMed