

Integrated Network Analysis Reveals FOXM1 and MYBL2 as Key Regulators of Cell Proliferation in Non-small Cell Lung Cancer
- PMID: 31681566
- PMCID: PMC6804573
- DOI: 10.3389/fonc.2019.01011
Integrated Network Analysis Reveals FOXM1 and MYBL2 as Key Regulators of Cell Proliferation in Non-small Cell Lung Cancer
Abstract
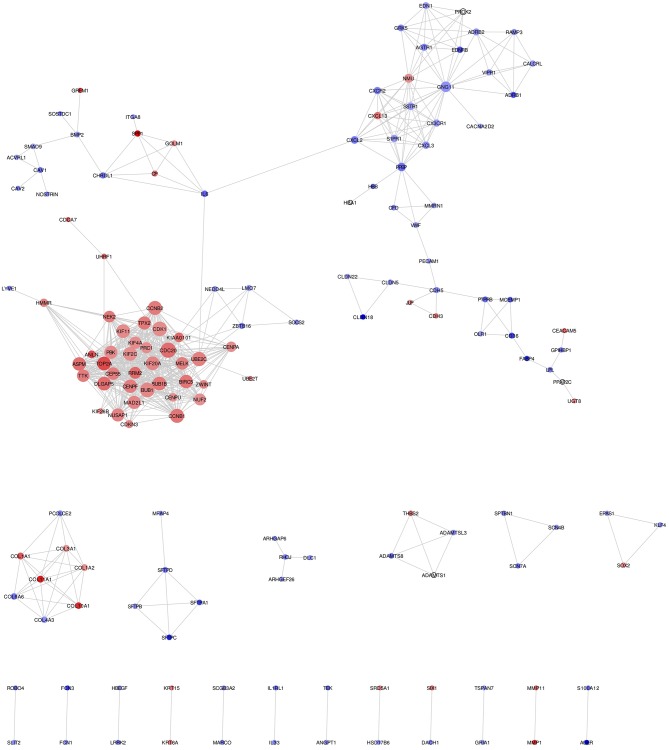
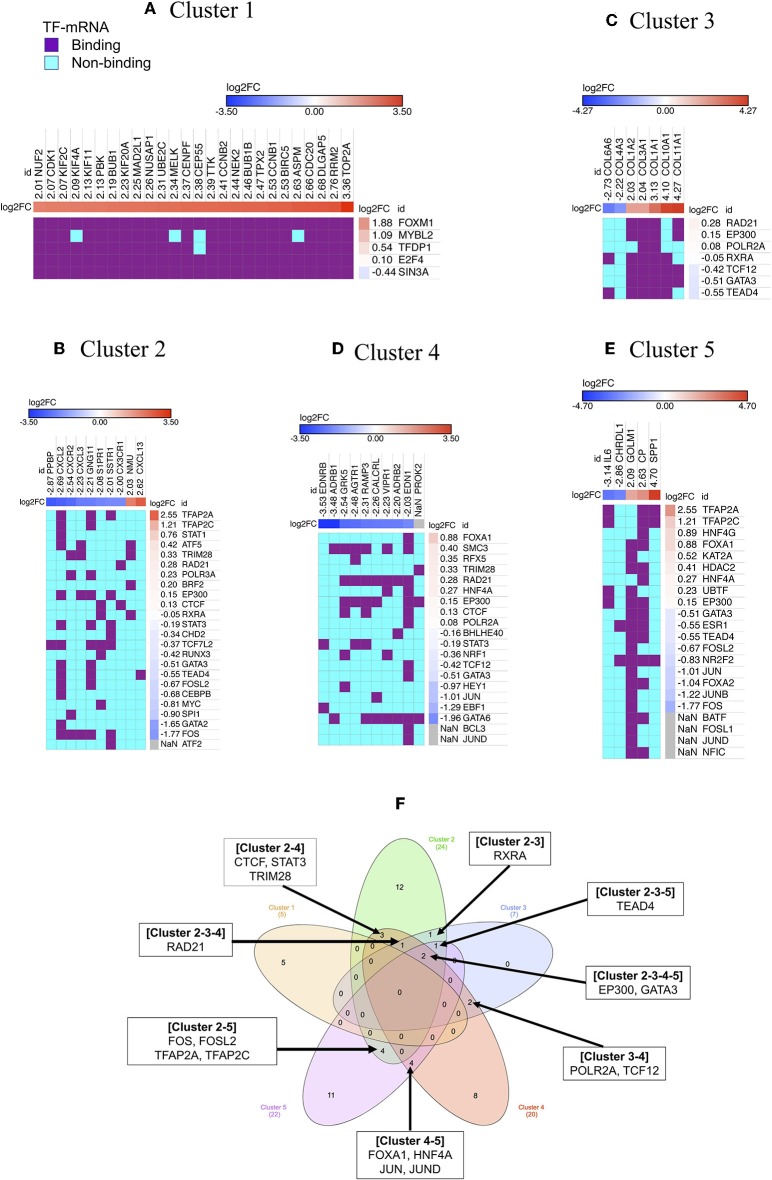
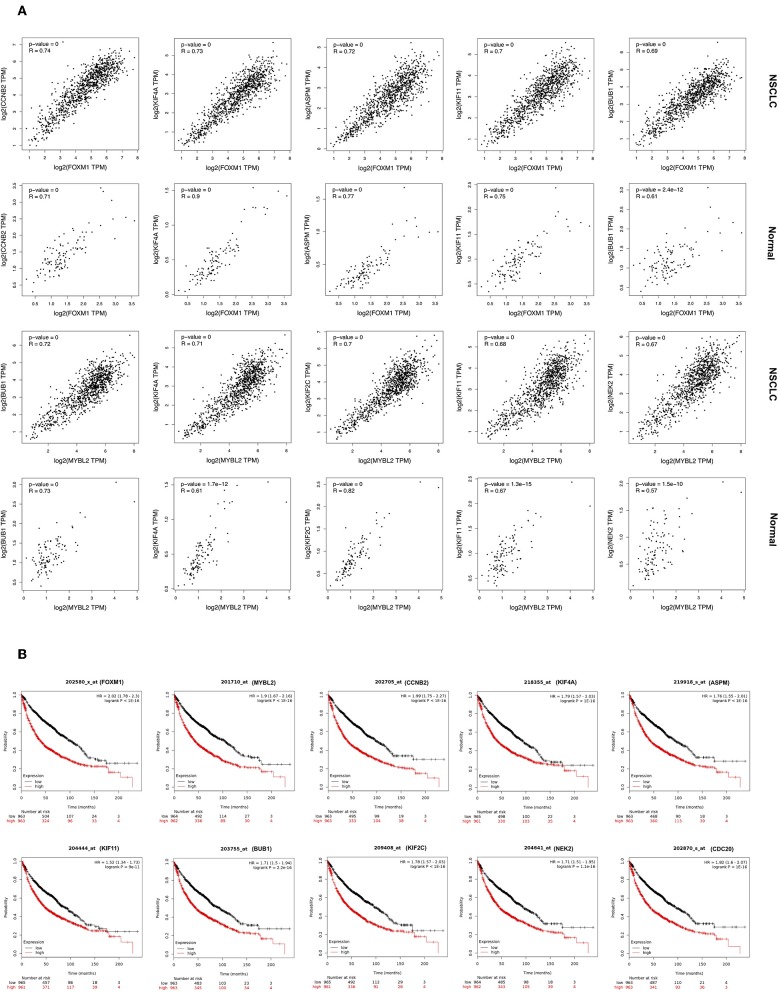
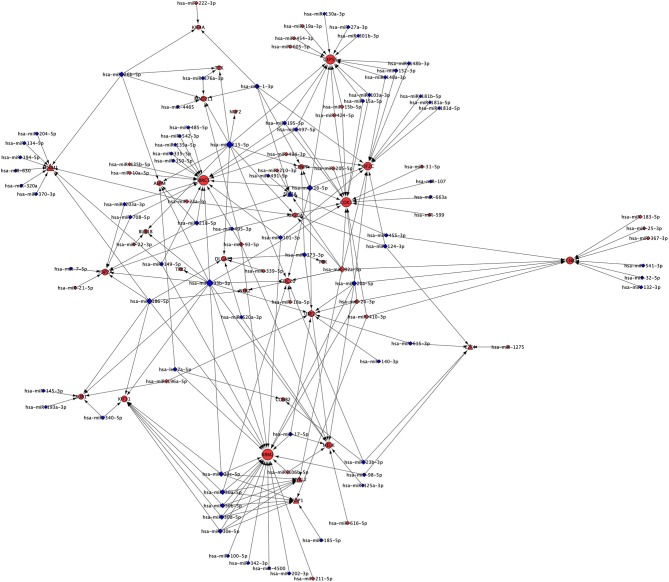
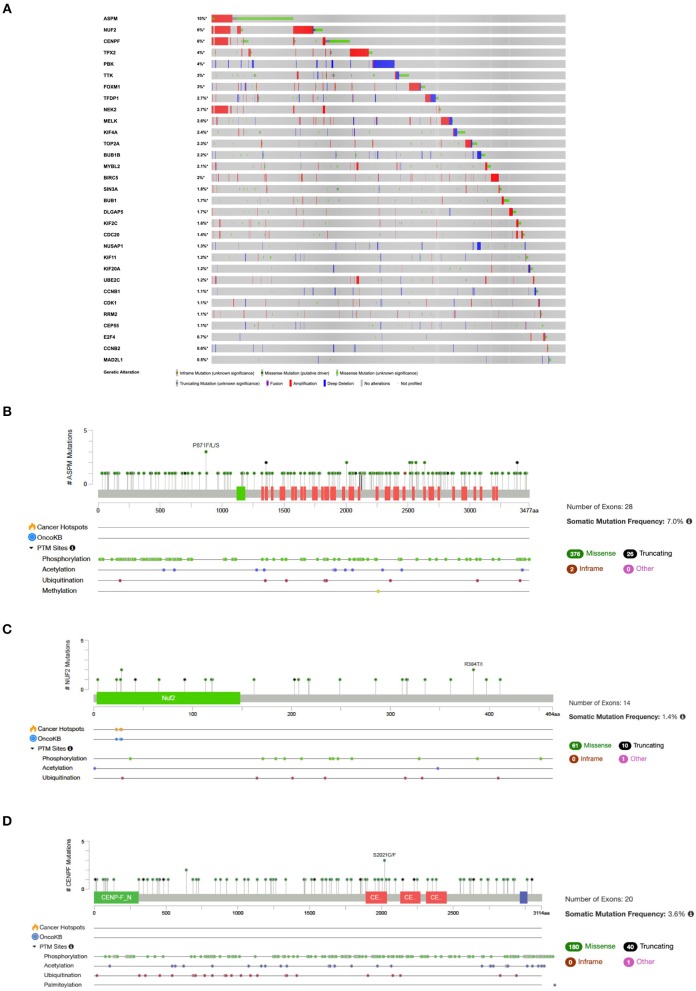
Background: Loss of control on cell division is an important factor for the development of non-small cell lung cancer (NSCLC), however, its molecular mechanism and gene regulatory network are not clearly understood. This study utilized the systems bioinformatics approach to reveal the "driver-network" involve in tumorigenic processes in NSCLC. Methods: A meta-analysis of gene expression data of NSCLC was integrated with protein-protein interaction (PPI) data to construct an NSCLC network. MCODE and iRegulone were used to identify the local clusters and its upstream transcription regulators involve in NSCLC. Pair-wise gene expression correlation was performed using GEPIA. The survival analysis was performed by the Kaplan-Meier plot. Results: This study identified a local "driver-network" with highest MCODE score having 26 up-regulated genes involved in the process of cell proliferation in NSCLC. Interestingly, the "driver-network" is under the regulation of TFs FOXM1 and MYBL2 as well as miRNAs. Furthermore, the overexpression of member genes in "driver-network" and the TFs are associated with poor overall survival (OS) in NSCLC patients. Conclusion: This study identified a local "driver-network" and its upstream regulators responsible for the cell proliferation in NSCLC, which could be promising biomarkers and therapeutic targets for NSCLC treatment.
Keywords: gene expression; gene network; meta-analysis; non-small cell lung cancer; systems bioinformatics.
Copyright © 2019 Ahmed.
Figures
Similar articles
-
Identification of key differentially expressed mRNAs and microRNAs in non-small cell lung cancer using bioinformatics analysis.Exp Ther Med. 2020 Oct;20(4):3720-3732. doi: 10.3892/etm.2020.9105. Epub 2020 Aug 6. Exp Ther Med. 2020. PMID: 32855723 Free PMC article.
-
Identification and Integrated Analysis of Key Biomarkers for Diagnosis and Prognosis of Non-Small Cell Lung Cancer.Med Sci Monit. 2019 Dec 5;25:9280-9289. doi: 10.12659/MSM.918620. Med Sci Monit. 2019. PMID: 31805030 Free PMC article.
-
Target gene screening and evaluation of prognostic values in non-small cell lung cancers by bioinformatics analysis.Gene. 2018 Mar 20;647:306-311. doi: 10.1016/j.gene.2018.01.003. Epub 2018 Jan 3. Gene. 2018. PMID: 29305979
-
Identification of target gene and prognostic evaluation for lung adenocarcinoma using gene expression meta-analysis, network analysis and neural network algorithms.J Biomed Inform. 2018 Oct;86:120-134. doi: 10.1016/j.jbi.2018.09.004. Epub 2018 Sep 6. J Biomed Inform. 2018. PMID: 30195659
-
Identification of novel biomarkers and candidate small molecule drugs in non-small-cell lung cancer by integrated microarray analysis.Onco Targets Ther. 2019 May 13;12:3545-3563. doi: 10.2147/OTT.S198621. eCollection 2019. Onco Targets Ther. 2019. PMID: 31190860 Free PMC article.
Cited by
-
A Systems Biology and LASSO-Based Approach to Decipher the Transcriptome-Interactome Signature for Predicting Non-Small Cell Lung Cancer.Biology (Basel). 2022 Nov 30;11(12):1752. doi: 10.3390/biology11121752. Biology (Basel). 2022. PMID: 36552262 Free PMC article.
-
Analyzing the characteristics of immune cell infiltration in lung adenocarcinoma via bioinformatics to predict the effect of immunotherapy.Immunogenetics. 2021 Oct;73(5):369-380. doi: 10.1007/s00251-021-01223-8. Epub 2021 Jul 24. Immunogenetics. 2021. PMID: 34302518
-
Identification of the oncogenic role of centromere protein M in non-small cell lung cancer via CDC20/MYBL2/Wnt signaling pathways.J Mol Histol. 2025 Apr 26;56(3):144. doi: 10.1007/s10735-025-10423-5. J Mol Histol. 2025. PMID: 40285932 Free PMC article.
-
Lung Cancer Gene Regulatory Network of Transcription Factors Related to the Hallmarks of Cancer.Curr Issues Mol Biol. 2023 Jan 5;45(1):434-464. doi: 10.3390/cimb45010029. Curr Issues Mol Biol. 2023. PMID: 36661515 Free PMC article.
-
Role of lncRNA FAM83H antisense RNA1 (FAM83H-AS1) in the progression of non-small cell lung cancer by regulating the miR-545-3p/heparan sulfate 6-O-sulfotransferase (HS6ST2) axis.Bioengineered. 2022 Mar;13(3):6476-6489. doi: 10.1080/21655979.2022.2031668. Bioengineered. 2022. PMID: 35260044 Free PMC article.
References
-
- Pao W, Miller V, Zakowski M, Doherty J, Politi K, Sarkaria I, et al. . EGF receptor gene mutations are common in lung cancers from “never smokers” and are associated with sensitivity of tumors to gefitinib and erlotinib. Proc Natl Acad Sci USA. (2004) 101:13306–11. 10.1073/pnas.0405220101 - DOI - PMC - PubMed
LinkOut - more resources
Full Text Sources
Miscellaneous