. 2019 Oct 15:9:1059.
doi: 10.3389/fonc.2019.01059. eCollection 2019.

Identification of a Five-Pseudogene Signature for Predicting Survival and Its ceRNA Network in Glioma

Affiliations

Identification of a Five-Pseudogene Signature for Predicting Survival and Its ceRNA Network in Glioma

Yulin Wang et al. Front Oncol. .

Abstract

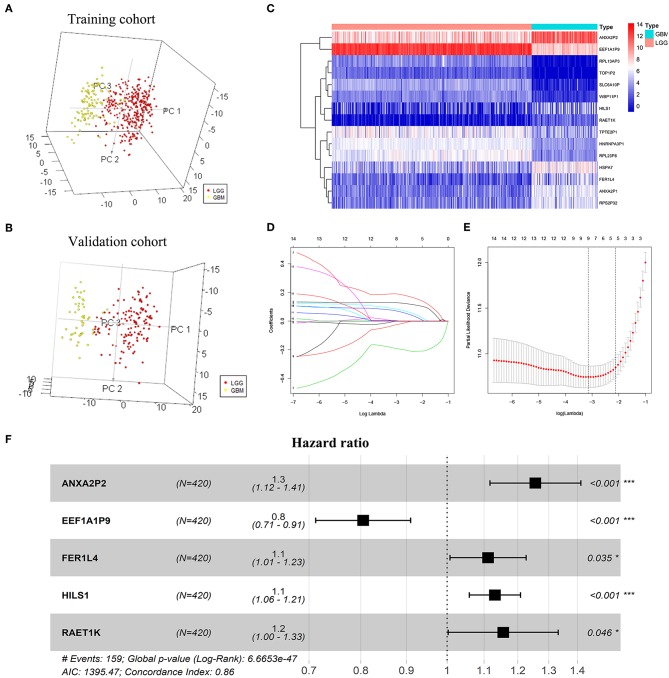
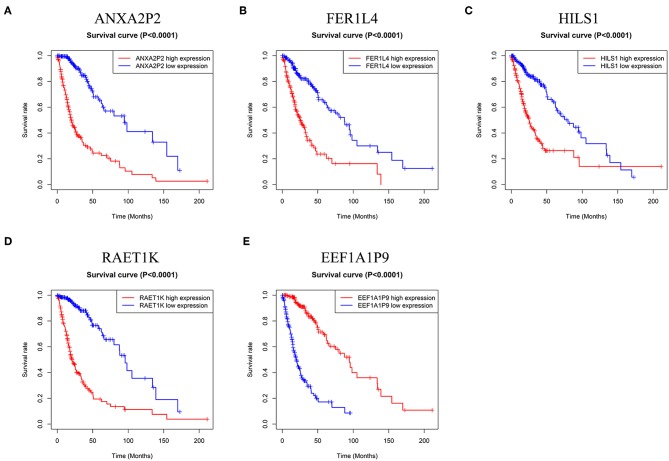
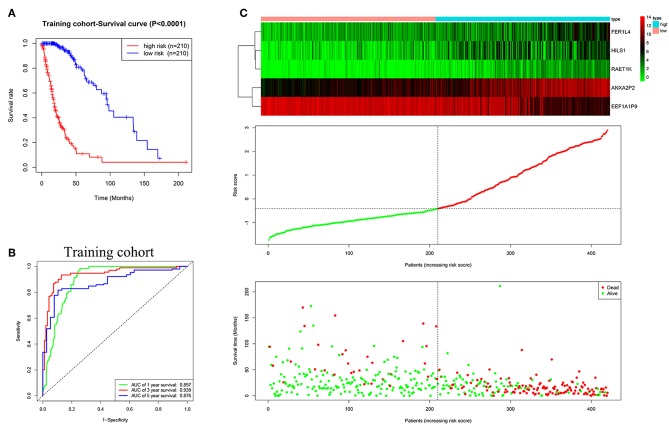
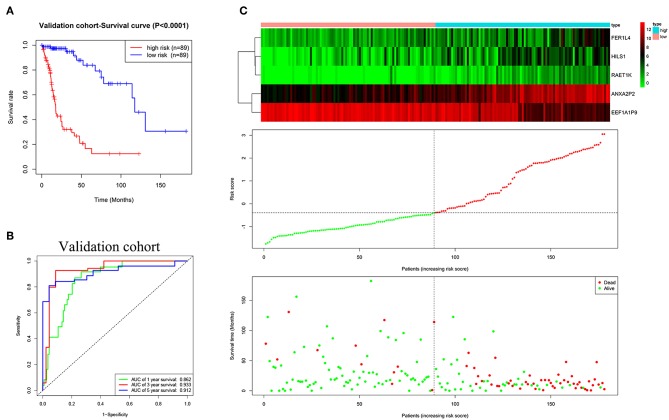
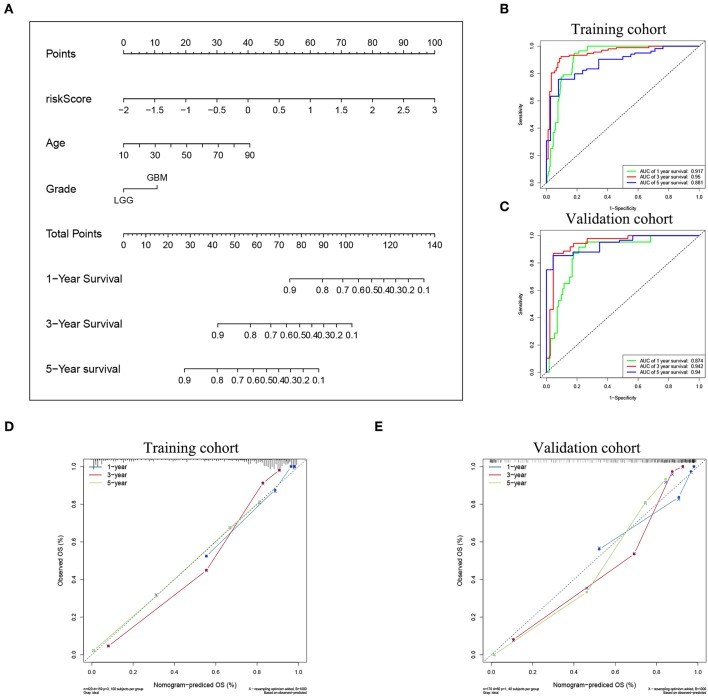
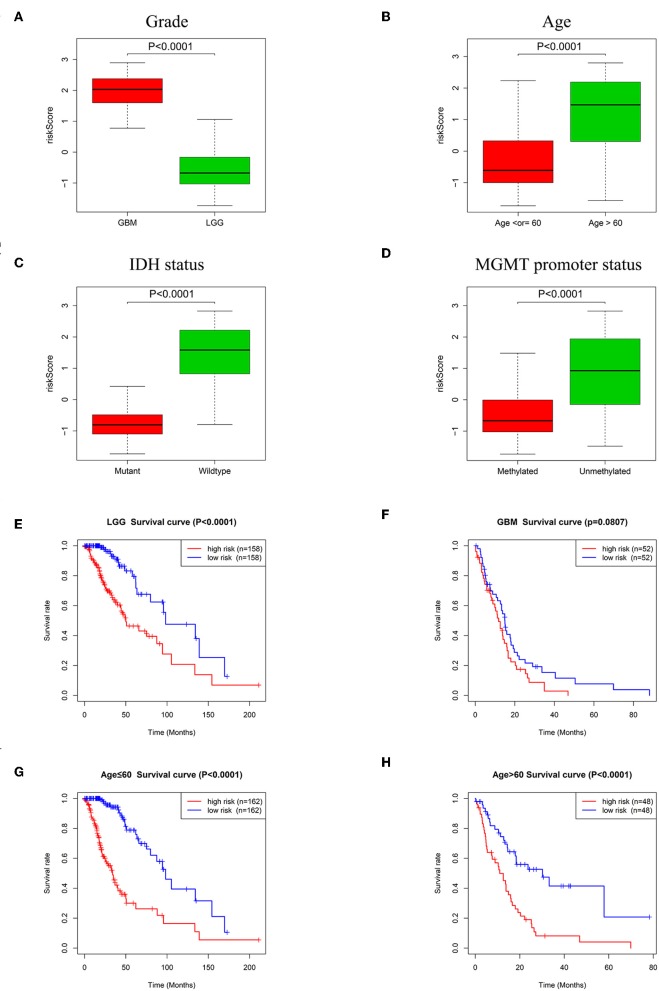
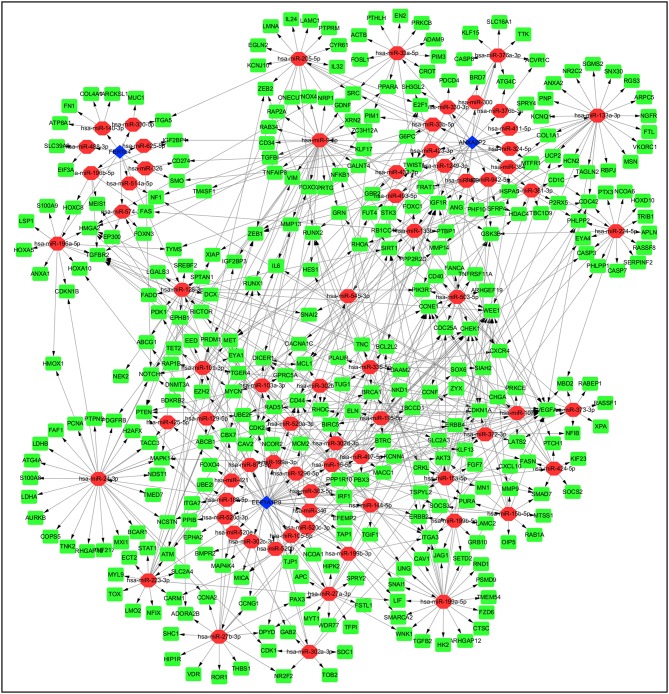
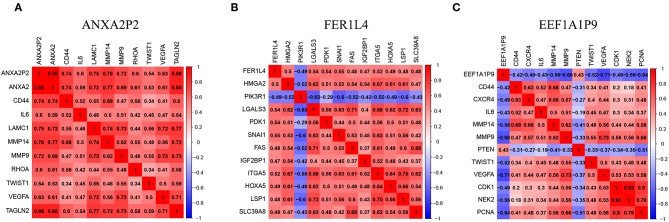
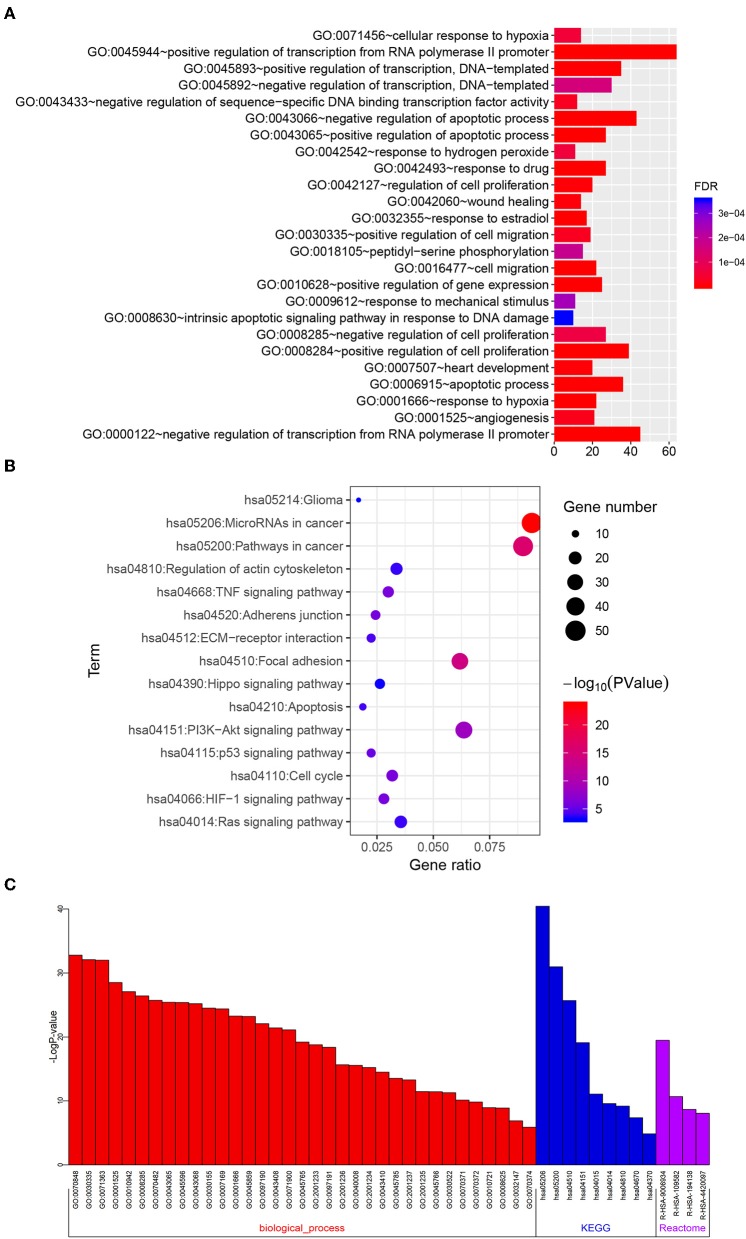
Background: Glioma is the most common primary brain tumor with a dismal prognosis. It is urgent to develop novel molecular biomarkers and conform to individualized schemes. Methods: Differentially expressed pseudogenes between low grade glioma (LGG) and glioblastoma multiforme (GBM) were identified in the training cohort. Least absolute shrinkage and selection operator (LASSO) regression and multivariate Cox proportional hazards regression analyses were used to select pseudogenes associated with prognosis of glioma. A risk signature was constructed based on the selected pseudogenes for predicting the survival of glioma patients. A pseudogene-miRNA-mRNA regulatory network was established and visualized using Cytoscape 3.5.1. Gene Oncology (GO) and signaling pathway analyses were performed on the targeted genes to investigate functional roles of the risk signature. Results: Five pseudogenes (ANXA2P2, EEF1A1P9, FER1L4, HILS1, and RAET1K) correlating with glioma survival were selected and used to establish a risk signature. Time-dependent receiver operating characteristic (ROC) curves revealed that the risk signature could accurately predict the 1, 3, and 5-year survival of glioma patients. GO and signaling pathway analyses showed that the risk signature was involved in regulation of proliferation, migration, angiogenesis, and apoptosis in glioma. Conclusions: In this study, a risk signature with five pseudogenes was constructed and shown to accurately predict 1-, 3-, and 5-year survival for glioma patient. The risk signature may serve as a potential target against glioma.

Keywords: ceRNA; glioma; nomogram; pseudogene; risk signature.


Figures

Figure 1
Figure 1
Screening pseudogenes used for constructing the risk signature for glioma. Principal components analysis of pseudogenes between glioblastoma (GBM) and low grade glioma (LGG) in the training cohort (A) and the validation cohort (B). (C) Heatmap showed the pseudogenes differentially expressed between LGG and GBM in the training cohort (| log2(fold-change) | ≥ 2 and FDR < 0.05). (D) Log (Lambda) value of the 15 pseudogenes in LASSO model. (E) The most appropriate log (Lambda) value in the LASSO model. (F) Multivariate Cox regression analysis was performed and five pseudogenes (ANXA2P2, EEF1A1P9, FER1L4, HILS1, and RAET1K) were selected to construct the risk signature.
Figure 2
Figure 2
Kaplan-Meier survival curves for the five pseudogenes in glioma. (A–D) High expression level of ANXA2P2, FER1L4, HILS1, and RAET1K indicated poorer prognosis in glioma patients (P < 0.0001). (E) Glioma patients with higher expression level of EEF1A1P9 had favorable prognosis (P < 0.0001).
Figure 3
Figure 3
Characteristics of the five-pseudogene risk signature in the training cohort. (A) Survival curves for high-risk and low-risk groups classified by the risk signature in the training cohort. (B) ROC curves for the 1-, 3-, and 5-year survival according to the five-pseudogene risk signature in the training cohort. (C) Glioma expression profiles of the five pseudogenes, risk score distributions and patient survival in the training cohort.
Figure 4
Figure 4
Evaluating the efficacy of the five pseudogenes risk signature in the validation cohort. (A) Survival curves for high-risk and low-risk groups classified by the risk signature in the validation cohort. (B) ROC curves for the 1-, 3-, and 5-year survival according to the five-pseudogene risk signature in the validation cohort. (C) Glioma expression profiles of the five pseudogenes, risk score distributions and patient survival in the validation cohort.
Figure 5
Figure 5
Nomogram for predicting the survival rate of glioma patient. (A) A nomogram was established based on the risk signature, age, and grade for predicting survival of glioma patient. ROC curves were used for evaluating the efficiency of the nomogram. (B) AUCs for predicting 1-, 3-, and 5-year survival were 0.917, 0.95, and 0.881, respectively, in the training cohort. (C) AUCs for predicting 1-, 3-, and 5-year survival were 0.874, 0.942, and 0.94, respectively, in the validation cohort. Calibration plot of observed and predicted probabilities for the nomogram in the training cohort (D) and validation cohort (E).
Figure 6
Figure 6
Association between the risk signature and different cohorts stratified by glioma grade, age, IDH status and MGMT promoter status. (A) Risk scores in GBM were higher than that in LGG (P < 0.0001). (B) Patients >60 years old had higher risk scores than patients ≤60 years old (P < 0.0001). (C) Risk scores in IDH mutation samples were lower than IDH wildtype samples (P < 0.0001). (D) Risk scores in MGMT promoter methylated samples decreased compared with samples with the MGMT promoter unmethylated (P < 0.0001). (E) K-M survival curves indicated the high-risk group had adverse outcome in LGG (P < 0.0001). (F) K-M survival curve for the high-risk group and low-risk group in GBM (P = 0.0807). Patients in the high-risk group had poorer prognosis than patients in the low-risk group independent of age ≤60 (G, P < 0.0001) or age >60 (H, P < 0.0001).
Figure 7
Figure 7
Construction of pseudogene-miRNA-mRNA regulatory networks. Pseudogenes together with binding miRNAs and target genes related to the three pseudogenes with | r | ≥ 0.4 were used to construct the pseudogene-miRNA-mRNA regulatory networks. Blue diamonds represented pseudogenes, which are located at the cores of the networks. Red ellipses and green rectangles stand for binding miRNAs and target genes, respectively.
Figure 8
Figure 8
Pseudogenes (ANXA2P2, FER1L4, and EEF1A1P9)-related genes in glioma. (A–C) The heatmaps showed some representative genes highly correlated with the three pseudogenes (| r | ≥ 0.4).
Figure 9
Figure 9
Functional roles of the six-pseudogene risk signature. Gene oncology (A) and KEGG pathway (B) analyses were performed on the related target genes via DAVID. (C) Metascape was used to confirm the functional and pathway analysis in biological processes, KEGG, and Reactome pathways.

References

    1. Gladson CL, Prayson RA, Liu WM. The pathobiology of glioma tumors. Annu Rev Pathol. (2010) 5:33–50. 10.1146/annurev-pathol-121808-102109 - DOI - PMC - PubMed
    1. Delgado-Lopez PD, Corrales-Garcia EM. Survival in glioblastoma: a review on the impact of treatment modalities. Clin Transl Oncol. (2016) 18:1062–71. 10.1007/s12094-016-1497-x - DOI - PubMed
    1. Ferreira J, Ramos AA, Almeida T, Azqueta A, Rocha E. Drug resistance in glioblastoma and cytotoxicity of seaweed compounds, alone and in combination with anticancer drugs: a mini review. Phytomedicine. (2018) 48:84–93. 10.1016/j.phymed.2018.04.062 - DOI - PubMed
    1. Hombach-Klonisch S, Mehrpour M, Shojaei S, Harlos C, Pitz M, Hamai A, et al. Glioblastoma and chemoresistance to alkylating agents: Involvement of apoptosis, autophagy, and unfolded protein response. Pharmacol Ther. (2018) 184:13–41. 10.1016/j.pharmthera.2017.10.017 - DOI - PubMed
    1. Hamisch C, Ruge M, Kellermann S, Kohl AC, Duval I, Goldbrunner R, et al. Impact of treatment on survival of patients with secondary glioblastoma. J Neurooncol. (2017) 133:309–13. 10.1007/s11060-017-2415-y - DOI - PubMed

LinkOut - more resources