In vivo Diffusion Tensor Magnetic Resonance Tractography of the Sheep Brain: An Atlas of the Ovine White Matter Fiber Bundles
- PMID: 31681805
- PMCID: PMC6805705
- DOI: 10.3389/fvets.2019.00345
In vivo Diffusion Tensor Magnetic Resonance Tractography of the Sheep Brain: An Atlas of the Ovine White Matter Fiber Bundles
Abstract
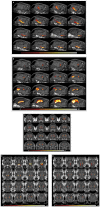
Diffusion Tensor Magnetic Resonance Imaging (DTI) allows to decode the mobility of water molecules in cerebral tissue, which is highly directional along myelinated fibers. By integrating the direction of highest water diffusion through the tissue, DTI Tractography enables a non-invasive dissection of brain fiber bundles. As such, this technique is a unique probe for in vivo characterization of white matter architecture. Unraveling the principal brain texture features of preclinical models that are advantageously exploited in experimental neuroscience is crucial to correctly evaluate investigational findings and to correlate them with real clinical scenarios. Although structurally similar to the human brain, the gyrencephalic ovine model has not yet been characterized by a systematic DTI study. Here we present the first in vivo sheep (ovis aries) tractography atlas, where the course of the main white matter fiber bundles of the ovine brain has been reconstructed. In the context of the EU's Horizon EDEN2020 project, in vivo brain MRI protocol for ovine animal models was optimized on a 1.5T scanner. High resolution conventional MRI scans and DTI sequences (b-value = 1,000 s/mm2, 15 directions) were acquired on ten anesthetized sheep o. aries, in order to define the diffusion features of normal adult ovine brain tissue. Topography of the ovine cortex was studied and DTI maps were derived, to perform DTI tractography reconstruction of the corticospinal tract, corpus callosum, fornix, visual pathway, and occipitofrontal fascicle, bilaterally for all the animals. Binary masks of the tracts were then coregistered and reported in the space of a standard stereotaxic ovine reference system, to demonstrate the consistency of the fiber bundles and the minimal inter-subject variability in a unique tractography atlas. Our results determine the feasibility of a protocol to perform in vivo DTI tractography of the sheep, providing a reliable reconstruction and 3D rendering of major ovine fiber tracts underlying different neurological functions. Estimation of fiber directions and interactions would lead to a more comprehensive understanding of the sheep's brain anatomy, potentially exploitable in preclinical experiments, thus representing a precious tool for veterinaries and researchers.
Keywords: DTI tractography; atlas; brain; diffusion tensor imaging; sheep.
Copyright © 2019 Pieri, Trovatelli, Cadioli, Zani, Brizzola, Ravasio, Acocella, Di Giancamillo, Malfassi, Dolera, Riva, Bello, Falini and Castellano.
Figures


Similar articles
-
In vivo DTI tractography of the rat brain: an atlas of the main tracts in Paxinos space with histological comparison.Magn Reson Imaging. 2015 Apr;33(3):296-303. doi: 10.1016/j.mri.2014.11.001. Epub 2014 Dec 5. Magn Reson Imaging. 2015. PMID: 25482578
-
Comparing a diffusion tensor and non-tensor approach to white matter fiber tractography in chronic stroke.Neuroimage Clin. 2015 Mar 14;7:771-81. doi: 10.1016/j.nicl.2015.03.007. eCollection 2015. Neuroimage Clin. 2015. PMID: 25844329 Free PMC article.
-
Three-dimensional high-resolution diffusion tensor imaging and tractography of the developing rabbit brain.Dev Neurosci. 2008;30(4):262-75. doi: 10.1159/000110503. Epub 2007 Oct 26. Dev Neurosci. 2008. PMID: 17962716
-
[Magnetic resonance diffusion tractography in the brain--its application and limitation].Brain Nerve. 2007 May;59(5):467-76. Brain Nerve. 2007. PMID: 17533972 Review. Japanese.
-
Diffusion tensor imaging: a review for pediatric researchers and clinicians.J Dev Behav Pediatr. 2010 May;31(4):346-56. doi: 10.1097/DBP.0b013e3181dcaa8b. J Dev Behav Pediatr. 2010. PMID: 20453582 Free PMC article. Review.
Cited by
-
Reconstruction of ovine axonal cytoarchitecture enables more accurate models of brain biomechanics.Commun Biol. 2022 Oct 17;5(1):1101. doi: 10.1038/s42003-022-04052-x. Commun Biol. 2022. PMID: 36253409 Free PMC article.
-
Mapping sheep to human brain: The need for a sheep brain atlas.Front Vet Sci. 2022 Jul 29;9:961413. doi: 10.3389/fvets.2022.961413. eCollection 2022. Front Vet Sci. 2022. PMID: 35967997 Free PMC article. Review.
-
Modular robotic platform for precision neurosurgery with a bio-inspired needle: System overview and first in-vivo deployment.PLoS One. 2022 Oct 19;17(10):e0275686. doi: 10.1371/journal.pone.0275686. eCollection 2022. PLoS One. 2022. PMID: 36260553 Free PMC article.
-
The Translational Benefits of Sheep as Large Animal Models of Human Neurological Disorders.Front Vet Sci. 2022 Feb 15;9:831838. doi: 10.3389/fvets.2022.831838. eCollection 2022. Front Vet Sci. 2022. PMID: 35242840 Free PMC article. Review.
-
Neuroanatomical Reconstruction of the Canine Visual Pathway Using Diffusion Tensor Imaging.Front Neuroanat. 2020 Aug 18;14:54. doi: 10.3389/fnana.2020.00054. eCollection 2020. Front Neuroanat. 2020. PMID: 32973464 Free PMC article.
References
LinkOut - more resources
Full Text Sources
Research Materials

