. 2019 Oct 23;5(10):eaaw6870.
doi: 10.1126/sciadv.aaw6870. eCollection 2019 Oct.

Red blood cell-derived nanoerythrosome for antigen delivery with enhanced cancer immunotherapy

Affiliations

Red blood cell-derived nanoerythrosome for antigen delivery with enhanced cancer immunotherapy

Xiao Han et al. Sci Adv. .

Abstract

Erythrocytes or red blood cells (RBCs) represent a promising cell-mediated drug delivery platform due to their inherent biocompatibility. Here, we developed an antigen delivery system based on the nanoerythrosomes derived from RBCs, inspired by the splenic antigen-presenting cell targeting capacity of senescent RBCs. Tumor antigens were loaded onto the nanoerythrosomes by fusing tumor cell membrane-associated antigens with nanoerythrosomes. This tumor antigen-loaded nanoerythrosomes (nano-Ag@erythrosome) elicited antigen responses in vivo and, in combination with the anti-programmed death ligand 1 (PD-L1) blockade, inhibited the tumor growth in B16F10 and 4T1 tumor models. We also generated a tumor model showing that "personalized nano-Ag@erythrosomes" could be achieved by fusing RBCs and surgically removed tumors, which effectively reduced tumor recurrence and metastasis after surgery.


Figures

Fig. 1
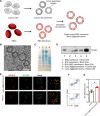
Fig. 1. Schematic and characterization of nano-Ag@erythrosomes.
(A) Schematic of preparation of nano-Ag@erythrosomes by fusing tumor antigen–associated cell membrane into nanoerythrosomes. (B) Representative TEM image of nano-Ag@erythrosomes. Scale bar, 250 nm. (C) SDS-PAGE pattern of proteins from (1) marker, (2) nano-Ag@erythrosomes, (3) B16F10 cell membrane, and (4) RBC cell membrane. (D) Western blot result of gp100 on various groups after immunoprecipitation with anti–Band-3. Equal quantities of protein from each sample were subjected to SDS-PAGE and immunoblotting with gp100-specific monoclonal antibody (Ab). Western blot showed that the tumor antigen gp100 was fused into nano-Ag@erythrosomes. (E) Confocal laser scanning microscopy images of mouse bone marrow–derived DCs treated with nano-Ag@erythrosomes for 2 hours. A mixture of RBC and B16F10 membranes was used as control. Scale bars, 5 μm (left) and 2 μm (right). (F) Representative flow cytometric analysis of maturation of mouse bone marrow–derived DCs treated in vitro with nano-Ag@erythrosomes for 12 hours and (G) corresponding quantification results (n = 3). Data are means ± SEM. Statistical significance was calculated by Student’s t-test. *P < 0.05.
Fig. 2
Fig. 2. Nano-Ag@erythrosomes target the splenic APC and induce activation of immune cells.
(A) Fluorescence imaging of C57BL/6 mice (n = 3) 1 hour after intravenous injection of nano-Ag@erythrosomes at various ratios. (B to D) Ex vivo imaging of spleen 1 hour after intravenous injection of nano-Ag@erythrosomes at various ratios (B) and corresponding quantification results (n = 3) (C). (D) Confocal images of splenic localization of MHC II+ and Cy5.5 double-positive cells in C57BL/6 mice (n = 3) 1 hour after intravenous injection of Cy5.5-labeled nano-Ag@erythrosomes. (Upper left: Splenocyte of mice in 1:0 group. Bottom left: Splenocyte of mice in 1:20 group.) Scale bars, 50 μm (left) and 10 μm (right). (E) Flow cytometric analysis of various activation markers and PD-L1 in DCs (gated on CD11c+) in spleen of untreated mice and mice treated with DiD-labeled nano-Ag@erythrosome and (F) corresponding quantification of mean fluorescence intensity (MFI) according to (E). ns, not significant. (G) Activation markers measured 24 hours after intravenous injection of nano-Ag@erythrosomes in splenic immune cell subsets (red for treatment, gray for control). (H) Corresponding quantification of MFI according to (G) (n = 5). (I) Cytokines level in serum 24 and 48 hours after intravenous injection of nano-Ag@erythrosomes. For (F) and (H), data are means ± SD. Statistical significance was calculated by Student’s t-test. For (C) and (I), data are means ± SEM. Statistical significance was calculated by one-way ANOVA with Tukey’s post hoc test. *P < 0.05; **P < 0.01; ***P < 0.005; ****P < 0.001.
Fig. 3
Fig. 3. Combination immunotherapy for inhibition of B16F10-Luc melanoma growth in vivo.
(A) Schematic representation of the B16F10-Luc tumor model. s.c., subcutaneously; i.v., intravenously. (B and C) Individual (B) and average (C) tumor growth kinetics in control and treated groups (n = 7 to 10). Growth curves represent means ± SEM; growth curves were stopped when the first animal of the corresponding group died. Animals were euthanized when exhibiting signs of impaired health or when the volume of the tumor exceeded 1.5 cm3. (D) Survival curves for the treated and control mice. (E) Body weight of mice after different treatments as indicated. (F) Representative dot plots showing the number of CD4+ and CD8+ T cells as a percentage of the total CD45+ cell population in the tumor after different treatments as indicated and (G) corresponding quantification results (n ≥ 4). (H) Flow cytometric analysis of PD-L1 expression in tumor (gated on CD45) after different treatments as indicated and (I) corresponding quantification results (n = 3). (J) Flow cytometric analysis of the percentage of intracellular IFN-γ+ CD8+ T cells in tumor after different treatments as indicated and (K) corresponding quantification results (n ≥ 4). Data are means ± SEM. For (D), statistical significance was calculated by Log-rank (Mantel-Cox) test. For (I), (G) and (K), statistical significance was calculated by one-way ANOVA with Tukey’s post hoc test. *P < 0.05; **P < 0.01. ***P < 0.005.
Fig. 4
Fig. 4. Personalized nano-Ag@erythrosomes for inhibition cancer metastasis and recurrence after surgery.
(A) Schematic of preparation of personalized nano-Ag@erythrosomes. (B) Schematic representation of the primary tumor resection and distant tumor model. (C) In vivo bioluminescence imaging of the distant B16F10-Luc tumors after different treatments as indicated. (D) Individual and average tumor growth kinetics in control and treated groups (n ≥ 5). Growth curves represent means ± SEM; growth curves were stopped when the first animal of the corresponding group died. (E) Survival curves for the treated and control mice. (F) Body weight of mice after different treatments as indicated. Data are means ± SEM. For (D), statistical significance was calculated by one-way ANOVA with Tukey’s post hoc test. For (E), statistical significance was calculated by Log-rank (Mantel-Cox) test. **P < 0.01.

References

    1. Zou W., Wolchok J. D., Chen L., PD-L1 (B7-H1) and PD-1 pathway blockade for cancer therapy: Mechanisms, response biomarkers, and combinations. Sci. Transl. Med. 8, 328rv324 (2016). - PMC - PubMed
    1. Ribas A., Wolchok J. D., Cancer immunotherapy using checkpoint blockade. Science 359, 1350–1355 (2018). - PMC - PubMed
    1. Sanmamed M. F., Chen L., A paradigm shift in cancer immunotherapy: From enhancement to normalization. Cell 175, 313–326 (2018). - PMC - PubMed
    1. Tang J., Yu J. X., Hubbard-Lucey V. M., Neftelinov S. T., Hodge J. P., Lin Y., The clinical trial landscape for PD1/PDL1 immune checkpoint inhibitors. Nat. Rev. Drug Discov. 17, 854–855 (2018). - PubMed
    1. Postow M. A., Sidlow R., Hellmann M. D., Immune-related adverse events associated with immune checkpoint blockade. N. Engl. J. Med. 378, 158–168 (2018). - PubMed

Publication types

MeSH terms